Somers Point, NJ (New Jersey) Houses and Residents
| Somers Point: | $285,444 |
| New Jersey: | $428,900 |
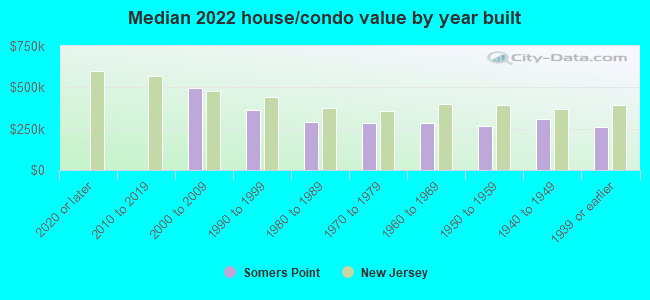
Mean price in 2022:
Detached houses: $292,567
Here: $292,567 State: $537,591 Townhouses or other attached units: $336,150
Here: $336,150 State: $381,113 In 2-unit structures: $615,505
Here: $615,505 State: $444,476 In 3-to-4-unit structures: $400,065
Here: $400,065 State: $457,463 In 5-or-more-unit structures: $346,178
Here: $346,178 State: $368,745
Total population: 10,756 (All urban)
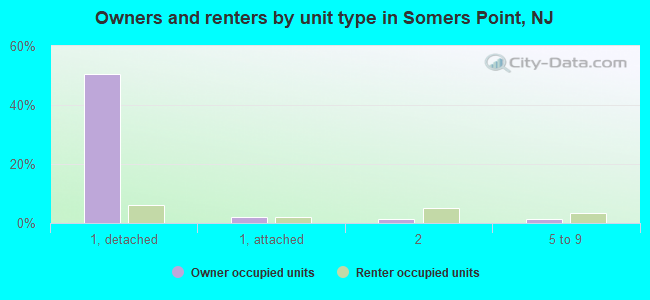
Houses: 5,715 (4,662 occupied: 2,456 owner occupied, 2,207 renter occupied)
| % of renters here: | 47% |
| State: | 35% |
Housing density: 1,419 houses/condos per square mile
Median price asked for vacant for-sale houses and condos in 2022: $199,495.
Median contract rent in 2022: $1,165 (lower quartile is $963, upper quartile is $1,433)
Median rent asked for vacant for-rent units in 2022: $940
Median gross rent in Somers Point, NJ in 2022: $1,274
Housing units in Somers Point with a mortgage: 1,273 (84 second mortgage, 16 home equity loan, 60 both second mortgage and home equity loan)
Houses without a mortgage: 19
Median household income for houses/condos with a mortgage: $101,562
Median household income for apartments without a mortgage: $88,136
Median monthly housing costs: $1,322
Compare current foreclosures near Somers Point, NJ:
| Photo | Address | Area | Beds / Baths | Price | Details |
|---|---|---|---|---|---|

|
#1
E Cedar Ave
Somers Point, NJ 08244
|
- sq. feet
|
- baths - beds |
show details | |

|
#2
Campbell Ave
Somers Point, NJ 08244
|
- sq. feet
|
- baths - beds |
show details | |

|
#3
Colgate Rd
Somers Point, NJ 08244
|
2,188 sq. feet
|
- baths - beds |
show details | |

|
#4
Shore Rd Apt 188
Somers Point, NJ 08244
|
- sq. feet
|
- baths - beds |
show details | |

|
#5
3rd St
Somers Point, NJ 08244
|
2,112 sq. feet
|
- baths - beds |
show details | |

|
#6
Mays Landing Rd Apt 54
Somers Point, NJ 08244
|
- sq. feet
|
- baths - beds |
show details | |

|
#7
Colwick Dr
Somers Point, NJ 08244
|
1,586 sq. feet
|
- baths - beds |
show details | |

|
#8
N Connecticut Ave
Atlantic City, NJ 08401
|
1,200 sq. feet
|
1 baths 3 beds |
$139,900
|
show details |

|
#9
4th St
Somers Point, NJ 08244
|
- sq. feet
|
- baths - beds |
show details | |

|
#10
Franklin Dr
Somers Point, NJ 08244
|
- sq. feet
|
- baths - beds |
show details |
| Photo | Address | Area | Beds / Baths | Price | Details |
|---|---|---|---|---|---|

|
#11
Bala Dr
Somers Point, NJ 08244
|
- sq. feet
|
- baths - beds |
show details | |

|
#12
2nd St
Somers Point, NJ 08244
|
- sq. feet
|
- baths - beds |
show details | |

|
#13
W Dawes Ave
Somers Point, NJ 08244
|
- sq. feet
|
- baths - beds |
show details | |

|
#14
Birch Grove Rd
Northfield, NJ 08225
|
- sq. feet
|
1 baths 3 beds |
$249,900
|
show details |

|
#15
Rhododendron Ct
Mays Landing, NJ 08330
|
- sq. feet
|
2 baths 3 beds |
$156,000
|
show details |

|
#16
N Ohio Ave
Atlantic City, NJ 08401
|
3,320 sq. feet
|
4 baths 6 beds |
show details | |

|
#17
Florida Ave
Egg Harbor Township, NJ 08234
|
1,008 sq. feet
|
1 baths 3 beds |
show details | |

|
#18
Martin Ter
Pleasantville, NJ 08232
|
1,436 sq. feet
|
1 baths 3 beds |
show details | |

|
#19
E Mourning Dove Way
Absecon, NJ 08205
|
2,324 sq. feet
|
2 baths 4 beds |
show details | |

|
#20
Route 50
Woodbine, NJ 08270
|
1,682 sq. feet
|
2 baths 3 beds |
show details |
| Photo | Address | Area | Beds / Baths | Price | Details |
|---|---|---|---|---|---|

|
#21
Poplar Ave
Absecon, NJ 08205
|
2,212 sq. feet
|
2 baths 4 beds |
show details | |

|
#22
W Katherine Ave
Ocean View, NJ 08230
|
1,422 sq. feet
|
1 baths 3 beds |
show details | |

|
#23
W Adams Ave
Pleasantville, NJ 08232
|
1,314 sq. feet
|
1 baths 3 beds |
show details | |

|
#24
W Rene Ave
Egg Harbor City, NJ 08215
|
1,088 sq. feet
|
1 baths 3 beds |
show details | |

|
#25
Route 50
Ocean View, NJ 08230
|
1,008 sq. feet
|
1 baths 3 beds |
show details | |

|
#26
N Delancy Pl
Atlantic City, NJ 08401
|
2,214 sq. feet
|
3 baths 4 beds |
show details | |

|
#27
Route Us 9 S
Ocean View, NJ 08230
|
2,112 sq. feet
|
3 baths 4 beds |
show details | |

|
#28
Country Ln
Absecon, NJ 08205
|
1,722 sq. feet
|
2 baths 3 beds |
show details | |

|
#29
Chicago Ave
Egg Harbor City, NJ 08215
|
1,185 sq. feet
|
2 baths 3 beds |
show details | |

|
#30
Ocean Ave
Mays Landing, NJ 08330
|
1,620 sq. feet
|
2 baths 3 beds |
show details |
| Photo | Address | Area | Beds / Baths | Price | Details |
|---|---|---|---|---|---|

|
#31
Washington Ave
Egg Harbor City, NJ 08215
|
1,807 sq. feet
|
2 baths 4 beds |
show details | |

|
#32
Brown Ave
Egg Harbor Township, NJ 08234
|
- sq. feet
|
- baths - beds |
$67,900
|
show details |

|
#33
Drexel Ave
Atlantic City, NJ 08401
|
- sq. feet
|
- baths - beds |
$6,900
|
show details |

|
#34
N 4th St
Pleasantville, NJ 08232
|
1,128 sq. feet
|
1 baths 2 beds |
show details | |

|
#35
Blake Dr
Mays Landing, NJ 08330
|
1,152 sq. feet
|
2 baths 2 beds |
show details | |

|
#36
Imperial Dr
Egg Harbor Township, NJ 08234
|
3,020 sq. feet
|
3 baths 5 beds |
show details | |

|
#37
Fairwa 1625
Absecon, NJ 08205
|
1,173 sq. feet
|
- baths - beds |
show details | |

|
#38
Federal Ct
Absecon, NJ 08205
|
- sq. feet
|
2 baths 2 beds |
show details | |

|
#39
Ocean Heights Ave
Mays Landing, NJ 08330
|
- sq. feet
|
2 baths 4 beds |
show details | |

|
#40
Putting Green Ave
Northfield, NJ 08225
|
1,152 sq. feet
|
- baths - beds |
show details |
| Photo | Address | Area | Beds / Baths | Price | Details |
|---|---|---|---|---|---|

|
#41
Grant Ave
Woodbine, NJ 08270
|
1,034 sq. feet
|
- baths - beds |
show details | |

|
#42
Woodland Ave
Pleasantville, NJ 08232
|
1,434 sq. feet
|
- baths - beds |
show details | |

|
#43
Harley Ave
Mays Landing, NJ 08330
|
1,104 sq. feet
|
- baths - beds |
show details | |

|
#44
Adriatic Ave
Atlantic City, NJ 08401
|
1,544 sq. feet
|
1 baths - beds |
show details | |

|
#45
Grand Ave
Mays Landing, NJ 08330
|
2,728 sq. feet
|
- baths - beds |
show details | |

|
#46
Boxwood Pl
Mays Landing, NJ 08330
|
992 sq. feet
|
- baths - beds |
show details | |

|
#47
Martin L King Ave
Egg Harbor Township, NJ 08234
|
1,008 sq. feet
|
- baths - beds |
show details | |

|
#48
S New Rd
Pleasantville, NJ 08232
|
496 sq. feet
|
- baths - beds |
show details | |

|
#49
Boston Ave
Egg Harbor City, NJ 08215
|
1,648 sq. feet
|
- baths - beds |
show details | |

|
Check over 1 million property listings on Foreclosure.com!
|
browse all offers | |||


 | Greate Bay townhomes/condos (Somers Point) (1 reply) |
| Will Affordable housing requirement destroy NJ Real Estate? (127 replies) |
| Is it good time to buy a house in south jersey? (18 replies) |
| Apartment Homes not far from A.C. (3 replies) |
| Bruce Springsteen busted for DWI at Jersey Shore, official says (278 replies) |
| Panhandler at Short Hills Mall (44 replies) |
Median year apartment built: 1973
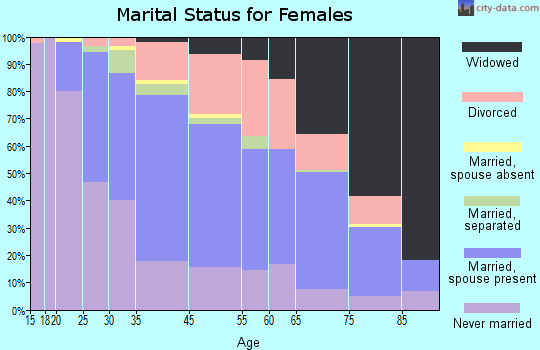
Household type by relationship:
Households: 10,531- Male householders: 2,100 (565 living alone), Female householders: 2,571 (1,031 living alone)
1,887 spouses (1,887 opposite-sex spouses), 291 unmarried partners, (259 opposite-sex unmarried partners), 2,853 children (2,671 natural, 33 adopted, 148 stepchildren), 243 grandchildren, 92 brothers or sisters, 41 parents, 0 foster children, 108 other relatives, 326 non-relatives
- In group quarters: 15
Size of family households: 1,273 2-persons, 700 3-persons, 447 4-persons, 181 5-persons, 28 6-persons, 49 7-or-more-persons.
Size of nonfamily households: 1,548 1-person, 352 2-persons, 57 3-persons.
1,474 married couples with children.
516 single-parent households (22 men, 494 women).
85.8% of residents of Somers Point speak English at home.
8.2% of residents speak Spanish at home (60% speak English very well, 17% speak English well, 14% speak English not well, 8% don't speak English at all).
2.1% of residents speak other Indo-European language at home (82% speak English very well, 12% speak English well, 6% speak English not well).
4.8% of residents speak Asian or Pacific Island language at home (58% speak English very well, 7% speak English well, 25% speak English not well, 9% don't speak English at all).
Foreign born population: 1,204 (11.4%)
(45.8% of them are naturalized citizens)
| Here: | 6.4 |
| State: | 6.8 |
| Here: | 4.1 |
| State: | 3.9 |
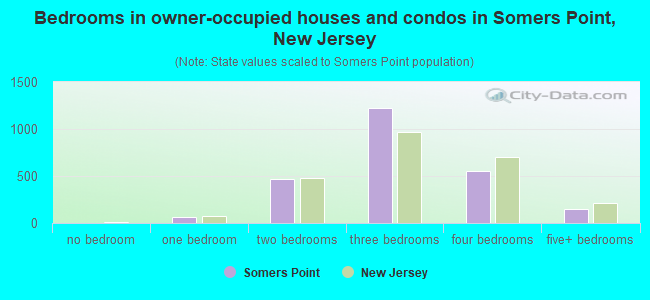
- Bedrooms in owner-occupied houses and condos in Somers Point, New Jersey
- 0no bedroom
- 591 bedroom
- 4702 bedrooms
- 1,2283 bedrooms
- 5544 bedrooms
- 1455+ bedrooms
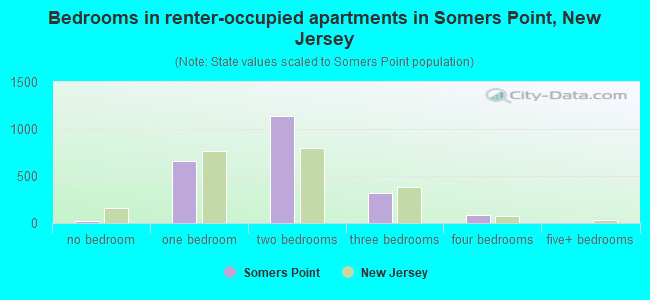
- Bedrooms in renter-occupied apartments in Somers Point, New Jersey
- 16no bedroom
- 6551 bedroom
- 1,1362 bedrooms
- 3143 bedrooms
- 874 bedrooms
- 05+ bedrooms
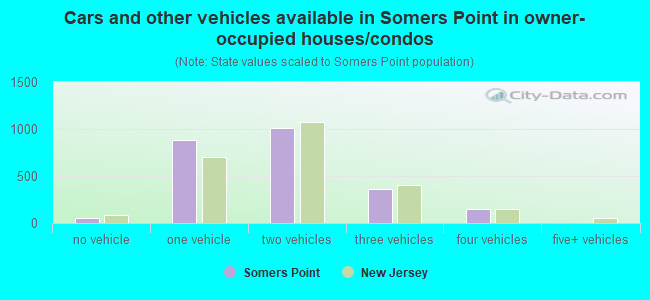
- Cars and other vehicles available in Somers Point in owner-occupied houses/condos
- 52no vehicle
- 8781 vehicle
- 1,0112 vehicles
- 3643 vehicles
- 1514 vehicles
- 05+ vehicles
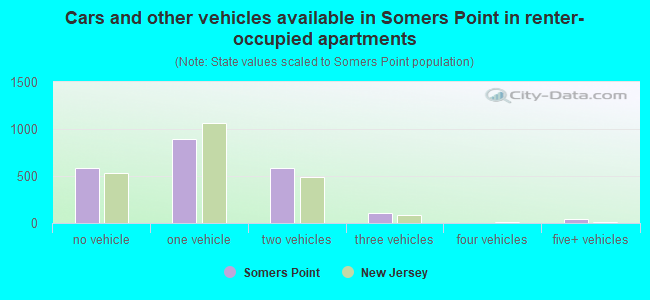
- Cars and other vehicles available in Somers Point in renter-occupied apartments
- 582no vehicle
- 8921 vehicle
- 5862 vehicles
- 1063 vehicles
- 04 vehicles
- 425+ vehicles
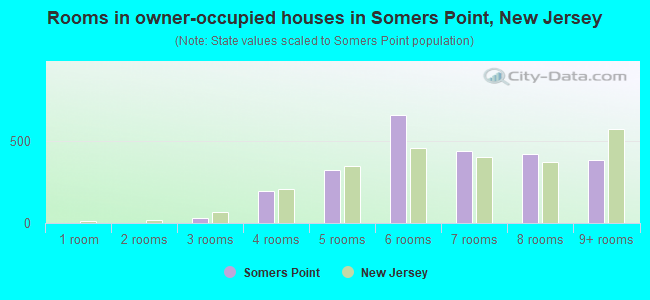
- Rooms in owner-occupied houses in Somers Point, New Jersey
- 01 room
- 12 rooms
- 333 rooms
- 1964 rooms
- 3245 rooms
- 6606 rooms
- 4377 rooms
- 4218 rooms
- 3849+ rooms
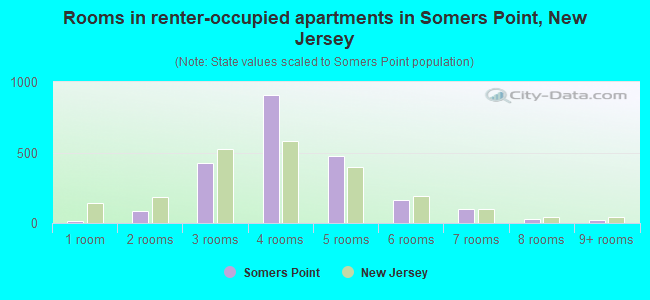
- Rooms in renter-occupied apartments in Somers Point, New Jersey
- 161 room
- 822 rooms
- 4223 rooms
- 9114 rooms
- 4755 rooms
- 1606 rooms
- 967 rooms
- 258 rooms
- 199+ rooms
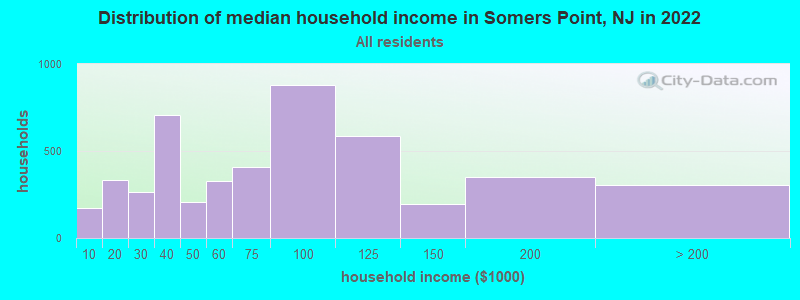
Somers Point, NJ household income distribution

- 175Less than $10,000
- 332$10,000 to $19,999
- 265$20,000 to $29,999
- 709$30,000 to $39,999
- 209$40,000 to $49,999
- 329$50,000 to $59,999
- 409$60,000 to $74,999
- 882$75,000 to $99,999
- 587$100,000 to $124,999
- 196$125,000 to $149,999
- 352$150,000 to $199,999
- 303$200,000 or more
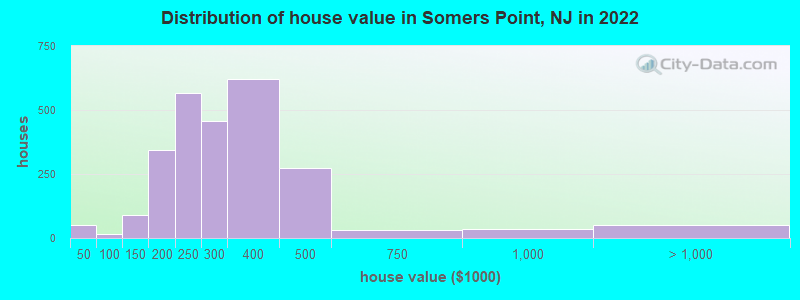
Home value of owner - occupied houses in 2022 in Somers Point, NJ
-
- 14Less than $10,000
- 10$15,000 to $19,999
- 4$20,000 to $24,999
- 18$25,000 to $29,999
- 16$60,000 to $69,999
- 5$100,000 to $124,999
- 82$125,000 to $149,999
- 181$150,000 to $174,999
- 160$175,000 to $199,999
- 567$200,000 to $249,999
- 456$250,000 to $299,999
- 623$300,000 to $399,999
- 274$400,000 to $499,999
- 30$500,000 to $749,999
- 35$750,000 to $999,999
- 16$1,000,000 to $1,499,999
- 16$1,500,000 to $1,999,999
- 15$2,000,000 or more
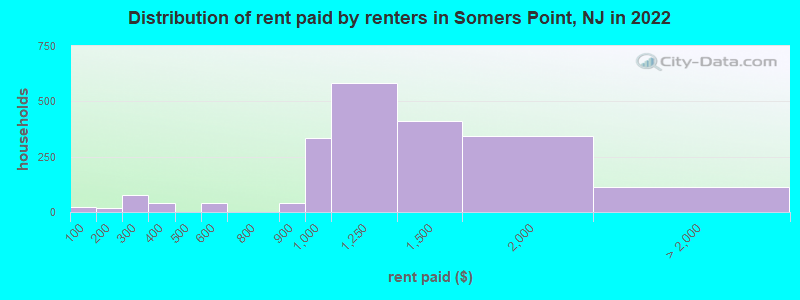
Rent paid by renters in 2022 in Somers Point, NJ
-
- 22Less than $100
- 18$100 to $149
- 21$200 to $249
- 53$250 to $299
- 3$300 to $349
- 34$350 to $399
- 41$500 to $549
- 42$800 to $899
- 333$900 to $999
- 580$1,000 to $1,249
- 412$1,250 to $1,499
- 342$1,500 to $1,999
- 16$2,000 to $2,499
- 14$2,500 to $2,999
- 79No cash rent
Percentage of workers working in this county: 75.3%
Number of people working at home: 416 (7.9% of all workers)
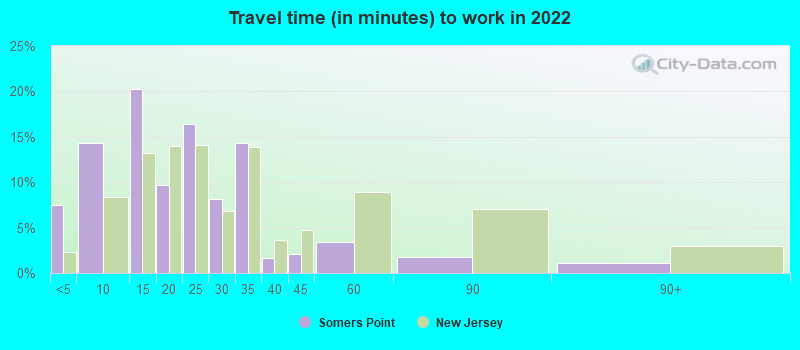
Travel time to work (commute)
- Less than 5 minutes: 249
- 5 to 9 minutes: 664
- 10 to 14 minutes: 692
- 15 to 19 minutes: 570
- 20 to 24 minutes: 891
- 25 to 29 minutes: 523
- 30 to 34 minutes: 584
- 35 to 39 minutes: 61
- 40 to 44 minutes: 110
- 45 to 59 minutes: 133
- 60 to 89 minutes: 168
- 90 or more minutes: 144
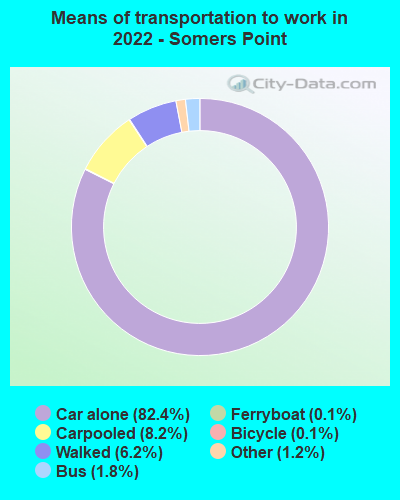
Means of transportation to work:
- Drove a car alone: 4,372 (74.0%)
- Carpooled: 495 (8.4%)
- Bus: 84 (1.4%)
- Ferryboat: 6 (0.1%)
- Taxi: 72 (1.2%)
- Bicycle: 7 (0.1%)
- Walked: 365 (6.2%)
- Worked at home: 416 (7.0%)
- Unemployment by race in 2022
- Unemployment rate for White non-Hispanic residents
- 8.5%Males
- 4.6%Females
- Unemployment rate for Black residents
- 9.1%Males
- 5.2%Females
- Unemployment rate for Asian residents
- 16.6%Males
- Unemployment rate for other race residents
- 27.5%Females
- Unemployment rate for two or more race residents
- 0.3%Males
- 16.9%Females
- Unemployment rate for Hispanic or Latino residents
- 26.6%Females
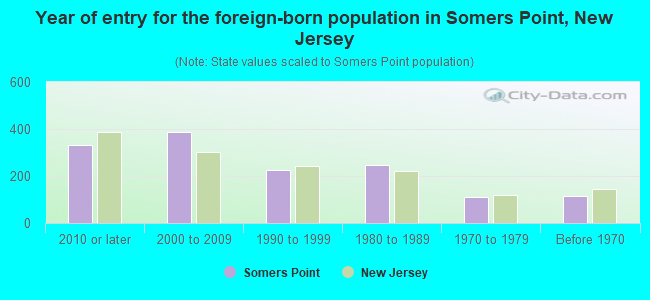
- Year of entry for the foreign-born population in Somers Point, New Jersey
- 3312010 or later
- 3882000 to 2009
- 2261990 to 1999
- 2461980 to 1989
- 1091970 to 1979
- 117Before 1970
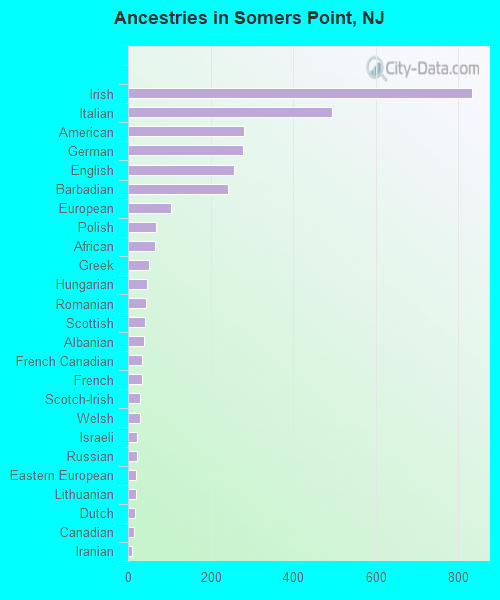
First ancestries reported:
- Irish: 833 (16.0%)
- Italian: 495 (9.5%)
- American: 282 (5.4%)
- German: 279 (5.4%)
- English: 257 (4.9%)
- Barbadian: 242 (4.7%)
- European: 104 (2.0%)
- Polish: 68 (1.3%)
- African: 65 (1.2%)
- Greek: 50 (1.0%)
- Hungarian: 46 (0.9%)
- Romanian: 44 (0.8%)
- Scottish: 41 (0.8%)
- Albanian: 39 (0.7%)
- French Canadian: 34 (0.7%)
- French: 33 (0.6%)
- Scotch-Irish: 29 (0.6%)
- Welsh: 28 (0.5%)
- Israeli: 23 (0.4%)
- Russian: 23 (0.4%)
- Eastern European: 20 (0.4%)
- Lithuanian: 19 (0.4%)
- Dutch: 17 (0.3%)
- Canadian: 14 (0.3%)
- Iranian: 10 (0.2%)
- Moroccan: 9 (0.2%)
- Australian: 6 (0.1%)
- Latvian: 6 (0.1%)
Most common places of birth for foreign-born residents (%):
| Somers Point: | 30.5% (404) |
| New Jersey: | 4.8% (102,527) |
| Somers Point: | 15.5% (205) |
| New Jersey: | 0.1% (2,650) |
| Somers Point: | 12.0% (159) |
| New Jersey: | 3.7% (78,969) |
| Somers Point: | 8.7% (115) |
| New Jersey: | 4.0% (85,934) |
| Somers Point: | 5.9% (78) |
| New Jersey: | 0.8% (17,949) |
| Somers Point: | 4.9% (65) |
| New Jersey: | 2.7% (58,563) |
| Somers Point: | 2.9% (39) |
| New Jersey: | 0.3% (6,130) |
| Somers Point: | 2.7% (36) |
| New Jersey: | 0.5% (10,975) |
| Somers Point: | 2.3% (30) |
| New Jersey: | 0.3% (6,033) |
| Somers Point: | 2.3% (30) |
| New Jersey: | 0.3% (7,501) |
| Somers Point: | 2.3% (30) |
| New Jersey: | 4.2% (90,817) |
| Somers Point: | 1.5% (20) |
| New Jersey: | 0.1% (2,004) |
Place of birth for U.S.-born residents:
- This state: 6,367
- Other state: 2,940
- Northeast: 2,324
- Midwest: 110
- South: 275
- West: 153
92.4% of Somers Point residents lived in the same house 1 years ago.
Out of people who lived in different houses, 39.6% lived in this county.
Out of people who lived in different counties, 79.1% lived in New Jersey.
| Somers Point: | 92.4% |
| State average: | 90.4% |
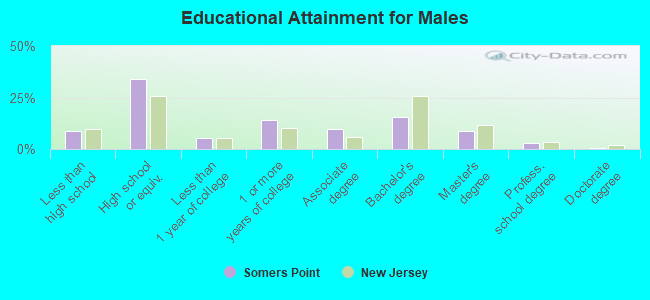
Education attainment for males 25 years and older:
- No schooling: 55
- Nursery to 4th grade: 0
- 5th and 6th grade: 0
- 7th and 8th grade: 5
- 9th grade: 9
- 10th grade: 15
- 11th grade: 47
- 12th grade, no diploma: 168
- High school graduate (or equivalency): 1,191
- Less than 1 year of college: 192
- Some college more than 1 year, no degree: 501
- Associate degree: 346
- Bachelor's degree: 554
- Master's degree: 315
- Professional school degree: 103
- Doctorate degree: 15
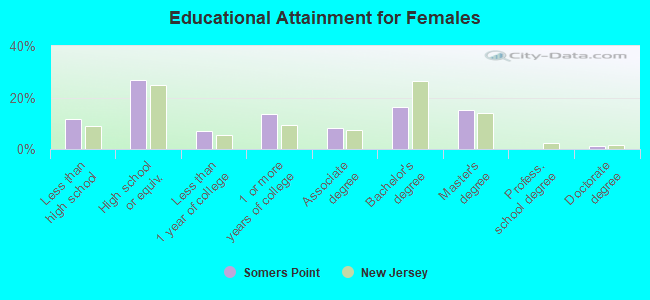
Education attainment for females 25 years and older:
- No schooling: 105
- Nursery to 4th grade: 42
- 5th and 6th grade: 58
- 7th and 8th grade: 30
- 9th grade: 25
- 10th grade: 46
- 11th grade: 67
- 12th grade, no diploma: 114
- High school graduate (or equivalency): 1,100
- Less than 1 year of college: 291
- Some college more than 1 year, no degree: 555
- Associate degree: 342
- Bachelor's degree: 665
- Master's degree: 619
- Professional school degree: 0
- Doctorate degree: 55
Housing units in structures:
- One, detached: 3,145
- One, attached: 282
- Two: 290
- 3 or 4: 237
- 5 to 9: 364
- 10 to 19: 869
- 20 to 49: 272
- 50 or more: 247
- Mobile homes: 5
Housing units lacking complete kitchen facilities in 2022: 1.1%
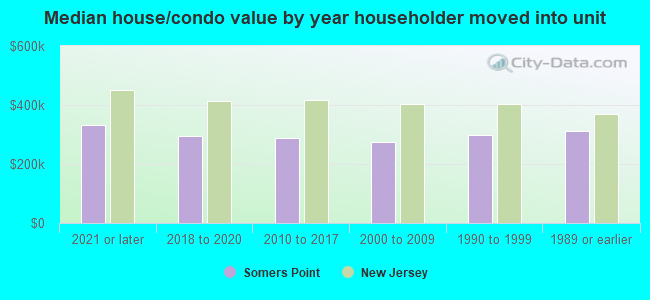
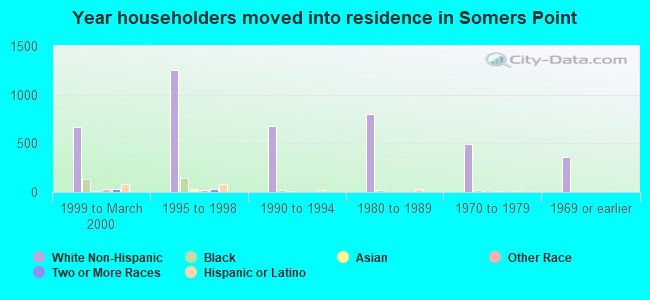
House/condo owner moved in on average 14 years ago
Renter moved in on average 4 years ago
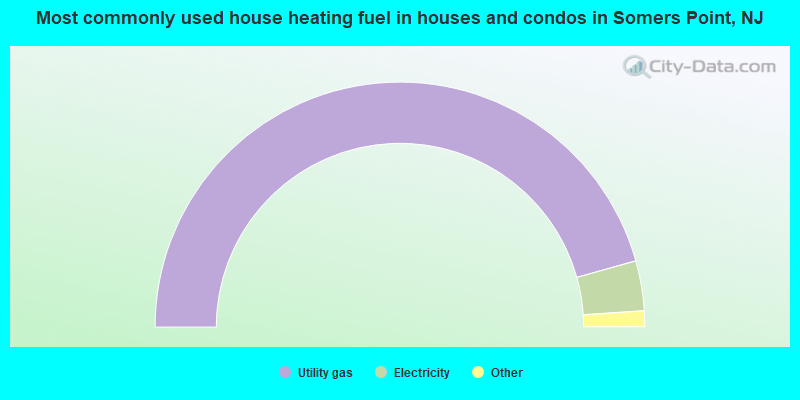
- 91.4%Utility gas
- 6.6%Electricity
- 0.8%Fuel oil, kerosene, etc.
- 0.8%Bottled, tank, or LP gas
- 0.4%Solar energy
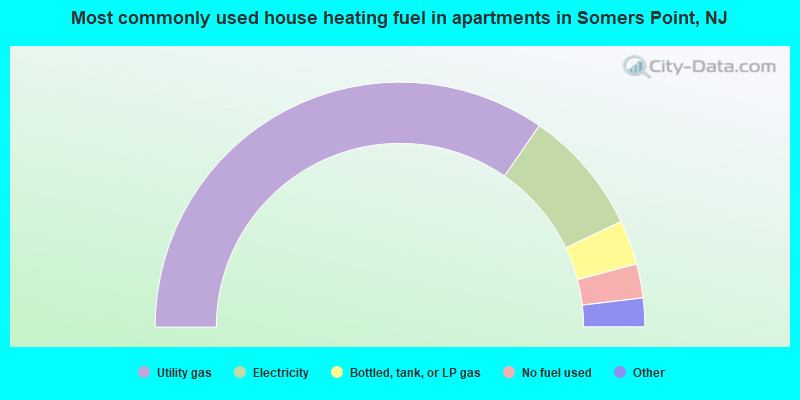
- 69.5%Utility gas
- 16.6%Electricity
- 5.9%Bottled, tank, or LP gas
- 4.5%No fuel used
- 2.5%Other fuel
- 1.1%Fuel oil, kerosene, etc.
Private vs. public school enrollment:
| Here: | 1.4% |
| New Jersey: | 12.3% |
| Here: | 2.7% |
| New Jersey: | 13.1% |
| Here: | 29.3% |
| New Jersey: | 33.2% |