Somerville, MA (Massachusetts) Houses and Residents
| Somerville: | $933,800 |
| Massachusetts: | $534,700 |
Mean price in 2022:
Detached houses: $1,142,268
Here: $1,142,268 State: $651,570 Townhouses or other attached units: $1,092,002
Here: $1,092,002 State: $617,749 In 2-unit structures: $934,300
Here: $934,300 State: $594,808 In 3-to-4-unit structures: $873,181
Here: $873,181 State: $601,912 In 5-or-more-unit structures: $833,225
Here: $833,225 State: $555,768
Total population: 78,901 (Urban population: 77,478, Rural population: 0)
Houses: 37,836 (36,001 occupied: 11,194 owner occupied, 24,807 renter occupied)
| % of renters here: | 69% |
| State: | 38% |
Housing density: 9,214 houses/condos per square mile
Median price asked for vacant for-sale houses and condos in 2022: $749,965.
Median contract rent in 2022: over $2,000 (lower quartile is $1,569, upper quartile is over $2,000)
Median rent asked for vacant for-rent units in 2022: $4,403
Median gross rent in Somerville, MA in 2022: over $2,000
Housing units in Somerville with a mortgage: 8,148 (1,112 second mortgage, 93 home equity loan, 1,019 both second mortgage and home equity loan)
Houses without a mortgage: 131
Median household income for houses/condos with a mortgage: $215,000
Median household income for apartments without a mortgage: $91,472
Median monthly housing costs: $2,336
Compare current foreclosures near Somerville, MA:
| Photo | Address | Area | Beds / Baths | Price | Details |
|---|---|---|---|---|---|

|
#1
Pearson Ave
Somerville, MA 02144
|
3,104 sq. feet
|
3 baths 4 beds |
show details | |

|
#2
Heath St # 1
Somerville, MA 02145
|
1,466 sq. feet
|
2 baths 3 beds |
show details | |

|
#3
Powder House Blvd
Somerville, MA 02144
|
3,046 sq. feet
|
2 baths 6 beds |
show details | |

|
#4
Flint St
Somerville, MA 02145
|
2,534 sq. feet
|
2 baths 6 beds |
show details | |

|
#5
Everett Ave
Somerville, MA 02145
|
2,246 sq. feet
|
2 baths 5 beds |
show details | |

|
#6
Otis St
Somerville, MA 02145
|
1,370 sq. feet
|
2 baths 4 beds |
show details | |

|
#7
Bow Street Pl
Somerville, MA 02143
|
1,140 sq. feet
|
1 baths 3 beds |
show details | |

|
#8
Wesley Park # 2
Somerville, MA 02143
|
2,302 sq. feet
|
2 baths 4 beds |
show details | |

|
#9
Ten Hills Rd
Somerville, MA 02145
|
3,519 sq. feet
|
2 baths 6 beds |
show details | |

|
#10
Lincoln St
Somerville, MA 02145
|
1,955 sq. feet
|
2 baths 4 beds |
show details |
| Photo | Address | Area | Beds / Baths | Price | Details |
|---|---|---|---|---|---|

|
#11
Elm St
Somerville, MA 02143
|
2,070 sq. feet
|
3 baths 5 beds |
show details | |

|
#12
Houghton St
Somerville, MA 02143
|
- sq. feet
|
- baths - beds |
show details | |

|
#13
Canal St # 715
Somerville, MA 02145
|
- sq. feet
|
- baths - beds |
show details | |

|
#14
Connecticut Ave
Somerville, MA 02145
|
- sq. feet
|
- baths - beds |
show details | |

|
#15
Willow Ave
Somerville, MA 02144
|
- sq. feet
|
- baths - beds |
show details | |

|
#16
Grand View Ave, No 2
Somerville, MA 02143
|
- sq. feet
|
- baths - beds |
show details | |

|
#17
Thurston St
Somerville, MA 02145
|
- sq. feet
|
- baths - beds |
show details | |

|
#18
Putnam Rd
Somerville, MA 02145
|
- sq. feet
|
- baths - beds |
show details | |

|
#19
Tall Oaks Dr Unit 508
South Weymouth, MA 02190
|
1,300 sq. feet
|
2 baths 2 beds |
$285,000
|
show details |

|
#20
Stillman St
Framingham, MA 01702
|
1,122 sq. feet
|
1 baths 2 beds |
$418,000
|
show details |
| Photo | Address | Area | Beds / Baths | Price | Details |
|---|---|---|---|---|---|

|
#21
Boyd St
Boston, MA 02124
|
3,970 sq. feet
|
3 baths 9 beds |
$650,000
|
show details |

|
#22
Johnson Rd
North Weymouth, MA 02191
|
748 sq. feet
|
1 baths 2 beds |
$365,000
|
show details |

|
#23
Stevens Ave
Middleton, MA 01949
|
1,396 sq. feet
|
2 baths 3 beds |
$535,600
|
show details |

|
#24
Church St
Boston, MA 02122
|
3,663 sq. feet
|
3 baths 6 beds |
show details | |

|
#25
Bittersweet Ln
Randolph, MA 02368
|
882 sq. feet
|
1 baths 2 beds |
show details | |

|
#26
Kendrick Ave Apt 307
Quincy, MA 02169
|
1,234 sq. feet
|
2 baths 2 beds |
show details | |

|
#27
Brahms St
Roslindale, MA 02131
|
1,604 sq. feet
|
1 baths 4 beds |
show details | |

|
#28
Bainbridge St
Malden, MA 02148
|
1,600 sq. feet
|
1 baths 3 beds |
show details | |

|
#29
Bower St
Medford, MA 02155
|
2,323 sq. feet
|
2 baths 4 beds |
show details | |

|
#30
Margin Street
Lynn, MA 01905
|
1,240 sq. feet
|
2 baths 2 beds |
show details |
| Photo | Address | Area | Beds / Baths | Price | Details |
|---|---|---|---|---|---|

|
#31
Condor St # 2
Boston, MA 02128
|
3,024 sq. feet
|
1 baths 3 beds |
show details | |

|
#32
Salem Rd
Billerica, MA 01821
|
1,428 sq. feet
|
1 baths 4 beds |
show details | |

|
#33
Richmond St
Boston, MA 02124
|
2,516 sq. feet
|
2 baths 4 beds |
show details | |

|
#34
Thomas St
Jamaica Plain, MA 02130
|
1,990 sq. feet
|
2 baths 2 beds |
show details | |

|
#35
Webster St
Randolph, MA 02368
|
1,080 sq. feet
|
1 baths 3 beds |
show details | |

|
#36
Essex St
Swampscott, MA 01907
|
2,029 sq. feet
|
2 baths 3 beds |
show details | |

|
#37
Tobey Ln
Wakefield, MA 01880
|
3,240 sq. feet
|
2 baths 4 beds |
show details | |

|
#38
Congress Pl
Dedham, MA 02026
|
1,966 sq. feet
|
2 baths 4 beds |
show details | |

|
#39
Gilbert Rd
Needham, MA 02492
|
1,778 sq. feet
|
2 baths 3 beds |
show details | |

|
#40
Ridgehill Rd
Canton, MA 02021
|
1,196 sq. feet
|
1 baths 3 beds |
show details |
| Photo | Address | Area | Beds / Baths | Price | Details |
|---|---|---|---|---|---|

|
#41
Vernal St
Everett, MA 02149
|
2,601 sq. feet
|
2 baths 5 beds |
show details | |

|
#42
Fenwick St
Revere, MA 02151
|
2,080 sq. feet
|
1 baths 3 beds |
show details | |

|
#43
Cardington Ave
Billerica, MA 01821
|
1,573 sq. feet
|
2 baths 5 beds |
show details | |

|
#44
Savin Hill Avenue, Unit 2 190 Savin Hill Avenue Condominium
Boston, MA 02125
|
1,022 sq. feet
|
1 baths 2 beds |
show details | |

|
#45
Emily Jeffers Rd # L
Randolph, MA 02368
|
1,350 sq. feet
|
1 baths 3 beds |
show details | |

|
#46
Ballou St
Quincy, MA 02169
|
1,758 sq. feet
|
1 baths 3 beds |
show details | |

|
#47
Marcy Rd
Mattapan, MA 02126
|
1,168 sq. feet
|
1 baths 3 beds |
show details | |

|
#48
Crestway Rd
Boston, MA 02128
|
1,370 sq. feet
|
2 baths 4 beds |
show details | |

|
#49
Eastern Ave
Malden, MA 02148
|
2,288 sq. feet
|
3 baths 4 beds |
show details | |

|
Check over 1 million property listings on Foreclosure.com!
|
browse all offers | |||

Latest news about housing in Somerville, MA collected exclusively by city-data.com from local newspapers, TV, and radio stations


Median year apartment built: 1938
Household type by relationship:
Households: 79,761- Male householders: 17,769 (6,087 living alone), Female householders: 18,232 (6,237 living alone)
10,372 spouses (10,093 opposite-sex spouses), 6,373 unmarried partners, (5,891 opposite-sex unmarried partners), 10,463 children (10,289 natural, 130 adopted, 44 stepchildren), 260 grandchildren, 1,106 brothers or sisters, 752 parents, 0 foster children, 838 other relatives, 10,704 non-relatives
- In group quarters: 2,892
Size of family households: 4,895 2-persons, 4,111 3-persons, 2,600 4-persons, 707 5-persons, 212 6-persons, 35 7-or-more-persons.
Size of nonfamily households: 12,324 1-person, 7,536 2-persons, 2,134 3-persons, 713 4-persons, 614 5-persons, 82 6-persons, 38 7-or-more-persons.
5,618 married couples with children.
1,694 single-parent households (207 men, 1,487 women).
69.9% of residents of Somerville speak English at home.
8.7% of residents speak Spanish at home (58% speak English very well, 15% speak English well, 19% speak English not well, 9% don't speak English at all).
14.2% of residents speak other Indo-European language at home (61% speak English very well, 17% speak English well, 14% speak English not well, 8% don't speak English at all).
4.8% of residents speak Asian or Pacific Island language at home (74% speak English very well, 13% speak English well, 11% speak English not well, 2% don't speak English at all).
1.4% of residents speak other language at home (72% speak English very well, 19% speak English well, 10% speak English not well).
Foreign born population: 16,403 (20.6%)
(38.8% of them are naturalized citizens)
| Here: | 5.9 |
| State: | 6.5 |
| Here: | 4.1 |
| State: | 4.0 |

- Bedrooms in owner-occupied houses and condos in Somerville, Massachusetts
- 0no bedroom
- 8131 bedroom
- 4,3272 bedrooms
- 3,3193 bedrooms
- 2,0624 bedrooms
- 6735+ bedrooms

- Bedrooms in renter-occupied apartments in Somerville, Massachusetts
- 1,195no bedroom
- 8,1011 bedroom
- 8,8622 bedrooms
- 4,8223 bedrooms
- 1,1434 bedrooms
- 6845+ bedrooms

- Cars and other vehicles available in Somerville in owner-occupied houses/condos
- 1,181no vehicle
- 5,9901 vehicle
- 3,0372 vehicles
- 8103 vehicles
- 1764 vehicles
- 05+ vehicles

- Cars and other vehicles available in Somerville in renter-occupied apartments
- 5,328no vehicle
- 12,5771 vehicle
- 5,3302 vehicles
- 1,1433 vehicles
- 3314 vehicles
- 985+ vehicles

- Rooms in owner-occupied houses in Somerville, Massachusetts
- 01 room
- 1122 rooms
- 7513 rooms
- 1,6014 rooms
- 2,1765 rooms
- 2,2016 rooms
- 1,8217 rooms
- 9588 rooms
- 1,5749+ rooms

- Rooms in renter-occupied apartments in Somerville, Massachusetts
- 7861 room
- 2,2352 rooms
- 6,0413 rooms
- 5,7994 rooms
- 4,8225 rooms
- 2,7336 rooms
- 1,3447 rooms
- 6248 rooms
- 4239+ rooms


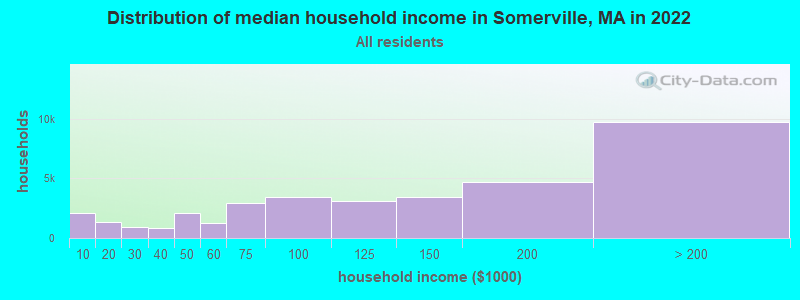
Somerville, MA household income distribution

- 2,080Less than $10,000
- 1,347$10,000 to $19,999
- 933$20,000 to $29,999
- 874$30,000 to $39,999
- 2,076$40,000 to $49,999
- 1,285$50,000 to $59,999
- 2,971$60,000 to $74,999
- 3,434$75,000 to $99,999
- 3,139$100,000 to $124,999
- 3,456$125,000 to $149,999
- 4,688$150,000 to $199,999
- 9,718$200,000 or more
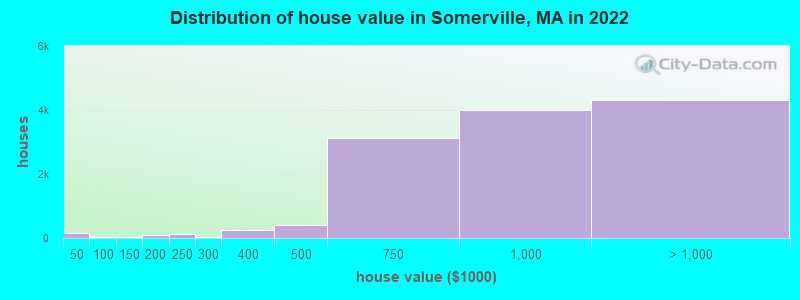
Home value of owner - occupied houses in 2022 in Somerville, MA
-
- 130Less than $10,000
- 23$10,000 to $14,999
- 13$15,000 to $19,999
- 12$50,000 to $59,999
- 33$90,000 to $99,999
- 39$100,000 to $124,999
- 25$150,000 to $174,999
- 59$175,000 to $199,999
- 138$200,000 to $249,999
- 42$250,000 to $299,999
- 244$300,000 to $399,999
- 410$400,000 to $499,999
- 3,140$500,000 to $749,999
- 4,014$750,000 to $999,999
- 2,949$1,000,000 to $1,499,999
- 864$1,500,000 to $1,999,999
- 505$2,000,000 or more
Rent paid by renters in 2022 in Somerville, MA
-
- 181Less than $100
- 167$100 to $149
- 189$150 to $199
- 390$200 to $249
- 325$250 to $299
- 140$300 to $349
- 307$400 to $449
- 119$450 to $499
- 103$550 to $599
- 99$600 to $649
- 47$700 to $749
- 377$800 to $899
- 606$900 to $999
- 1,056$1,000 to $1,249
- 1,142$1,250 to $1,499
- 6,344$1,500 to $1,999
- 5,233$2,000 to $2,499
- 3,417$2,500 to $2,999
- 1,826$3,000 to $3,499
- 2,414$3,500 or more
- 325No cash rent

Percentage of workers working in this county: 74.2%
Number of people working at home: 18,072 (32.7% of all workers)
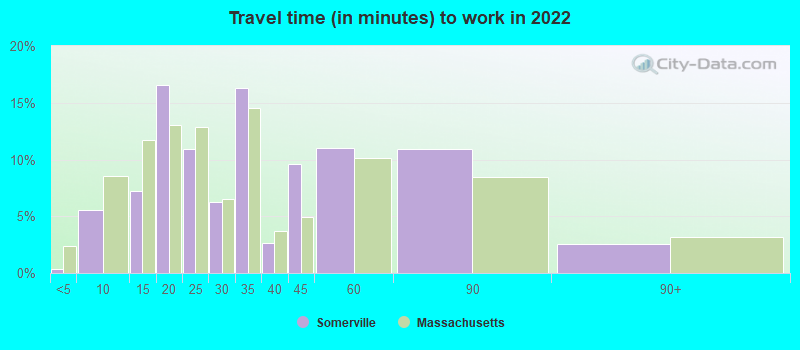
Travel time to work (commute)
- Less than 5 minutes: 210
- 5 to 9 minutes: 1,447
- 10 to 14 minutes: 2,096
- 15 to 19 minutes: 5,426
- 20 to 24 minutes: 5,093
- 25 to 29 minutes: 3,504
- 30 to 34 minutes: 7,162
- 35 to 39 minutes: 2,056
- 40 to 44 minutes: 3,197
- 45 to 59 minutes: 3,995
- 60 to 89 minutes: 2,985
- 90 or more minutes: 52
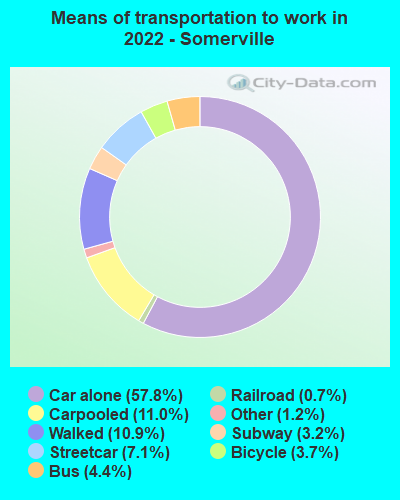
Means of transportation to work:
- Drove a car alone: 11,782 (30.6%)
- Carpooled: 2,247 (5.8%)
- Bus: 900 (2.3%)
- Subway or elevated rail: 1,451 (3.8%)
- Long-distance train or commuter rail: 647 (1.7%)
- Light rail, streetcar or trolley: 152 (0.4%)
- Taxi: 235 (0.6%)
- Bicycle: 747 (1.9%)
- Walked: 2,228 (5.8%)
- Worked at home: 18,072 (47.0%)
- Unemployment by race in 2022
- Unemployment rate for White non-Hispanic residents
- 2.1%Males
- 2.1%Females
- Unemployment rate for Black residents
- 1.3%Males
- 2.5%Females
- Unemployment rate for Asian residents
- 0.9%Males
- 0.9%Females
- Unemployment rate for other race residents
- 2.6%Males
- 4.2%Females
- Unemployment rate for two or more race residents
- 2.2%Males
- 1.5%Females
- Unemployment rate for Hispanic or Latino residents
- 3.2%Males
- 1.4%Females

- Year of entry for the foreign-born population in Somerville, Massachusetts
- 8,0002010 or later
- 4,5482000 to 2009
- 2,5011990 to 1999
- 5,7941980 to 1989
- 3,0031970 to 1979
- 2,696Before 1970

First ancestries reported:
- Irish: 3,652 (9.8%)
- Italian: 3,070 (8.2%)
- Brazilian: 1,984 (5.3%)
- Portuguese: 1,882 (5.1%)
- English: 1,171 (3.1%)
- German: 968 (2.6%)
- European: 908 (2.4%)
- American: 813 (2.2%)
- Haitian: 645 (1.7%)
- Dutch: 452 (1.2%)
- Polish: 442 (1.2%)
- Eastern European: 407 (1.1%)
- Bulgarian: 325 (0.9%)
- French Canadian: 325 (0.9%)
- Greek: 230 (0.6%)
- Jamaican: 206 (0.6%)
- Canadian: 205 (0.6%)
- Russian: 205 (0.6%)
- Ukrainian: 179 (0.5%)
- African: 172 (0.5%)
- Turkish: 162 (0.4%)
- Lebanese: 159 (0.4%)
- French: 154 (0.4%)
- Moroccan: 143 (0.4%)
- Albanian: 135 (0.4%)
- Armenian: 135 (0.4%)
- Scottish: 125 (0.3%)
- Egyptian: 120 (0.3%)
- British: 116 (0.3%)
- Hungarian: 102 (0.3%)
- Cape Verdean: 102 (0.3%)
- Swedish: 101 (0.3%)
- Northern European: 95 (0.3%)
- Australian: 91 (0.2%)
- Ghanaian: 90 (0.2%)
- Latvian: 80 (0.2%)
- Ethiopian: 74 (0.2%)
- Finnish: 74 (0.2%)
- Romanian: 74 (0.2%)
- Norwegian: 64 (0.2%)
- Scotch-Irish: 63 (0.2%)
- Iranian: 61 (0.2%)
- Swiss: 53 (0.1%)
- Cypriot: 49 (0.1%)
- Nigerian: 49 (0.1%)
- Slovak: 34 (0.09%)
- Welsh: 32 (0.09%)
- Yugoslavian: 32 (0.09%)
- Lithuanian: 27 (0.07%)
- Carpatho Rusyn: 26 (0.07%)
- British West Indian: 25 (0.07%)
- Alsatian: 23 (0.06%)
- Kenyan: 20 (0.05%)
- Syrian: 19 (0.05%)
- Senegalese: 18 (0.05%)
- Belgian: 17 (0.05%)
- Czech: 16 (0.04%)
- Czechoslovakian: 15 (0.04%)
- Austrian: 13 (0.03%)
- Scandinavian: 12 (0.03%)
- West Indian: 12 (0.03%)
- Celtic: 11 (0.03%)
- Palestinian: 9 (0.02%)
- Iraqi: 6 (0.02%)
- Serbian: 6 (0.02%)
- Arab: 3 (0.01%)
- Barbadian: 3 (0.01%)
- Somali: 2 (0.01%)
Most common places of birth for foreign-born residents (%):
| Somerville: | 13.7% (2,694) |
| Massachusetts: | 7.6% (92,959) |
| Somerville: | 9.7% (1,913) |
| Massachusetts: | 3.7% (45,667) |
| Somerville: | 6.7% (1,310) |
| Massachusetts: | 8.4% (103,233) |
| Somerville: | 6.5% (1,283) |
| Massachusetts: | 6.8% (82,934) |
| Somerville: | 6.5% (1,277) |
| Massachusetts: | 4.1% (50,360) |
| Somerville: | 4.5% (878) |
| Massachusetts: | 2.3% (28,158) |
| Somerville: | 3.1% (616) |
| Massachusetts: | 8.3% (101,767) |
| Somerville: | 2.9% (570) |
| Massachusetts: | 0.6% (6,789) |
| Somerville: | 2.8% (556) |
| Massachusetts: | 1.4% (17,613) |
| Somerville: | 2.6% (518) |
| Massachusetts: | 4.9% (60,432) |
| Somerville: | 2.0% (395) |
| Massachusetts: | 2.7% (32,733) |
| Somerville: | 1.6% (319) |
| Massachusetts: | 1.4% (16,886) |
| Somerville: | 1.6% (318) |
| Massachusetts: | 0.2% (2,231) |
Place of birth for U.S.-born residents:
- This state: 31,600
- Other state: 29,972
- Northeast: 14,359
- Midwest: 5,215
- South: 5,121
- West: 5,277
73.4% of Somerville residents lived in the same house 1 years ago.
Out of people who lived in different houses, 30.3% lived in this county.
Out of people who lived in different counties, 63.3% lived in Massachusetts.
| Somerville: | 73.4% |
| State average: | 87.7% |
Education attainment for males 25 years and older:
- No schooling: 361
- Nursery to 4th grade: 0
- 5th and 6th grade: 0
- 7th and 8th grade: 64
- 9th grade: 184
- 10th grade: 12
- 11th grade: 293
- 12th grade, no diploma: 260
- High school graduate (or equivalency): 3,695
- Less than 1 year of college: 283
- Some college more than 1 year, no degree: 1,648
- Associate degree: 756
- Bachelor's degree: 11,917
- Master's degree: 5,584
- Professional school degree: 680
- Doctorate degree: 2,459

Education attainment for females 25 years and older:
- No schooling: 471
- Nursery to 4th grade: 273
- 5th and 6th grade: 115
- 7th and 8th grade: 0
- 9th grade: 69
- 10th grade: 252
- 11th grade: 101
- 12th grade, no diploma: 206
- High school graduate (or equivalency): 3,680
- Less than 1 year of college: 365
- Some college more than 1 year, no degree: 944
- Associate degree: 2,077
- Bachelor's degree: 11,373
- Master's degree: 7,679
- Professional school degree: 1,018
- Doctorate degree: 2,023


Housing units in structures:
- One, detached: 3,763
- One, attached: 1,974
- Two: 10,644
- 3 or 4: 10,028
- 5 to 9: 3,224
- 10 to 19: 1,994
- 20 to 49: 2,953
- 50 or more: 3,256
Housing units lacking complete kitchen facilities in 2022: 0.6%
House/condo owner moved in on average 10 years ago
Renter moved in on average 0 years ago

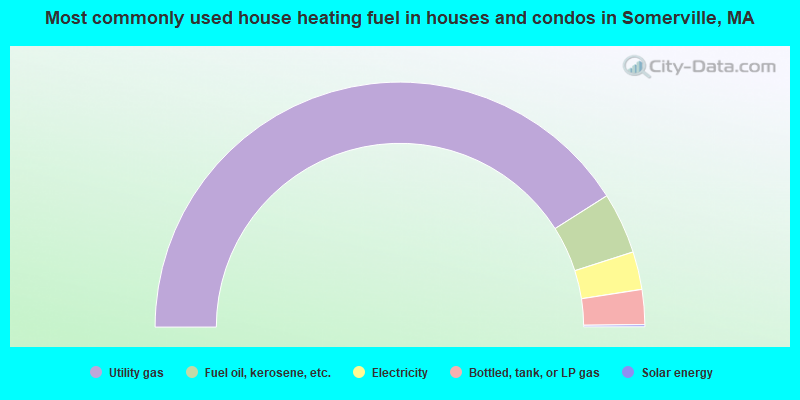
- 82.1%Utility gas
- 8.1%Fuel oil, kerosene, etc.
- 5.0%Electricity
- 4.6%Bottled, tank, or LP gas
- 0.3%Solar energy
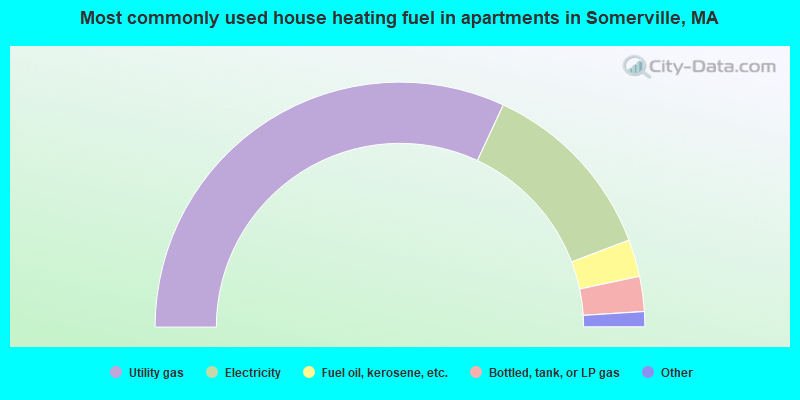
- 63.8%Utility gas
- 24.6%Electricity
- 4.9%Fuel oil, kerosene, etc.
- 4.6%Bottled, tank, or LP gas
- 1.2%Other fuel
- 0.5%No fuel used
- 0.2%Coal or coke
Private vs. public school enrollment:
| Here: | 7.2% |
| Massachusetts: | 10.3% |
| Here: | 11.1% |
| Massachusetts: | 12.3% |
| Here: | 68.8% |
| Massachusetts: | 51.2% |


