Sour Lake, TX (Texas) Houses and Residents
| Sour Lake: | $147,999 |
| Texas: | $275,400 |
Mean price in 2022:
Detached houses: $206,682
Here: $206,682 State: $369,058 Mobile homes: $135,108
Here: $135,108 State: $124,413
Total population: 1,783 (Urban population: 0, Rural population: 1,646 (all nonfarm))
Houses: 817 (719 occupied: 497 owner occupied, 232 renter occupied)
| % of renters here: | 32% |
| State: | 38% |
Housing density: 472 houses/condos per square mile
Median price asked for vacant for-sale houses and condos in 2022: $264,800.
Median contract rent in 2022: $749 (lower quartile is $562, upper quartile is $1,145)
Median rent asked for vacant for-rent units in 2022: $3,451
Median gross rent in Sour Lake, TX in 2022: $1,187
Housing units in Sour Lake with a mortgage: 195 (4 second mortgage, 0 home equity loan, 2 both second mortgage and home equity loan)
Houses without a mortgage: 0
Median household income for houses/condos with a mortgage: $102,467
Median household income for apartments without a mortgage: $55,752
Median monthly housing costs: $960
Compare current foreclosures near Sour Lake, TX:
| Photo | Address | Area | Beds / Baths | Price | Details |
|---|---|---|---|---|---|

|
#1
Pinewood Blvd
Sour Lake, TX 77659
|
2,704 sq. feet
|
2 baths 3 beds |
show details | |

|
#2
Tomlinson St
Sour Lake, TX 77659
|
2,152 sq. feet
|
2 baths 5 beds |
show details | |

|
#3
Holly Trails
Sour Lake, TX 77659
|
- sq. feet
|
2 baths 4 beds |
show details | |

|
#4
Pinemont Dr
Sour Lake, TX 77659
|
2,156 sq. feet
|
2 baths - beds |
show details | |

|
#5
Farmer Rd
Sour Lake, TX 77659
|
- sq. feet
|
- baths - beds |
show details | |

|
#6
S Merchant St
Sour Lake, TX 77659
|
- sq. feet
|
- baths - beds |
show details | |

|
#7
S Fannin St
Sour Lake, TX 77659
|
- sq. feet
|
- baths - beds |
show details | |

|
#8
Piney Point Dr
Sour Lake, TX 77659
|
- sq. feet
|
- baths - beds |
show details | |

|
#9
W Crosby St
Sour Lake, TX 77659
|
980 sq. feet
|
- baths - beds |
show details | |

|
#10
Gilbert St
Sour Lake, TX 77659
|
- sq. feet
|
- baths - beds |
show details |
| Photo | Address | Area | Beds / Baths | Price | Details |
|---|---|---|---|---|---|

|
#11
Leaning Oaks Dr
Beaumont, TX 77713
|
1,998 sq. feet
|
2 baths 3 beds |
$229,900
|
show details |

|
#12
Holly Trls
Sour Lake, TX 77659
|
- sq. feet
|
- baths - beds |
show details | |

|
#13
Shiloh Dr
Beaumont, TX 77706
|
1,883 sq. feet
|
2 baths 3 beds |
show details | |

|
#14
Chestnut Ln
Beaumont, TX 77713
|
1,772 sq. feet
|
2 baths 3 beds |
show details | |

|
#15
Lynn Dr
Lumberton, TX 77657
|
2,512 sq. feet
|
3 baths 5 beds |
show details | |

|
#16
Digmon Rd
Kountze, TX 77625
|
- sq. feet
|
2 baths 4 beds |
show details | |

|
#17
Hilda
Lumberton, TX 77657
|
2,580 sq. feet
|
2 baths - beds |
show details | |

|
#18
Blarney St
Beaumont, TX 77706
|
2,597 sq. feet
|
- baths - beds |
show details | |

|
#19
Berkshire Ln
Beaumont, TX 77707
|
1,155 sq. feet
|
- baths - beds |
show details | |

|
#20
Peck Rd
Lumberton, TX 77657
|
2,352 sq. feet
|
- baths - beds |
show details |
| Photo | Address | Area | Beds / Baths | Price | Details |
|---|---|---|---|---|---|

|
#21
Reagan St
Beaumont, TX 77706
|
1,848 sq. feet
|
- baths - beds |
show details | |

|
#22
Michelle Rd
Beaumont, TX 77713
|
4,177 sq. feet
|
- baths - beds |
show details | |

|
#23
Fm 421 Rd
Kountze, TX 77625
|
1,890 sq. feet
|
- baths - beds |
show details | |

|
#24
Stanford St
Beaumont, TX 77708
|
1,048 sq. feet
|
- baths - beds |
show details | |

|
#25
Acadia Ln
Beaumont, TX 77708
|
1,102 sq. feet
|
- baths - beds |
show details | |

|
#26
Cooks Lake Rd
Lumberton, TX 77657
|
- sq. feet
|
- baths - beds |
show details | |

|
#27
Saint Andrews Dr
Beaumont, TX 77707
|
2,313 sq. feet
|
- baths - beds |
show details | |

|
#28
Old Dowlen Rd Apt 538
Beaumont, TX 77706
|
- sq. feet
|
- baths - beds |
show details | |

|
#29
Crow Rd Apt 215
Beaumont, TX 77706
|
- sq. feet
|
- baths - beds |
show details | |

|
#30
Coolidge St
Beaumont, TX 77706
|
2,202 sq. feet
|
- baths - beds |
show details |
| Photo | Address | Area | Beds / Baths | Price | Details |
|---|---|---|---|---|---|

|
#31
Dellwood Ln
Beaumont, TX 77706
|
2,609 sq. feet
|
- baths - beds |
show details | |

|
#32
W Walton Rd
Lumberton, TX 77657
|
- sq. feet
|
- baths - beds |
show details | |

|
#33
Crow Rd Apt 7
Beaumont, TX 77706
|
- sq. feet
|
- baths - beds |
show details | |

|
#34
Torrey Pines Cir
Beaumont, TX 77707
|
2,013 sq. feet
|
- baths - beds |
show details | |

|
#35
Old Dowlen Rd Apt 218
Beaumont, TX 77706
|
- sq. feet
|
- baths - beds |
show details | |

|
#36
River Birch Dr
Lumberton, TX 77657
|
- sq. feet
|
- baths - beds |
show details | |

|
#37
Paula Rd, Trlr 2
Kountze, TX 77625
|
- sq. feet
|
- baths - beds |
show details | |

|
#38
Gene Dr
Lumberton, TX 77657
|
1,538 sq. feet
|
- baths - beds |
show details | |

|
#39
Oakmont Dr
Beaumont, TX 77706
|
4,410 sq. feet
|
- baths - beds |
show details | |

|
#40
Brace St
Beaumont, TX 77708
|
2,604 sq. feet
|
- baths - beds |
show details |
| Photo | Address | Area | Beds / Baths | Price | Details |
|---|---|---|---|---|---|

|
#41
Bryan Ln
Lumberton, TX 77657
|
1,216 sq. feet
|
- baths - beds |
show details | |

|
#42
Westgate Dr
Beaumont, TX 77706
|
1,999 sq. feet
|
- baths - beds |
show details | |

|
#43
Plant Rd
Beaumont, TX 77708
|
4,068 sq. feet
|
- baths - beds |
show details | |

|
#44
Glendale St
Beaumont, TX 77707
|
- sq. feet
|
- baths - beds |
show details | |

|
#45
Cobblestone Ter
Lumberton, TX 77657
|
2,244 sq. feet
|
- baths - beds |
show details | |

|
#46
Pansy Dr
Beaumont, TX 77706
|
1,835 sq. feet
|
- baths - beds |
show details | |

|
#47
Hanover Cir
Beaumont, TX 77706
|
- sq. feet
|
- baths - beds |
show details | |

|
#48
W Bend
Beaumont, TX 77706
|
4,343 sq. feet
|
- baths - beds |
show details | |

|
#49
Wellington Oaks St
Beaumont, TX 77706
|
- sq. feet
|
- baths - beds |
show details | |

|
Check over 1 million property listings on Foreclosure.com!
|
browse all offers | |||


 | Best places to live between Beaumont and Houston downtown (16 replies) |
| Moving to Southeast Texas (Sour Lake, Mauriceville, Lumberton, Beaumont areas) (8 replies) |
| Need information on the Beaumont area (13 replies) |
| Job offer in Beaumont Tx..looking for more rural areas (3 replies) |
| Southeast Texas Median Home Prices (0 replies) |
| Moving to Beaumont (35 replies) |

Median year apartment built: 1976
Household type by relationship:
Households: 2,139- Male householders: 280 (60 living alone), Female householders: 429 (97 living alone)
332 spouses (332 opposite-sex spouses), 71 unmarried partners, (71 opposite-sex unmarried partners), 770 children (728 natural, 27 adopted, 14 stepchildren), 41 grandchildren, 10 brothers or sisters, 53 parents, 20 foster children, 6 other relatives, 123 non-relatives
Size of family households: 234 2-persons, 98 3-persons, 150 4-persons, 21 5-persons, 12 6-persons, 29 7-or-more-persons.
Size of nonfamily households: 166 1-person, 14 2-persons.
294 married couples with children.
371 single-parent households (147 men, 224 women).
91.1% of residents of Sour Lake speak English at home.
5.7% of residents speak Spanish at home (44% speak English very well, 30% speak English well, 27% speak English not well).
0.2% of residents speak other Indo-European language at home (100% speak English very well).
2.3% of residents speak Asian or Pacific Island language at home (23% speak English very well, 41% speak English well, 25% speak English not well, 11% don't speak English at all).
Foreign born population: 82 (3.8%)
(73.2% of them are naturalized citizens)
| Here: | 5.9 |
| State: | 6.3 |
| Here: | 4.5 |
| State: | 4.0 |

- Bedrooms in owner-occupied houses and condos in Sour Lake, Texas
- 0no bedroom
- 121 bedroom
- 882 bedrooms
- 3273 bedrooms
- 694 bedrooms
- 35+ bedrooms

- Bedrooms in renter-occupied apartments in Sour Lake, Texas
- 0no bedroom
- 401 bedroom
- 782 bedrooms
- 1113 bedrooms
- 34 bedrooms
- 05+ bedrooms

- Cars and other vehicles available in Sour Lake in owner-occupied houses/condos
- 0no vehicle
- 1371 vehicle
- 2552 vehicles
- 893 vehicles
- 74 vehicles
- 105+ vehicles

- Cars and other vehicles available in Sour Lake in renter-occupied apartments
- 7no vehicle
- 1131 vehicle
- 972 vehicles
- 153 vehicles
- 04 vehicles
- 05+ vehicles

- Rooms in owner-occupied houses in Sour Lake, Texas
- 01 room
- 02 rooms
- 123 rooms
- 774 rooms
- 865 rooms
- 1716 rooms
- 787 rooms
- 508 rooms
- 249+ rooms

- Rooms in renter-occupied apartments in Sour Lake, Texas
- 01 room
- 32 rooms
- 683 rooms
- 374 rooms
- 955 rooms
- 106 rooms
- 207 rooms
- 08 rooms
- 09+ rooms


Sour Lake, TX household income distribution

- 37Less than $10,000
- 68$10,000 to $19,999
- 71$20,000 to $29,999
- 67$30,000 to $39,999
- 29$40,000 to $49,999
- 80$50,000 to $59,999
- 82$60,000 to $74,999
- 98$75,000 to $99,999
- 73$100,000 to $124,999
- 48$125,000 to $149,999
- 43$150,000 to $199,999
- 35$200,000 or more

Home value of owner - occupied houses in 2022 in Sour Lake, TX
-
- 12Less than $10,000
- 4$15,000 to $19,999
- 4$20,000 to $24,999
- 13$25,000 to $29,999
- 27$30,000 to $34,999
- 11$35,000 to $39,999
- 10$50,000 to $59,999
- 4$60,000 to $69,999
- 34$70,000 to $79,999
- 36$80,000 to $89,999
- 11$90,000 to $99,999
- 38$100,000 to $124,999
- 32$125,000 to $149,999
- 30$150,000 to $174,999
- 48$175,000 to $199,999
- 23$200,000 to $249,999
- 22$250,000 to $299,999
- 60$300,000 to $399,999
- 13$400,000 to $499,999

Rent paid by renters in 2022 in Sour Lake, TX
-
- 5$200 to $249
- 9$300 to $349
- 5$350 to $399
- 35$400 to $449
- 1$450 to $499
- 2$500 to $549
- 6$550 to $599
- 42$650 to $699
- 11$700 to $749
- 2$750 to $799
- 15$800 to $899
- 1$900 to $999
- 74$1,000 to $1,249
- 11$1,250 to $1,499
- 2No cash rent

Percentage of workers working in this county: 35.1%
Number of people working at home: 83 (9.8% of all workers)
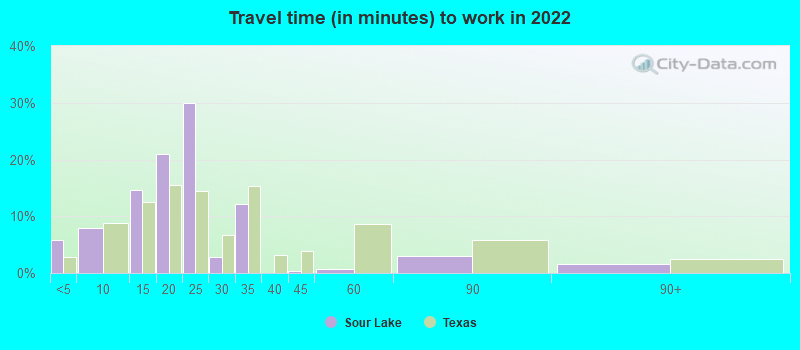
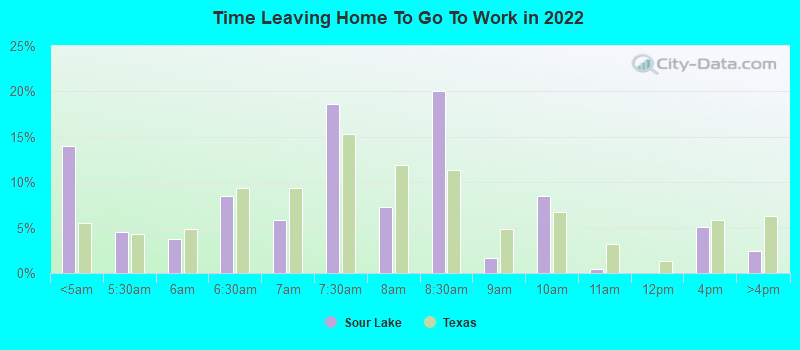
Travel time to work (commute)
- Less than 5 minutes: 76
- 5 to 9 minutes: 90
- 10 to 14 minutes: 12
- 15 to 19 minutes: 39
- 20 to 24 minutes: 96
- 25 to 29 minutes: 83
- 30 to 34 minutes: 119
- 35 to 39 minutes: 44
- 40 to 44 minutes: 53
- 45 to 59 minutes: 85
- 60 to 89 minutes: 50
- 90 or more minutes: 3
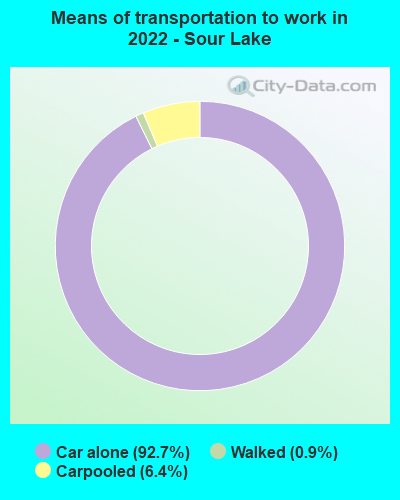
Means of transportation to work:
- Drove a car alone: 862 (82.6%)
- Carpooled: 64 (6.1%)
- Walked: 8 (0.8%)
- Worked at home: 83 (8.0%)
- Unemployment by race in 2022
- Unemployment rate for White non-Hispanic residents
- 6.9%Females
- Unemployment rate for other race residents
- 24.7%Males
- Unemployment rate for Hispanic or Latino residents
- 24.9%Males

- Year of entry for the foreign-born population in Sour Lake, Texas
- 02010 or later
- 112000 to 2009
- 121990 to 1999
- 11980 to 1989
- 01970 to 1979
- 5Before 1970

First ancestries reported:
- German: 251 (27.2%)
- Irish: 88 (9.5%)
- English: 81 (8.8%)
- American: 70 (7.6%)
- Scottish: 46 (5.0%)
- French: 31 (3.4%)
- Italian: 23 (2.5%)
- Scandinavian: 21 (2.3%)
- Canadian: 10 (1.1%)
- French Canadian: 8 (0.9%)
- Greek: 8 (0.9%)
- European: 7 (0.8%)
- Hungarian: 3 (0.3%)
- Norwegian: 3 (0.3%)
- Swedish: 3 (0.3%)
- Polish: 2 (0.2%)
- Scotch-Irish: 2 (0.2%)
Most common places of birth for foreign-born residents (%):
| Sour Lake: | 54.9% (45) |
| Texas: | 48.4% (2,411,723) |
| Sour Lake: | 23.2% (19) |
| Texas: | 3.7% (184,770) |
| Sour Lake: | 12.2% (10) |
| Texas: | 0.8% (37,989) |
| Sour Lake: | 3.7% (3) |
| Texas: | 2.3% (115,558) |
Place of birth for U.S.-born residents:
- This state: 1,574
- Other state: 428
- Northeast: 42
- Midwest: 64
- South: 251
- West: 66
94.4% of Sour Lake residents lived in the same house 1 years ago.
Out of people who lived in different houses, 23.9% lived in this county.
Out of people who lived in different counties, 80.2% lived in Texas.
| Sour Lake: | 94.4% |
| State average: | 85.7% |
Education attainment for males 25 years and older:
- No schooling: 0
- Nursery to 4th grade: 0
- 5th and 6th grade: 28
- 7th and 8th grade: 0
- 9th grade: 0
- 10th grade: 0
- 11th grade: 5
- 12th grade, no diploma: 4
- High school graduate (or equivalency): 305
- Less than 1 year of college: 35
- Some college more than 1 year, no degree: 44
- Associate degree: 22
- Bachelor's degree: 82
- Master's degree: 22
- Professional school degree: 8
- Doctorate degree: 0

Education attainment for females 25 years and older:
- No schooling: 14
- Nursery to 4th grade: 8
- 5th and 6th grade: 14
- 7th and 8th grade: 0
- 9th grade: 17
- 10th grade: 22
- 11th grade: 0
- 12th grade, no diploma: 4
- High school graduate (or equivalency): 250
- Less than 1 year of college: 37
- Some college more than 1 year, no degree: 149
- Associate degree: 23
- Bachelor's degree: 119
- Master's degree: 19
- Professional school degree: 0
- Doctorate degree: 0


Housing units in structures:
- One, detached: 564
- One, attached: 21
- Two: 2
- 3 or 4: 8
- 5 to 9: 27
- 10 to 19: 4
- 20 to 49: 2
- Mobile homes: 187
Housing units lacking complete kitchen facilities in 2022: 7.9%
House/condo owner moved in on average 12 years ago
Renter moved in on average 7 years ago


Private vs. public school enrollment:
| Here: | 23.6% |
| Texas: | 8.8% |
| Here: | 45.6% |
| Texas: | 8.0% |
| Here: | 33.3% |
| Texas: | 16.2% |


