South Barrington, IL (Illinois) Houses and Residents
| South Barrington: | $915,078 |
| Illinois: | $251,600 |
Total population: 4,822 (Urban population: 3,217, Rural population: 512 (all nonfarm))
Houses: 1,630 (1,619 occupied: 1,638 owner occupied, 9 renter occupied)
| % of renters here: | 1% |
| State: | 33% |
Housing density: 249 houses/condos per square mile
Median price asked for vacant for-sale houses and condos in 2022 in this county: $235,866.
Median gross rent in South Barrington, IL in 2022: over $-663,631,764
Housing units in South Barrington with a mortgage: 1,089 (101 second mortgage, 0 home equity loan, 99 both second mortgage and home equity loan)
Houses without a mortgage: 30
Median household income for houses/condos with a mortgage: $224,769
Median household income for apartments without a mortgage: $136,979
Median monthly housing costs: $3,908
Compare current foreclosures near South Barrington, IL:
| Photo | Address | Area | Beds / Baths | Price | Details |
|---|---|---|---|---|---|

|
#1
N 4th Ave
Des Plaines, IL 60016
|
1,381 sq. feet
|
1 baths 3 beds |
$335,000
|
show details |

|
#2
Carriage Way Dr
Arlington Heights, IL 60004
|
- sq. feet
|
2 baths 2 beds |
$179,900
|
show details |

|
#3
Corron Rd
Elgin, IL 60124
|
3,352 sq. feet
|
3 baths 4 beds |
$685,000
|
show details |

|
#4
S Lyman Ave
Des Plaines, IL 60016
|
2,233 sq. feet
|
2 baths 4 beds |
$330,000
|
show details |

|
#5
Wilke Rd
Rolling Meadows, IL 60008
|
1,061 sq. feet
|
1 baths 2 beds |
$319,900
|
show details |

|
#6
Webster Ln
Des Plaines, IL 60018
|
1,608 sq. feet
|
3 baths 3 beds |
$515,000
|
show details |

|
#7
Wisconsin Ave
Barrington, IL 60010
|
1,297 sq. feet
|
2 baths 3 beds |
$489,900
|
show details |

|
#8
E Crest Ave
Addison, IL 60101
|
2,023 sq. feet
|
1 baths 5 beds |
$296,100
|
show details |

|
#9
Briar Hill Dr
Schaumburg, IL 60194
|
1,600 sq. feet
|
2 baths 4 beds |
$410,400
|
show details |

|
#10
Avenida Serra Test
Des Plaines, IL 60018
|
- sq. feet
|
2 baths 3 beds |
$100,000
|
show details |
| Photo | Address | Area | Beds / Baths | Price | Details |
|---|---|---|---|---|---|

|
#11
Scarsdale Ct Unit C2
Schaumburg, IL 60193
|
950 sq. feet
|
1 baths 2 beds |
show details | |

|
#12
Hesterman Dr
Glendale Heights, IL 60139
|
1,263 sq. feet
|
2 baths 2 beds |
show details | |

|
#13
South St Apt C
Elgin, IL 60123
|
1,178 sq. feet
|
1 baths 2 beds |
show details | |

|
#14
S Collins St
South Elgin, IL 60177
|
2,871 sq. feet
|
3 baths 4 beds |
show details | |

|
#15
Glenwood Ct
Algonquin, IL 60102
|
2,026 sq. feet
|
3 baths 4 beds |
show details | |

|
#16
Narragansett Dr
Carol Stream, IL 60188
|
1,694 sq. feet
|
3 baths 3 beds |
show details | |

|
#17
Viewpoint Dr
Lake In The Hills, IL 60156
|
1,710 sq. feet
|
3 baths 3 beds |
show details | |

|
#18
Rochefort Ln
Wayne, IL 60184
|
5,636 sq. feet
|
5 baths 5 beds |
show details | |

|
#19
Narragansett Dr
Carol Stream, IL 60188
|
2,156 sq. feet
|
3 baths 4 beds |
show details | |

|
#20
E Rosehill Dr
Arlington Heights, IL 60004
|
1,233 sq. feet
|
3 baths 3 beds |
show details |
| Photo | Address | Area | Beds / Baths | Price | Details |
|---|---|---|---|---|---|

|
#21
Hobart Dr Unit B
South Elgin, IL 60177
|
1,152 sq. feet
|
2 baths 2 beds |
show details | |

|
#22
Petersburg Ct
Carol Stream, IL 60188
|
1,487 sq. feet
|
2 baths 4 beds |
show details | |

|
#23
Angeline Dr
South Elgin, IL 60177
|
1,734 sq. feet
|
3 baths 3 beds |
show details | |

|
#24
Nautical Way
Elgin, IL 60123
|
1,292 sq. feet
|
2 baths 2 beds |
show details | |

|
#25
Bunkerhill Ave
South Elgin, IL 60177
|
1,008 sq. feet
|
1 baths 3 beds |
show details | |

|
#26
W Martin Ln
Mount Prospect, IL 60056
|
1,116 sq. feet
|
2 baths 3 beds |
show details | |

|
#27
Anderson Dr
Lake In The Hills, IL 60156
|
1,304 sq. feet
|
2 baths 3 beds |
show details | |

|
#28
Crofton Dr
Algonquin, IL 60102
|
1,389 sq. feet
|
3 baths 3 beds |
show details | |

|
#29
Trinity Dr
Carol Stream, IL 60188
|
2,046 sq. feet
|
2 baths 3 beds |
show details | |

|
#30
E Harvard Cir
South Elgin, IL 60177
|
1,703 sq. feet
|
3 baths 3 beds |
show details |
| Photo | Address | Area | Beds / Baths | Price | Details |
|---|---|---|---|---|---|

|
#31
Mayfair Ln
Buffalo Grove, IL 60089
|
2,432 sq. feet
|
3 baths 3 beds |
show details | |

|
#32
Peach Tree Ln
Elk Grove Village, IL 60007
|
2,207 sq. feet
|
1 baths 3 beds |
show details | |

|
#33
Cimarron Dr
Cary, IL 60013
|
2,583 sq. feet
|
3 baths 4 beds |
show details | |

|
#34
Sandhurst Ln
South Elgin, IL 60177
|
1,220 sq. feet
|
2 baths 2 beds |
show details | |

|
#35
Blackhawk Dr
Lake In The Hills, IL 60156
|
1,204 sq. feet
|
3 baths 3 beds |
show details | |

|
#36
Burke Ln
South Elgin, IL 60177
|
1,604 sq. feet
|
3 baths 4 beds |
show details | |

|
#37
Spruce Ln
Elk Grove Village, IL 60007
|
1,308 sq. feet
|
2 baths 3 beds |
show details | |

|
#38
Carlisle Ave
Elk Grove Village, IL 60007
|
1,591 sq. feet
|
2 baths 4 beds |
show details | |

|
#39
Cottonwood Rd
Buffalo Grove, IL 60089
|
1,120 sq. feet
|
3 baths 3 beds |
show details | |

|
#40
Fairview Ln
South Elgin, IL 60177
|
1,604 sq. feet
|
2 baths 4 beds |
show details |
| Photo | Address | Area | Beds / Baths | Price | Details |
|---|---|---|---|---|---|

|
#41
Aronomink Cir
Elgin, IL 60123
|
2,046 sq. feet
|
3 baths 4 beds |
show details | |

|
#42
Pratt Rd
Wayne, IL 60184
|
2,699 sq. feet
|
3 baths 4 beds |
show details | |

|
#43
Gleneagle Cir
Elgin, IL 60123
|
1,382 sq. feet
|
2 baths 3 beds |
show details | |

|
#44
Lancaster Cir
Elgin, IL 60123
|
1,444 sq. feet
|
2 baths 2 beds |
show details | |

|
#45
S Cherrywood Dr
Mount Prospect, IL 60056
|
1,329 sq. feet
|
2 baths 3 beds |
show details | |

|
#46
Brookhaven Dr
Elk Grove Village, IL 60007
|
3,300 sq. feet
|
3 baths 4 beds |
show details | |

|
#47
Park Ave
Cary, IL 60013
|
1,224 sq. feet
|
2 baths 3 beds |
show details | |

|
#48
Witt Rd
Barrington, IL 60010
|
4,464 sq. feet
|
5 baths 5 beds |
show details | |

|
#49
N School St
Cary, IL 60013
|
1,178 sq. feet
|
2 baths 3 beds |
show details | |

|
Check over 1 million property listings on Foreclosure.com!
|
browse all offers | |||


 | Dilapidated homes in South Barrington? (55 replies) |
| Newly married couple looking for our first home! (52 replies) |
| Ryan Homes-The Conservancy (7 replies) |
| Adjacent suburbs that are vastly different from each other. (53 replies) |
| Good schools, newer housing near Schaumburg IL (9 replies) |
| Relocating & buying a home in hoffman estates, il!??! Good or bad choice? (18 replies) |

Household type by relationship:
Households: 4,889- Male householders: 1,015 (14 living alone), Female householders: 561 (38 living alone)
1,381 spouses (1,381 opposite-sex spouses), 0 unmarried partners, (0 opposite-sex unmarried partners), 1,573 children (1,524 natural, 0 adopted, 48 stepchildren), 96 grandchildren, 0 brothers or sisters, 149 parents, 0 foster children, 46 other relatives, 64 non-relatives
Size of family households: 747 2-persons, 291 3-persons, 235 4-persons, 145 5-persons, 68 6-persons, 64 7-or-more-persons.
Size of nonfamily households: 56 1-person.
1,052 married couples with children.
125 single-parent households (29 men, 96 women).
62.8% of residents of South Barrington speak English at home.
0.5% of residents speak Spanish at home (100% speak English very well).
16.5% of residents speak other Indo-European language at home (73% speak English very well, 16% speak English well, 6% speak English not well, 6% don't speak English at all).
20.0% of residents speak Asian or Pacific Island language at home (79% speak English very well, 16% speak English well, 4% speak English not well).
1.9% of residents speak other language at home (89% speak English very well, 11% speak English well).
Foreign born population: 1,451 (29.7%)
(91.5% of them are naturalized citizens)
| Here: | 10.0 |
| State: | 6.4 |
| Here: | -650406503.4 |
| State: | 4.1 |

- Bedrooms in owner-occupied houses and condos in South Barrington, Illinois
- 0no bedroom
- 01 bedroom
- 552 bedrooms
- 2023 bedrooms
- 8134 bedrooms
- 5685+ bedrooms

- Bedrooms in renter-occupied apartments in South Barrington, Illinois
- 0no bedroom
- 01 bedroom
- 92 bedrooms
- 03 bedrooms
- 04 bedrooms
- 05+ bedrooms

- Cars and other vehicles available in South Barrington in owner-occupied houses/condos
- 8no vehicle
- 1121 vehicle
- 7662 vehicles
- 4353 vehicles
- 2074 vehicles
- 1095+ vehicles

- Cars and other vehicles available in South Barrington in renter-occupied apartments
- 0no vehicle
- 01 vehicle
- 92 vehicles
- 03 vehicles
- 04 vehicles
- 05+ vehicles

- Rooms in owner-occupied houses in South Barrington, Illinois
- 01 room
- 02 rooms
- 03 rooms
- 304 rooms
- 395 rooms
- 1006 rooms
- 1917 rooms
- 2148 rooms
- 1,0649+ rooms

- Rooms in renter-occupied apartments in South Barrington, Illinois
- 01 room
- 02 rooms
- 03 rooms
- 04 rooms
- 05 rooms
- 06 rooms
- 07 rooms
- 08 rooms
- 99+ rooms


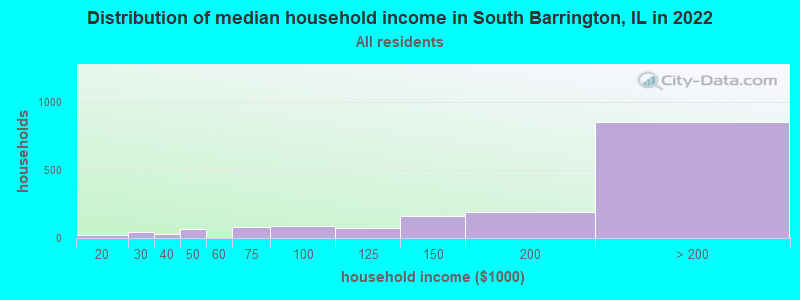
South Barrington, IL household income distribution

- 19$10,000 to $19,999
- 42$20,000 to $29,999
- 30$30,000 to $39,999
- 65$40,000 to $49,999
- 83$60,000 to $74,999
- 88$75,000 to $99,999
- 73$100,000 to $124,999
- 162$125,000 to $149,999
- 193$150,000 to $199,999
- 850$200,000 or more
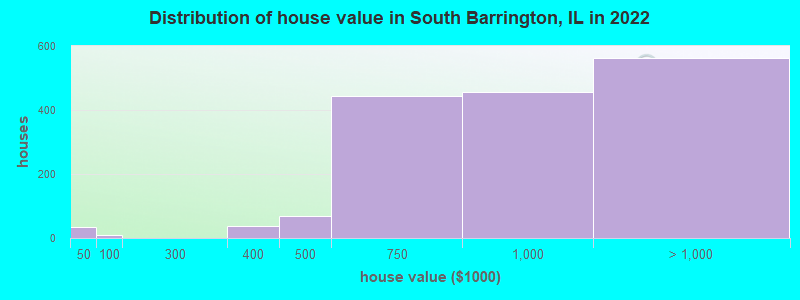
Home value of owner - occupied houses in 2022 in South Barrington, IL
-
- 18Less than $10,000
- 14$10,000 to $14,999
- 10$50,000 to $59,999
- 37$300,000 to $399,999
- 67$400,000 to $499,999
- 443$500,000 to $749,999
- 455$750,000 to $999,999
- 396$1,000,000 to $1,499,999
- 58$1,500,000 to $1,999,999
- 107$2,000,000 or more

Percentage of workers working in this county: 77.5%
Number of people working at home: 587 (25.9% of all workers)
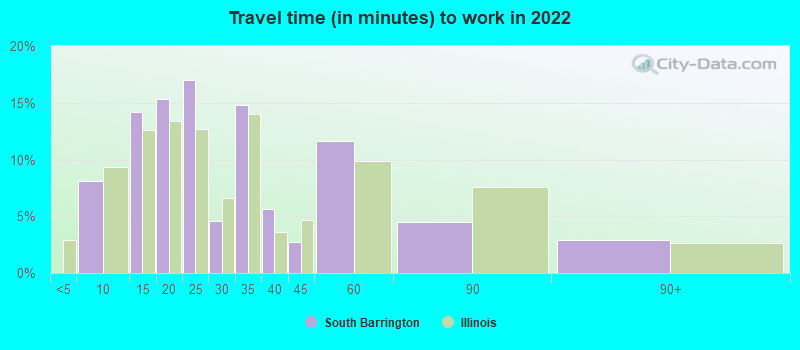
Travel time to work (commute)
- Less than 5 minutes: 22
- 5 to 9 minutes: 67
- 10 to 14 minutes: 98
- 15 to 19 minutes: 308
- 20 to 24 minutes: 188
- 25 to 29 minutes: 150
- 30 to 34 minutes: 394
- 35 to 39 minutes: 26
- 40 to 44 minutes: 215
- 45 to 59 minutes: 113
- 60 to 89 minutes: 85
- 90 or more minutes: 53
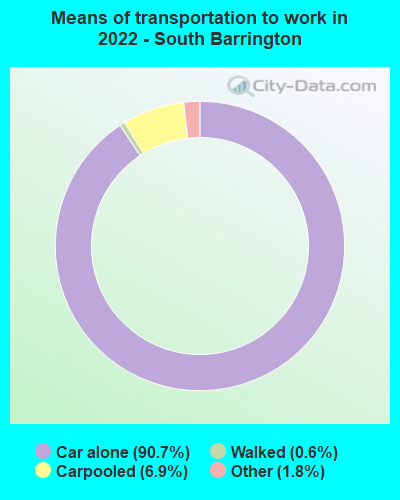
Means of transportation to work:
- Drove a car alone: 1,707 (71.9%)
- Carpooled: 138 (5.8%)
- Taxi: 34 (1.4%)
- Walked: 11 (0.5%)
- Worked at home: 587 (24.7%)

- Unemployment by race in 2022
- Unemployment rate for White non-Hispanic residents
- 2.4%Females
- Unemployment rate for Asian residents
- 3.2%Females

- Year of entry for the foreign-born population in South Barrington, Illinois
- 912010 or later
- 2232000 to 2009
- 2941990 to 1999
- 1851980 to 1989
- 2531970 to 1979
- 221Before 1970

First ancestries reported:
- Polish: 308 (10.1%)
- Italian: 280 (9.2%)
- Greek: 146 (4.8%)
- German: 128 (4.2%)
- European: 84 (2.8%)
- Irish: 84 (2.8%)
- Iranian: 68 (2.2%)
- English: 57 (1.9%)
- Swedish: 43 (1.4%)
- Jordanian: 34 (1.1%)
- Eastern European: 27 (0.9%)
- Scottish: 15 (0.5%)
- Russian: 14 (0.5%)
- Finnish: 10 (0.3%)
- Norwegian: 6 (0.2%)
- Arab: 5 (0.2%)
Most common places of birth for foreign-born residents (%):
| South Barrington: | 49.4% (717) |
| Illinois: | 9.2% (166,409) |
| South Barrington: | 11.3% (164) |
| Illinois: | 2.2% (40,393) |
| South Barrington: | 6.4% (93) |
| Illinois: | 5.2% (93,003) |
| South Barrington: | 5.7% (83) |
| Illinois: | 6.9% (124,474) |
| South Barrington: | 4.4% (64) |
| Illinois: | 4.1% (74,364) |
| South Barrington: | 4.0% (58) |
| Illinois: | 0.5% (8,827) |
| South Barrington: | 3.4% (49) |
| Illinois: | 0.0% (502) |
| South Barrington: | 3.0% (43) |
| Illinois: | 0.6% (10,720) |
| South Barrington: | 2.4% (35) |
| Illinois: | 0.5% (8,235) |
| South Barrington: | 1.9% (28) |
| Illinois: | 1.1% (19,306) |
| South Barrington: | 1.5% (22) |
| Illinois: | 0.4% (6,922) |
Place of birth for U.S.-born residents:
- This state: 2,627
- Other state: 700
- Northeast: 189
- Midwest: 369
- South: 66
- West: 89
98.4% of South Barrington residents lived in the same house 1 years ago.
Out of people who lived in different houses, 43.2% lived in this county.
Out of people who lived in different counties, 100.0% lived in Illinois.
| South Barrington: | 98.4% |
| State average: | 88.3% |
Education attainment for males 25 years and older:
- No schooling: 27
- Nursery to 4th grade: 25
- 5th and 6th grade: 0
- 7th and 8th grade: 0
- 9th grade: 0
- 10th grade: 0
- 11th grade: 0
- 12th grade, no diploma: 9
- High school graduate (or equivalency): 126
- Less than 1 year of college: 0
- Some college more than 1 year, no degree: 167
- Associate degree: 138
- Bachelor's degree: 425
- Master's degree: 400
- Professional school degree: 277
- Doctorate degree: 68

Education attainment for females 25 years and older:
- No schooling: 84
- Nursery to 4th grade: 0
- 5th and 6th grade: 0
- 7th and 8th grade: 0
- 9th grade: 0
- 10th grade: 15
- 11th grade: 0
- 12th grade, no diploma: 0
- High school graduate (or equivalency): 159
- Less than 1 year of college: 101
- Some college more than 1 year, no degree: 147
- Associate degree: 110
- Bachelor's degree: 475
- Master's degree: 384
- Professional school degree: 153
- Doctorate degree: 102


Housing units in structures:
- One, detached: 1,601
- One, attached: 15
- Two: 14

Private vs. public school enrollment:
| Here: | 6.4% |
| Illinois: | 13.3% |
| Here: | 4.5% |
| Illinois: | 9.9% |
| Here: | 72.9% |
| Illinois: | 27.4% |


