South Beloit, IL (Illinois) Houses and Residents
| South Beloit: | $171,397 |
| Illinois: | $251,600 |
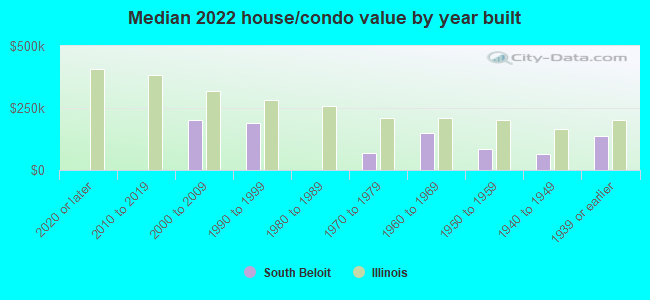
Mean price in 2022:
Detached houses: $136,386
Here: $136,386 State: $310,164 Townhouses or other attached units: $288,282
Here: $288,282 State: $286,230 In 2-unit structures: $89,124
Here: $89,124 State: $299,638 Mobile homes: $18,579
Here: $18,579 State: $78,855
Total population: 7,719 (Urban population: 4,983, Rural population: 242 (all nonfarm))
Houses: 3,433 (3,232 occupied: 2,260 owner occupied, 968 renter occupied)
| % of renters here: | 30% |
| State: | 33% |
Housing density: 867 houses/condos per square mile
Median price asked for vacant for-sale houses and condos in 2022: $552,940.
Median contract rent in 2022: $719 (lower quartile is $523, upper quartile is $1,107)
Median rent asked for vacant for-rent units in 2022: $563
Median gross rent in South Beloit, IL in 2022: $945
Housing units in South Beloit with a mortgage: 1,435 (54 second mortgage, 0 home equity loan, 29 both second mortgage and home equity loan)
Houses without a mortgage: 23
Median household income for houses/condos with a mortgage: $105,085
Median household income for apartments without a mortgage: $61,577
Median monthly housing costs: $974
Compare current foreclosures in South Beloit, IL:
| Photo | Address | Area | Beds / Baths | Price | Details |
|---|---|---|---|---|---|

|
#1
Vesper Dr
South Beloit, IL 61080
|
1,176 sq. feet
|
1 baths 3 beds |
show details | |

|
#2
S Park Ave
South Beloit, IL 61080
|
1,160 sq. feet
|
1 baths 3 beds |
show details | |

|
#3
Townline Ave
South Beloit, IL 61080
|
- sq. feet
|
- baths - beds |
show details | |

|
#4
Perry Ave
South Beloit, IL 61080
|
- sq. feet
|
- baths - beds |
show details | |

|
#5
Cheney Dr Apt 2
South Beloit, IL 61080
|
- sq. feet
|
- baths - beds |
show details | |

|
#6
Walnut Ln
South Beloit, IL 61080
|
- sq. feet
|
- baths - beds |
show details | |

|
#7
S Park Ave
South Beloit, IL 61080
|
- sq. feet
|
- baths - beds |
show details | |

|
#8
Glenwood Ave
South Beloit, IL 61080
|
- sq. feet
|
- baths - beds |
show details | |

|
#9
Commercial Pkwy
South Beloit, IL 61080
|
- sq. feet
|
- baths - beds |
show details | |

|
#10
Talcott Dr
South Beloit, IL 61080
|
- sq. feet
|
- baths - beds |
show details |
| Photo | Address | Area | Beds / Baths | Price | Details |
|---|---|---|---|---|---|

|
#11
Dearborn Ave
South Beloit, IL 61080
|
- sq. feet
|
- baths - beds |
show details | |

|
#12
Liston Ave Apt 5
South Beloit, IL 61080
|
- sq. feet
|
- baths - beds |
show details | |

|
#13
Winfield Dr
South Beloit, IL 61080
|
- sq. feet
|
- baths - beds |
show details | |

|
#14
Wittwer Rd
South Beloit, IL 61080
|
- sq. feet
|
- baths - beds |
show details | |

|
#15
Perry Ave
South Beloit, IL 61080
|
- sq. feet
|
- baths - beds |
show details | |

|
#16
Commercial Pkwy
South Beloit, IL 61080
|
- sq. feet
|
- baths - beds |
show details | |

|
#17
Hanna Way
South Beloit, IL 61080
|
- sq. feet
|
- baths - beds |
show details | |

|
#18
Whispering Wind Way
South Beloit, IL 61080
|
- sq. feet
|
- baths - beds |
show details | |

|
#19
Rockdale Rd
South Beloit, IL 61080
|
- sq. feet
|
- baths - beds |
show details | |

|
#20
Cassandra Way
South Beloit, IL 61080
|
- sq. feet
|
- baths - beds |
show details |
| Photo | Address | Area | Beds / Baths | Price | Details |
|---|---|---|---|---|---|

|
#21
Roscoe Ave
South Beloit, IL 61080
|
- sq. feet
|
- baths - beds |
show details | |

|
#22
Kirane Ct
South Beloit, IL 61080
|
- sq. feet
|
- baths - beds |
show details | |

|
#23
Spencer Ct
South Beloit, IL 61080
|
- sq. feet
|
- baths - beds |
show details | |

|
#24
Dorr Rd
South Beloit, IL 61080
|
- sq. feet
|
- baths - beds |
show details | |

|
#25
Fairway Dr
South Beloit, IL 61080
|
- sq. feet
|
- baths - beds |
show details | |

|
#26
Perry Ave
South Beloit, IL 61080
|
- sq. feet
|
- baths - beds |
show details | |

|
#27
Hunters Way
South Beloit, IL 61080
|
- sq. feet
|
- baths - beds |
show details | |

|
#28
Roscoe Ave
South Beloit, IL 61080
|
- sq. feet
|
- baths - beds |
show details | |

|
#29
Fairview Ave
South Beloit, IL 61080
|
- sq. feet
|
- baths - beds |
show details | |

|
#30
Lanae Way
South Beloit, IL 61080
|
- sq. feet
|
- baths - beds |
show details |
| Photo | Address | Area | Beds / Baths | Price | Details |
|---|---|---|---|---|---|

|
#31
Prairie Hill Rd
South Beloit, IL 61080
|
- sq. feet
|
- baths - beds |
show details | |

|
#32
Spencer Ct
South Beloit, IL 61080
|
- sq. feet
|
- baths - beds |
show details | |

|
#33
Hugh Dr
South Beloit, IL 61080
|
- sq. feet
|
- baths - beds |
show details | |

|
#34
Reidenbach Rd
South Beloit, IL 61080
|
- sq. feet
|
- baths - beds |
show details | |

|
#35
Whittemore Dr
South Beloit, IL 61080
|
- sq. feet
|
- baths - beds |
show details | |

|
#36
Salmon Ave
South Beloit, IL 61080
|
- sq. feet
|
- baths - beds |
show details | |

|
Check over 1 million property listings on Foreclosure.com!
|
browse all offers | |||


 | Saint Charles to Rockford? (18 replies) |
| Took a day trip to Rockford (17 replies) |
| Young Professional moving to Rockford Region (1 reply) |
| South Beloit area (3 replies) |
| New job in rockford (13 replies) |
| Job in Rockford, Where to Live?? (5 replies) |
Median year apartment built: 1971
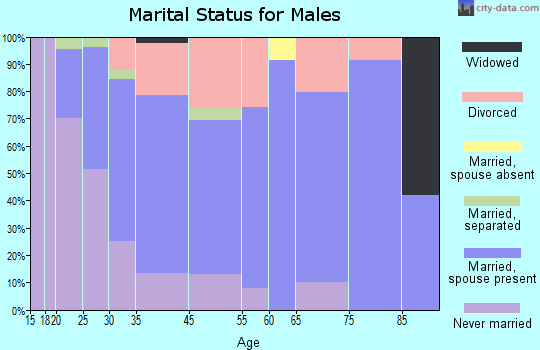
Household type by relationship:
Households: 7,875- Male householders: 1,342 (515 living alone), Female householders: 1,864 (506 living alone)
1,632 spouses (1,606 opposite-sex spouses), 370 unmarried partners, (338 opposite-sex unmarried partners), 2,349 children (2,325 natural, 6 adopted, 17 stepchildren), 81 grandchildren, 14 brothers or sisters, 19 parents, 0 foster children, 42 other relatives, 81 non-relatives
- In group quarters: 76
Size of family households: 648 2-persons, 575 3-persons, 454 4-persons, 117 5-persons, 92 6-persons, 4 7-or-more-persons.
Size of nonfamily households: 1,063 1-person, 294 2-persons, 13 3-persons, 10 4-persons.
1,751 married couples with children.
325 single-parent households (115 men, 210 women).
89.6% of residents of South Beloit speak English at home.
6.3% of residents speak Spanish at home (68% speak English very well, 18% speak English well, 8% speak English not well, 7% don't speak English at all).
2.1% of residents speak other Indo-European language at home (100% speak English very well).
1.2% of residents speak Asian or Pacific Island language at home (44% speak English very well, 56% speak English well).
Foreign born population: 304 (3.9%)
(47.7% of them are naturalized citizens)
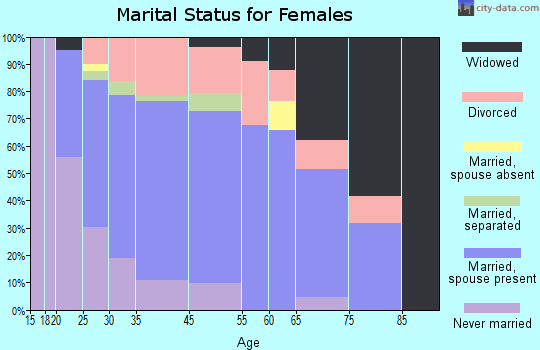
| Here: | 6.0 |
| State: | 6.4 |
| Here: | 5.2 |
| State: | 4.1 |
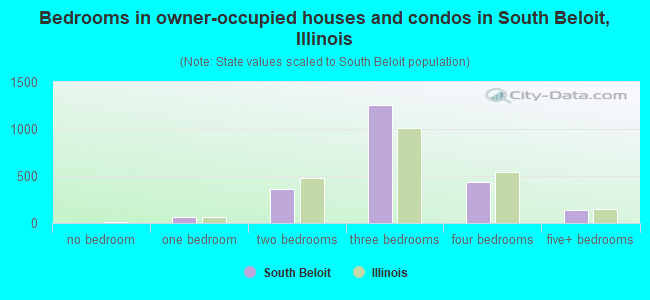
- Bedrooms in owner-occupied houses and condos in South Beloit, Illinois
- 0no bedroom
- 661 bedroom
- 3582 bedrooms
- 1,2563 bedrooms
- 4394 bedrooms
- 1425+ bedrooms
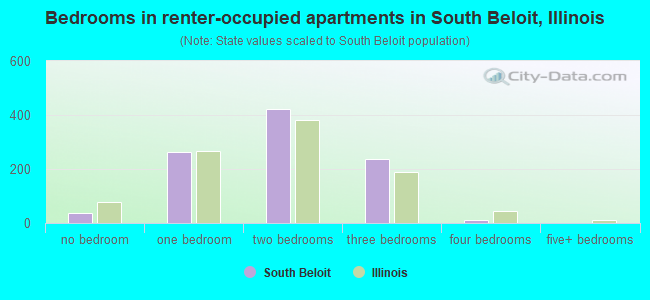
- Bedrooms in renter-occupied apartments in South Beloit, Illinois
- 36no bedroom
- 2631 bedroom
- 4212 bedrooms
- 2373 bedrooms
- 124 bedrooms
- 05+ bedrooms
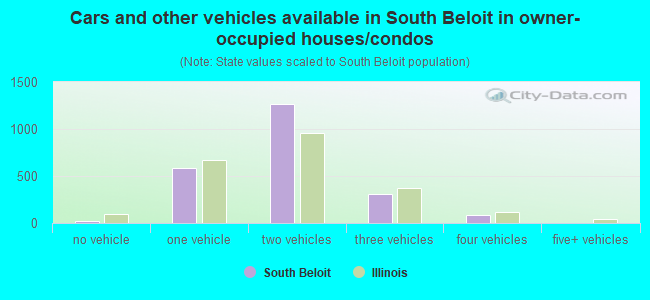
- Cars and other vehicles available in South Beloit in owner-occupied houses/condos
- 21no vehicle
- 5831 vehicle
- 1,2642 vehicles
- 3043 vehicles
- 894 vehicles
- 05+ vehicles
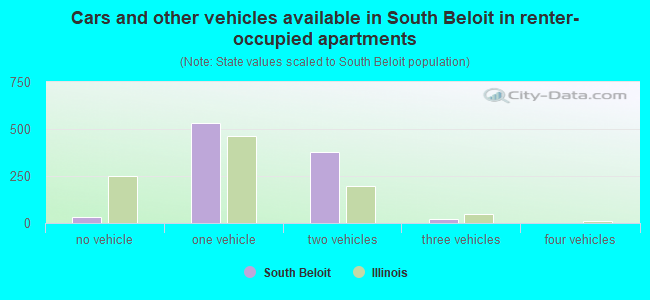
- Cars and other vehicles available in South Beloit in renter-occupied apartments
- 33no vehicle
- 5341 vehicle
- 3782 vehicles
- 233 vehicles
- 04 vehicles
- 05+ vehicles
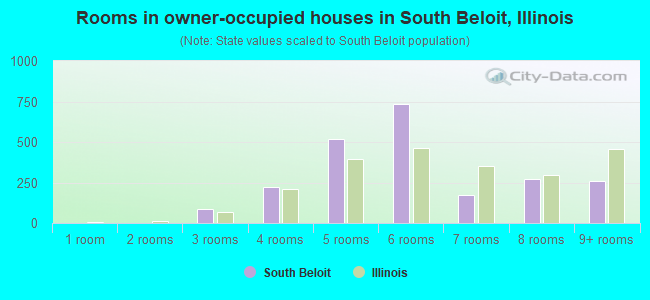
- Rooms in owner-occupied houses in South Beloit, Illinois
- 01 room
- 02 rooms
- 873 rooms
- 2204 rooms
- 5205 rooms
- 7336 rooms
- 1707 rooms
- 2718 rooms
- 2619+ rooms
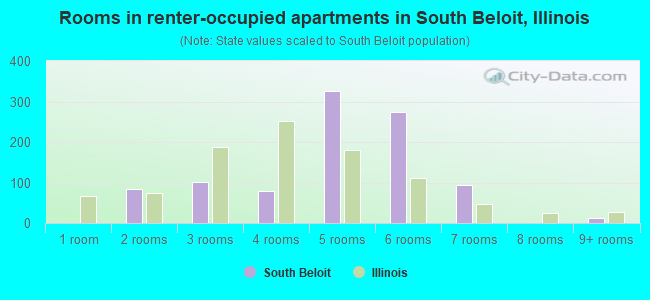
- Rooms in renter-occupied apartments in South Beloit, Illinois
- 01 room
- 842 rooms
- 1013 rooms
- 804 rooms
- 3255 rooms
- 2746 rooms
- 947 rooms
- 08 rooms
- 129+ rooms
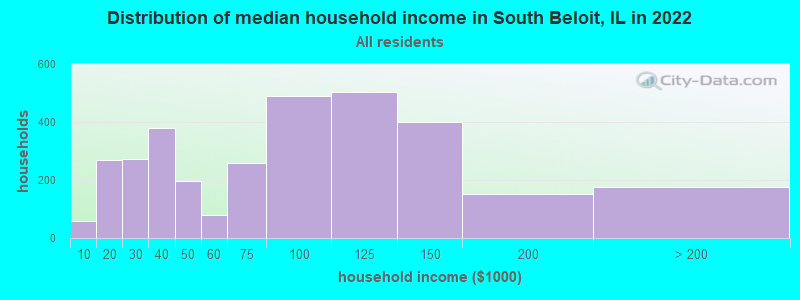
South Beloit, IL household income distribution

- 60Less than $10,000
- 269$10,000 to $19,999
- 271$20,000 to $29,999
- 379$30,000 to $39,999
- 196$40,000 to $49,999
- 78$50,000 to $59,999
- 258$60,000 to $74,999
- 489$75,000 to $99,999
- 504$100,000 to $124,999
- 400$125,000 to $149,999
- 152$150,000 to $199,999
- 175$200,000 or more
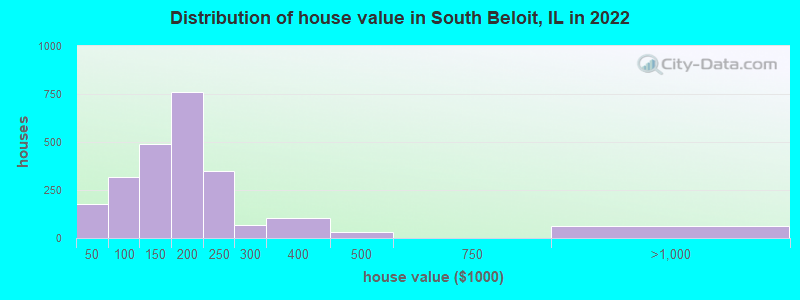
Home value of owner - occupied houses in 2022 in South Beloit, IL
-
- 41Less than $10,000
- 58$10,000 to $14,999
- 13$15,000 to $19,999
- 9$20,000 to $24,999
- 8$30,000 to $34,999
- 45$40,000 to $49,999
- 27$50,000 to $59,999
- 46$60,000 to $69,999
- 25$70,000 to $79,999
- 128$80,000 to $89,999
- 44$90,000 to $99,999
- 93$100,000 to $124,999
- 397$125,000 to $149,999
- 332$150,000 to $174,999
- 425$175,000 to $199,999
- 348$200,000 to $249,999
- 69$250,000 to $299,999
- 104$300,000 to $399,999
- 32$400,000 to $499,999
- 60$750,000 to $999,999
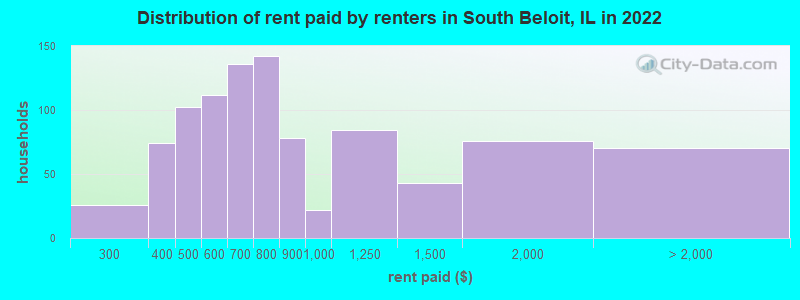
Rent paid by renters in 2022 in South Beloit, IL
-
- 26$250 to $299
- 73$300 to $349
- 101$450 to $499
- 111$500 to $549
- 22$600 to $649
- 114$650 to $699
- 141$700 to $749
- 77$800 to $899
- 22$900 to $999
- 84$1,000 to $1,249
- 42$1,250 to $1,499
- 76$1,500 to $1,999
- 24$2,000 to $2,499
- 45No cash rent
Percentage of workers working in this county: 63.9%
Number of people working at home: 138 (3.5% of all workers)
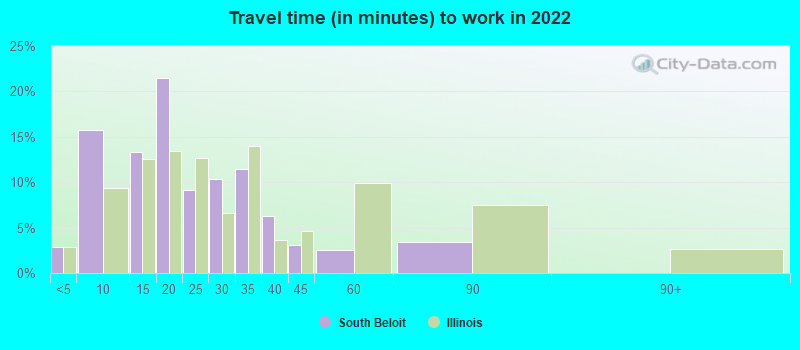
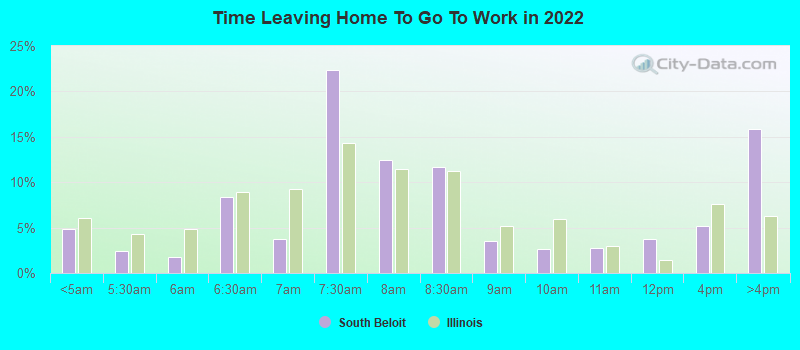
Travel time to work (commute)
- Less than 5 minutes: 222
- 5 to 9 minutes: 441
- 10 to 14 minutes: 452
- 15 to 19 minutes: 547
- 20 to 24 minutes: 365
- 25 to 29 minutes: 753
- 30 to 34 minutes: 322
- 35 to 39 minutes: 129
- 40 to 44 minutes: 85
- 45 to 59 minutes: 59
- 60 to 89 minutes: 184
- 90 or more minutes: 230
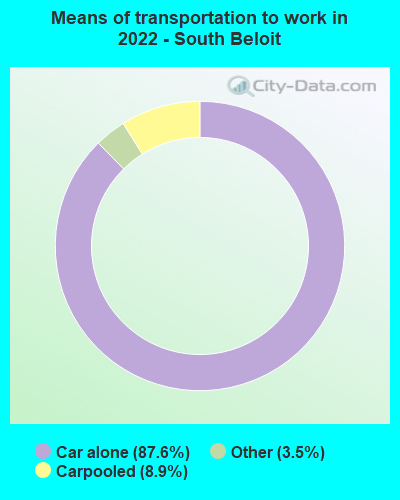
Means of transportation to work:
- Drove a car alone: 2,212 (80.9%)
- Carpooled: 231 (8.4%)
- Taxi: 161 (5.9%)
- Worked at home: 138 (5.0%)
- Unemployment by race in 2022
- Unemployment rate for White non-Hispanic residents
- 5.3%Males
- 0.5%Females
- Unemployment rate for other race residents
- 46.0%Females
- Unemployment rate for two or more race residents
- 26.0%Females
- Unemployment rate for Hispanic or Latino residents
- 28.5%Females
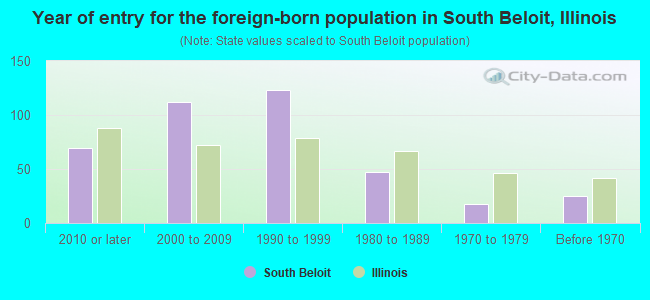
- Year of entry for the foreign-born population in South Beloit, Illinois
- 692010 or later
- 1122000 to 2009
- 1231990 to 1999
- 471980 to 1989
- 181970 to 1979
- 25Before 1970
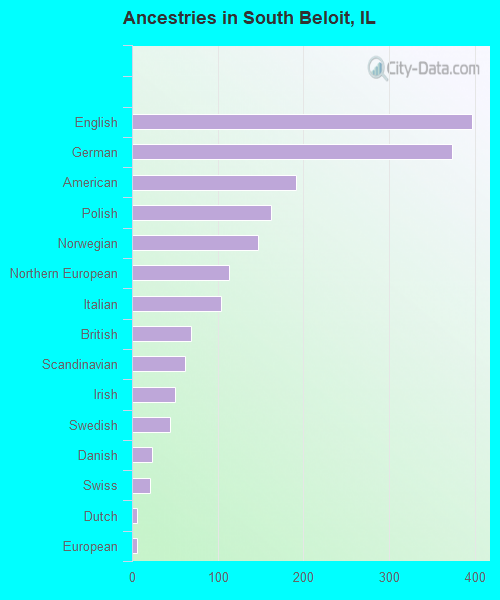
First ancestries reported:
- English: 397 (13.7%)
- German: 374 (12.9%)
- American: 192 (6.6%)
- Polish: 162 (5.6%)
- Norwegian: 147 (5.1%)
- Northern European: 113 (3.9%)
- Italian: 104 (3.6%)
- British: 69 (2.4%)
- Scandinavian: 62 (2.1%)
- Irish: 50 (1.7%)
- Swedish: 44 (1.5%)
- Danish: 23 (0.8%)
- Swiss: 21 (0.7%)
- Dutch: 6 (0.2%)
- European: 6 (0.2%)
Most common places of birth for foreign-born residents (%):
| South Beloit: | 51.7% (179) |
| Illinois: | 34.7% (626,958) |
| South Beloit: | 17.3% (60) |
| Illinois: | 6.9% (124,474) |
| South Beloit: | 14.5% (50) |
| Illinois: | 4.1% (74,364) |
| South Beloit: | 2.9% (10) |
| Illinois: | 0.3% (6,186) |
| South Beloit: | 2.9% (10) |
| Illinois: | 0.9% (16,844) |
| South Beloit: | 1.7% (6) |
| Illinois: | 0.0% (502) |
Place of birth for U.S.-born residents:
- This state: 4,453
- Other state: 3,147
- Northeast: 47
- Midwest: 2,505
- South: 240
- West: 322
86.7% of South Beloit residents lived in the same house 1 years ago.
Out of people who lived in different houses, 40.3% lived in this county.
Out of people who lived in different counties, 17.1% lived in Illinois.
| South Beloit: | 86.7% |
| State average: | 88.3% |
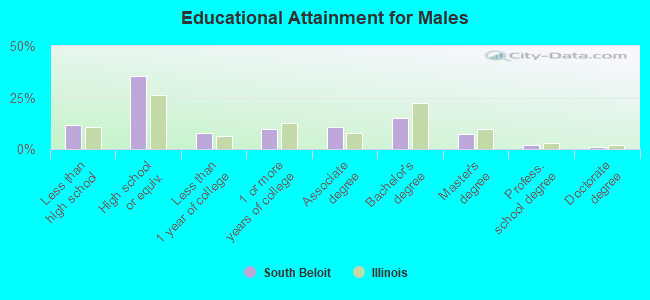
Education attainment for males 25 years and older:
- No schooling: 24
- Nursery to 4th grade: 0
- 5th and 6th grade: 43
- 7th and 8th grade: 5
- 9th grade: 11
- 10th grade: 25
- 11th grade: 49
- 12th grade, no diploma: 152
- High school graduate (or equivalency): 947
- Less than 1 year of college: 204
- Some college more than 1 year, no degree: 263
- Associate degree: 293
- Bachelor's degree: 402
- Master's degree: 196
- Professional school degree: 51
- Doctorate degree: 24
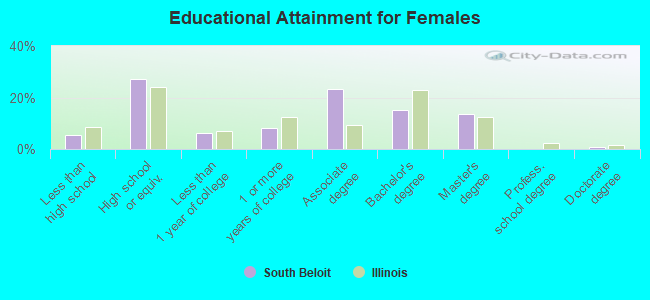
Education attainment for females 25 years and older:
- No schooling: 5
- Nursery to 4th grade: 0
- 5th and 6th grade: 23
- 7th and 8th grade: 3
- 9th grade: 40
- 10th grade: 16
- 11th grade: 24
- 12th grade, no diploma: 28
- High school graduate (or equivalency): 714
- Less than 1 year of college: 164
- Some college more than 1 year, no degree: 215
- Associate degree: 619
- Bachelor's degree: 404
- Master's degree: 361
- Professional school degree: 0
- Doctorate degree: 19
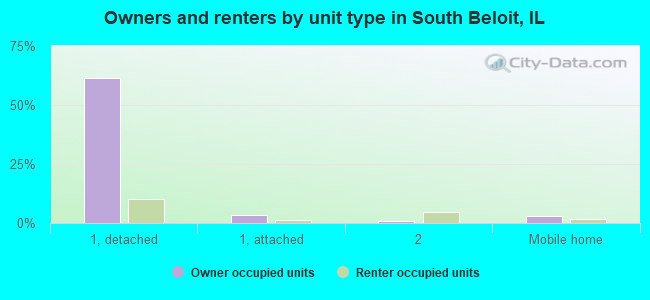
Housing units in structures:
- One, detached: 2,535
- One, attached: 219
- Two: 123
- 3 or 4: 154
- 5 to 9: 90
- 10 to 19: 41
- 20 to 49: 24
- 50 or more: 48
- Mobile homes: 191
Median worth of mobile homes: $16,978
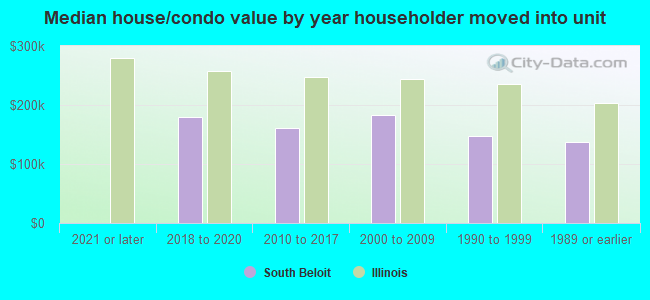
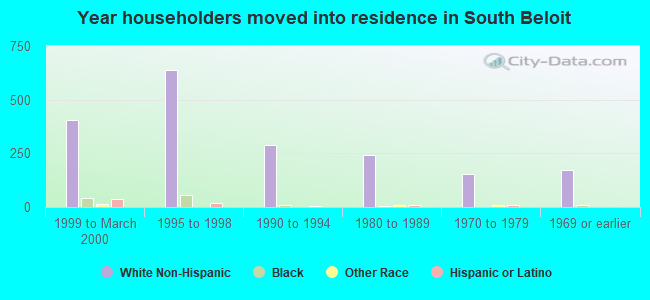
House/condo owner moved in on average 9 years ago
Renter moved in on average 2 years ago
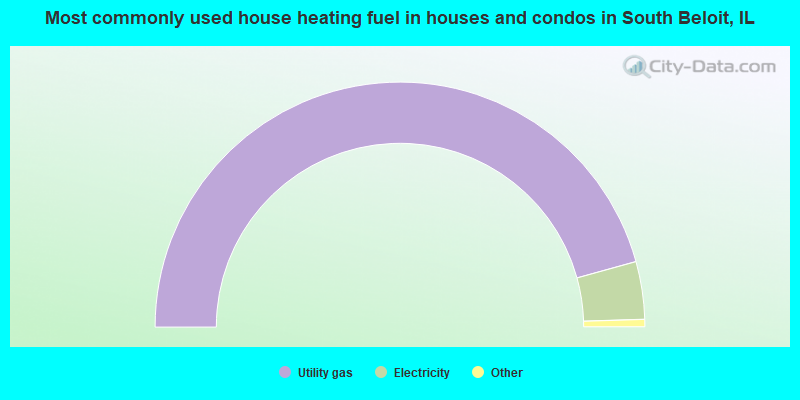
- 91.4%Utility gas
- 7.6%Electricity
- 0.6%Wood
- 0.3%No fuel used
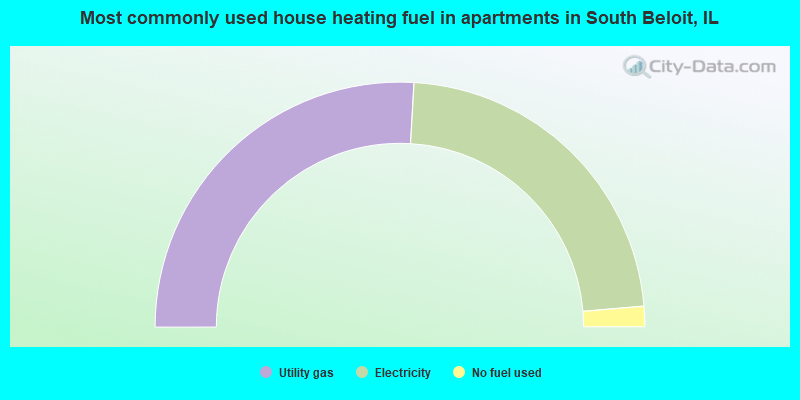
- 51.9%Utility gas
- 45.5%Electricity
- 2.7%No fuel used
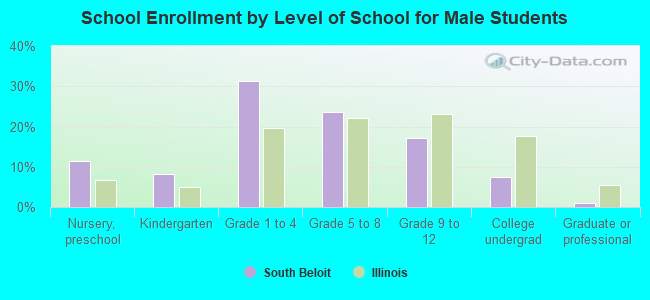
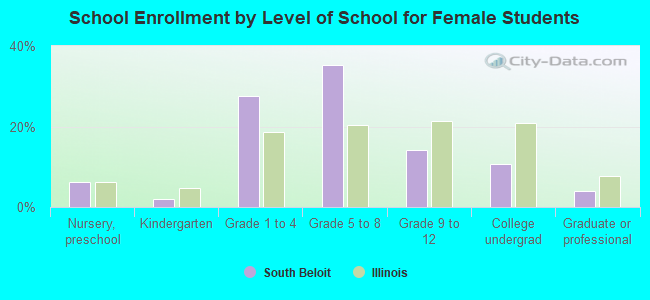
Private vs. public school enrollment:
| Here: | 16.2% |
| Illinois: | 13.3% |
| Here: | 18.9% |
| Illinois: | 9.9% |
| Here: | 18.2% |
| Illinois: | 27.4% |