South Bend, IN (Indiana) Houses and Residents
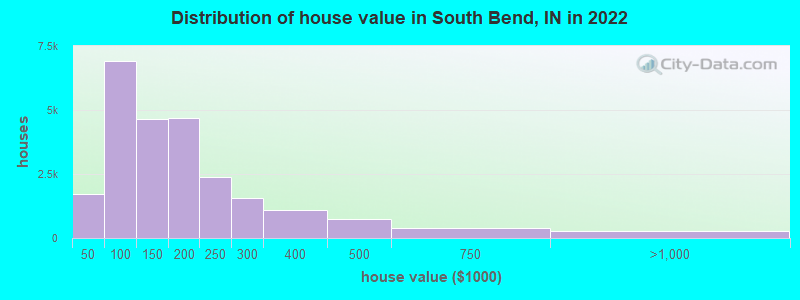
Estimated median house or condo value in 2022: $142,300 (it was $66,200 in 2000 )
South Bend:
$142,300Indiana:
$208,700
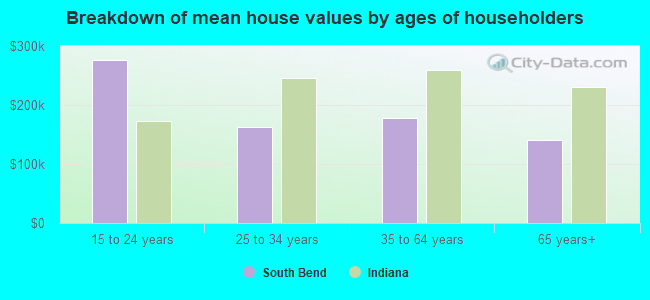
Lower value quartile - upper value quartile: $86,100 - $209,900Mean price in 2022: Detached houses: $156,959 Here:
$156,959State:
$257,916
Townhouses or other attached units: $309,046 Here:
$309,046State:
$224,114
In 2-unit structures: $113,910 Here:
$113,910State:
$175,375
In 3-to-4-unit structures: $67,563 Here:
$67,563State:
$151,116
In 5-or-more-unit structures: $123,142 Here:
$123,142State:
$200,844
Mobile homes: $22,509 Here:
$22,509State:
$67,116
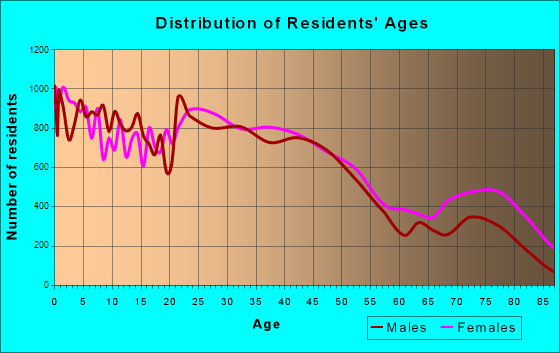
Total population: 101,190 (All urban)
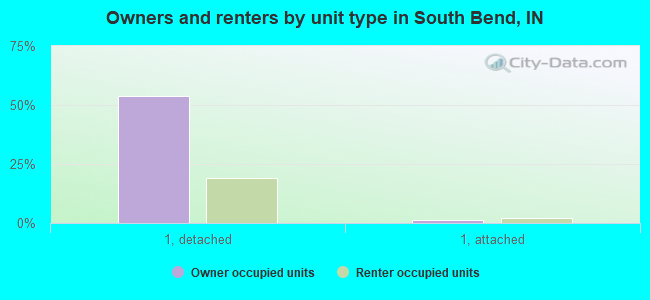
Houses: 48,918 (41,488 occupied: 23,868 owner occupied, 17,620 renter occupied )
% of renters here:
42%State:
29%
Housing density: 1,265 houses/condos per square mile
Median price asked for vacant for-sale houses and condos in 2022: $148,296.
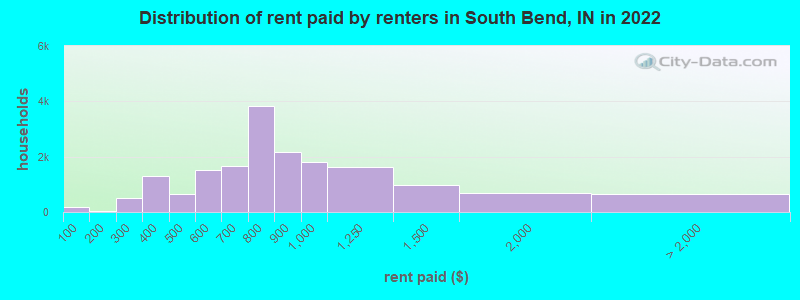
Median contract rent in 2022: $763 (lower quartile is $606, upper quartile is $956)
Median rent asked for vacant for-rent units in 2022: $1,121
Median gross rent in South Bend, IN in 2022: $948
Housing units in South Bend with a mortgage: 13,685 (1,545 second mortgage, 0 home equity loan, 1,273 both second mortgage and home equity loan )Houses without a mortgage: 412
Median household income for houses/condos with a mortgage: $75,511
Median household income for apartments without a mortgage: $55,880
Median monthly housing costs: $867
Data:
Median house or condo value ($)
Median house or condo value ($ change since 2000)
Median house or condo value ($) - White
Median house or condo value ($) - Black or African American
Median house or condo value ($) - Asian
Median house or condo value ($) - Hispanic or Latino
Median house or condo value ($) - American Indian and Alaska Native
Median house or condo value ($) - Multirace
Median house or condo value ($) - Other Race
Median price asked for mobile homes ($)
Household density (households per square mile)
Mean house or condo value by units in structure - 1, detached ($)
Mean house or condo value by units in structure - 1, attached ($)
Mean house or condo value by units in structure - 2 ($)
Mean house or condo value by units in structure by units in structure - 3 or 4 ($)
Mean house or condo value by units in structure - 5 or more ($)
Mean house or condo value by units in structure - Boat, RV, van, etc. ($)
Mean house or condo value by units in structure - Mobile home ($)
Median contract rent ($)
Median contract rent - Lower quartile ($)
Median contract rent - Upper quartile ($)
Median gross rent ($)
Urban houses (%)
Rural houses (%)
Houses occupied (%)
Houses occupied (% change since 2000)
Houses owner occupied (%)
Houses owner occupied (% change since 2000)
Houses renter occupied (%)
Houses renter occupied (% change since 2000)
Vacant housing units - For rent (%)
Vacant housing units - For rent (% change since 2000)
Vacant housing units - For sale only (%)
Vacant housing units - For sale only (% change since 2000)
Vacant housing units - Rented or sold, not occupied (%)
Vacant housing units - Rented or sold, not occupied (% change since 2000)
Vacant housing units - For seasonal, recreational, or occasional use (%)
Vacant housing units - For seasonal, recreational, or occasional use (% change since 2000)
Vacant housing units - For migrant workers (%)
Vacant housing units - For migrant workers (% change since 2000)
Vacant housing units - Other vacant (%)
Vacant housing units - Other vacant (% change since 2000)
Median monthly housing costs ($)
Median household income for houses/condos with a mortgage ($)
Median household income for houses/condos without a mortgage ($)
Median household income ($)
Median household income ($) - White
Median household income ($) - Black or African American
Median household income ($) - Asian
Median household income ($) - Hispanic or Latino
Median household income ($) - American Indian and Alaska Native
Median household income ($) - Multirace
Median household income ($) - Other Race
Mortgage status - with mortgage (%)
Mortgage status - with second mortgage (%)
Mortgage status - with home equity loan (%)
Mortgage status - with both second mortgage and home equity loan (%)
Mortgage status - without a mortgage (%)
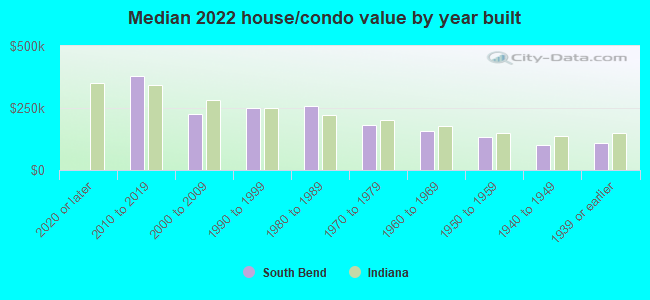
Median year house/condo built
Median year apartment built
Household type by relationship - Male householder living alone (%)
Household type by relationship - Male householder not living alone (%)
Household type by relationship - Female householder living alone (%)
Household type by relationship - Female householder not living alone (%)
Household type by relationship - Opposite-Sex spouse (%)
Household type by relationship - Same-Sex spouse (%)
Household type by relationship - Opposite-Sex unmarried partner (%)
Household type by relationship - Same-Sex unmarried partner (%)
Household type by relationship - In group quarters (%)
Size of family households - 2-person household (%)
Size of family households - 3-person household (%)
Size of family households - 4-person household (%)
Size of family households - 5-person household (%)
Size of family households - 6-person household (%)
Size of family households - 7-or-more-person household (%)
Size of nonfamily households - 1-person household (%)
Size of nonfamily households - 2-person household (%)
Size of nonfamily households - 3-person household (%)
Size of nonfamily households - 4-person household (%)
Size of nonfamily households - 5-person household (%)
Size of nonfamily households - 6-person household (%)
Size of nonfamily households - 7-or-moreperson household (%)
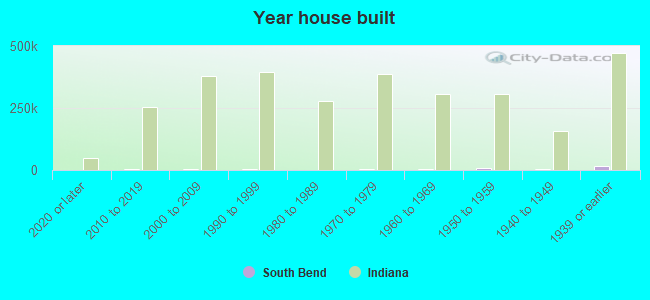
Year house built - Built 2010 or later (%)
Year house built - Built 2000 to 2009 (%)
Year house built - Built 1990 to 1999 (%)
Year house built - Built 1980 to 1989 (%)
Year house built - Built 1970 to 1979 (%)
Year house built - Built 1960 to 1969 (%)
Year house built - Built 1950 to 1959 (%)
Year house built - Built 1940 to 1949 (%)
Year house built - Built 1939 or earlier (%)
Median number of rooms in houses and condos
Median number of rooms in apartments
Median number of bedrooms in owner occupied houses
Mean number of bedrooms in owner occupied houses
Median number of bedrooms in renter occupied houses
Mean number of bedrooms in renter occupied houses
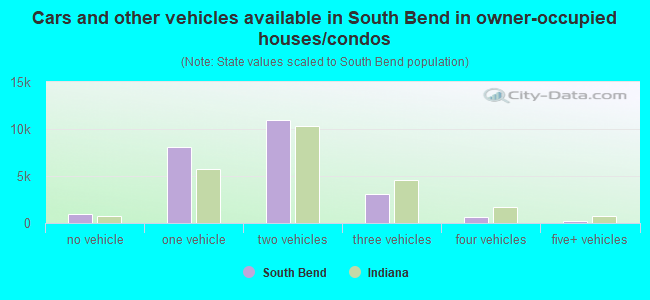
Median number of vehichles in owner occupied houses
Mean number of vehichles in owner occupied houses
Median number of vehichles in renter occupied houses
Mean number of vehichles in renter occupied houses
Rooms in owner-occupied houses - 1 room (%)
Rooms in owner-occupied houses - 2 rooms (%)
Rooms in owner-occupied houses - 3 rooms (%)
Rooms in owner-occupied houses - 4 rooms (%)
Rooms in owner-occupied houses - 5 rooms (%)
Rooms in owner-occupied houses - 6 rooms (%)
Rooms in owner-occupied houses - 7 rooms (%)
Rooms in owner-occupied houses - 8 rooms (%)
Rooms in owner-occupied houses - 9+ rooms (%)
Rooms in renter-occupied houses - 1 room (%)
Rooms in renter-occupied houses - 2 rooms (%)
Rooms in renter-occupied houses - 3 rooms (%)
Rooms in renter-occupied houses - 4 rooms (%)
Rooms in renter-occupied houses - 5 rooms (%)
Rooms in renter-occupied houses - 6 rooms (%)
Rooms in renter-occupied houses - 7 rooms (%)
Rooms in renter-occupied houses - 8 rooms (%)
Rooms in renter-occupied houses - 9+ rooms (%)
Bedrooms in owner-occupied houses - no bedrooms (%)
Bedrooms in owner-occupied houses - 1 bedroom (%)
Bedrooms in owner-occupied houses - 2 bedrooms (%)
Bedrooms in owner-occupied houses - 3 bedrooms (%)
Bedrooms in owner-occupied houses - 4 bedrooms (%)
Bedrooms in owner-occupied houses - 5+ bedrooms (%)
Bedrooms in renter-occupied houses - no bedrooms (%)
Bedrooms in renter-occupied houses - 1 bedroom (%)
Bedrooms in renter-occupied houses - 2 bedrooms (%)
Bedrooms in renter-occupied houses - 3 bedrooms (%)
Bedrooms in renter-occupied houses - 4 bedrooms (%)
Bedrooms in renter-occupied houses - 5+ bedrooms (%)
Vehicles available in owner-occupied houses - no vehicle available (%)
Vehicles available in owner-occupied houses - 1 vehicle available(%)
Vehicles available in owner-occupied houses - 2 Vehicles available (%)
Vehicles available in owner-occupied houses - 3 Vehicles available (%)
Vehicles available in owner-occupied houses - 4 Vehicles available (%)
Vehicles available in owner-occupied houses - 5+ Vehicles available (%)
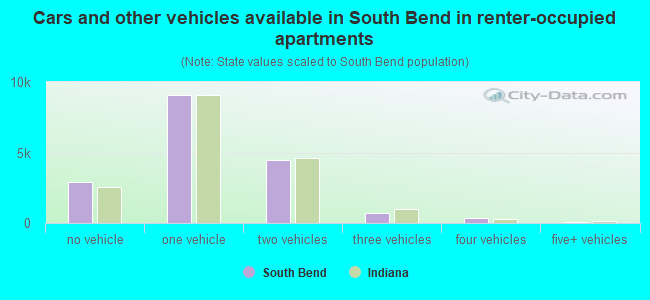
Vehicles available in renter-occupied houses - no vehicle available (%)
Vehicles available in renter-occupied houses - 1 vehicle available (%)
Vehicles available in renter-occupied houses - 2 Vehicles available (%)
Vehicles available in renter-occupied houses - 3 Vehicles available (%)
Vehicles available in renter-occupied houses - 4 Vehicles available (%)
Vehicles available in renter-occupied houses - 5+ Vehicles available (%)
Housing units in structures - 1, detached (%)
Housing units in structures - 1, attached (%)
Housing units in structures - 2 (%)
Housing units in structures - 3 or 4 (%)
Housing units in structures - 5 to 9 (%)
Housing units in structures - 10 to 19 (%)
Housing units in structures - 20 to 49 (%)
Housing units in structures - 50 or more (%)
Housing units in structures - Mobile home (%)
Housing units in structures - Boat, RV, van, etc. (%)
Housing units in structures - Owners - 1, detached (%)
Housing units in structures - Owners - 1, attached (%)
Housing units in structures - Owners - 2 (%)
Housing units in structures - Owners - 3 or 4 (%)
Housing units in structures - Owners - 5 to 9 (%)
Housing units in structures - Owners - 10 to 19 (%)
Housing units in structures - Owners - 20 to 49 (%)
Housing units in structures - Owners - 50 or more (%)
Housing units in structures - Owners - Mobile home (%)
Housing units in structures - Owners - Boat, RV, van, etc. (%)
Housing units in structures - Renters - 1, detached (%)
Housing units in structures - Renters - 1, attached (%)
Housing units in structures - Renters - 2 (%)
Housing units in structures - Renters - 3 or 4 (%)
Housing units in structures - Renters - 5 to 9 (%)
Housing units in structures - Renters - 10 to 19 (%)
Housing units in structures - Renters - 20 to 49 (%)
Housing units in structures - Renters - 50 or more (%)
Housing units in structures - Renters - Mobile home (%)
Housing units in structures - Renters - Boat, RV, van, etc. (%)
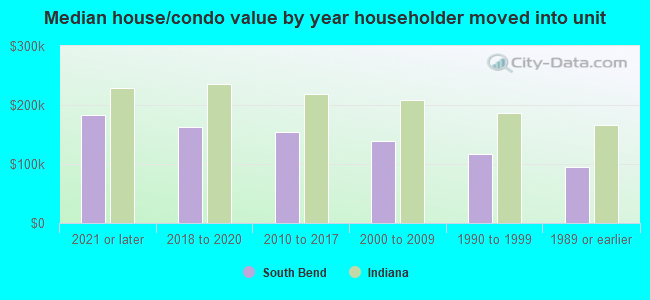
House/condo owner moved in on average (years ago)
Renter moved in on average (years ago)
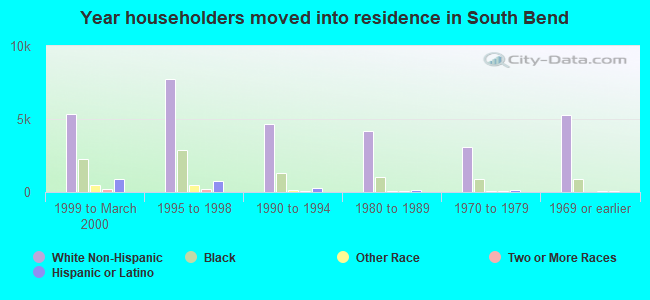
Year householder moved into unit - Moved in 1999 to March 2000 (%)
Year householder moved into unit - Moved in 1999 to March 2000 (%) - White
Year householder moved into unit - Moved in 1999 to March 2000 (%) - Black or African American
Year householder moved into unit - Moved in 1999 to March 2000 (%) - Asian
Year householder moved into unit - Moved in 1999 to March 2000 (%) - Hispanic or Latino
Year householder moved into unit - Moved in 1999 to March 2000 (%) - American Indian and Alaska Native
Year householder moved into unit - Moved in 1999 to March 2000 (%) - Multirace
Year householder moved into unit - Moved in 1999 to March 2000 (%) - Other Race
Year householder moved into unit - Moved in 1995 to 1998 (%)
Year householder moved into unit - Moved in 1995 to 1998 (%) - White
Year householder moved into unit - Moved in 1995 to 1998 (%) - Black or African American
Year householder moved into unit - Moved in 1995 to 1998 (%) - Asian
Year householder moved into unit - Moved in 1995 to 1998 (%) - Hispanic or Latino
Year householder moved into unit - Moved in 1995 to 1998 (%) - American Indian and Alaska Native
Year householder moved into unit - Moved in 1995 to 1998 (%) - Multirace
Year householder moved into unit - Moved in 1995 to 1998 (%) - Other Race
Year householder moved into unit - Moved in 1990 to 1994 (%)
Year householder moved into unit - Moved in 1990 to 1994 (%) - White
Year householder moved into unit - Moved in 1990 to 1994 (%) - Black or African American
Year householder moved into unit - Moved in 1990 to 1994 (%) - Asian
Year householder moved into unit - Moved in 1990 to 1994 (%) - Hispanic or Latino
Year householder moved into unit - Moved in 1990 to 1994 (%) - American Indian and Alaska Native
Year householder moved into unit - Moved in 1990 to 1994 (%) - Multirace
Year householder moved into unit - Moved in 1990 to 1994 (%) - Other Race
Year householder moved into unit - Moved in 1980 to 1989 (%)
Year householder moved into unit - Moved in 1980 to 1989 (%) - White
Year householder moved into unit - Moved in 1980 to 1989 (%) - Black or African American
Year householder moved into unit - Moved in 1980 to 1989 (%) - Asian
Year householder moved into unit - Moved in 1980 to 1989 (%) - Hispanic or Latino
Year householder moved into unit - Moved in 1980 to 1989 (%) - American Indian and Alaska Native
Year householder moved into unit - Moved in 1980 to 1989 (%) - Multirace
Year householder moved into unit - Moved in 1980 to 1989 (%) - Other Race
Year householder moved into unit - Moved in 1970 to 1979 (%)
Year householder moved into unit - Moved in 1970 to 1979 (%) - White
Year householder moved into unit - Moved in 1970 to 1979 (%) - Black or African American
Year householder moved into unit - Moved in 1970 to 1979 (%) - Asian
Year householder moved into unit - Moved in 1970 to 1979 (%) - Hispanic or Latino
Year householder moved into unit - Moved in 1970 to 1979 (%) - American Indian and Alaska Native
Year householder moved into unit - Moved in 1970 to 1979 (%) - Multirace
Year householder moved into unit - Moved in 1970 to 1979 (%) - Other Race
Year householder moved into unit - Moved in 1969 or earlier (%)
Year householder moved into unit - Moved in 1969 or earlier (%) - White
Year householder moved into unit - Moved in 1969 or earlier (%) - Black or African American
Year householder moved into unit - Moved in 1969 or earlier (%) - Asian
Year householder moved into unit - Moved in 1969 or earlier (%) - Hispanic or Latino
Year householder moved into unit - Moved in 1969 or earlier (%) - American Indian and Alaska Native
Year householder moved into unit - Moved in 1969 or earlier (%) - Multirace
Year householder moved into unit - Moved in 1969 or earlier (%) - Other Race
Housing units lacking complete plumbing facilities (%)
Housing units lacking complete kitchen facilities (%)
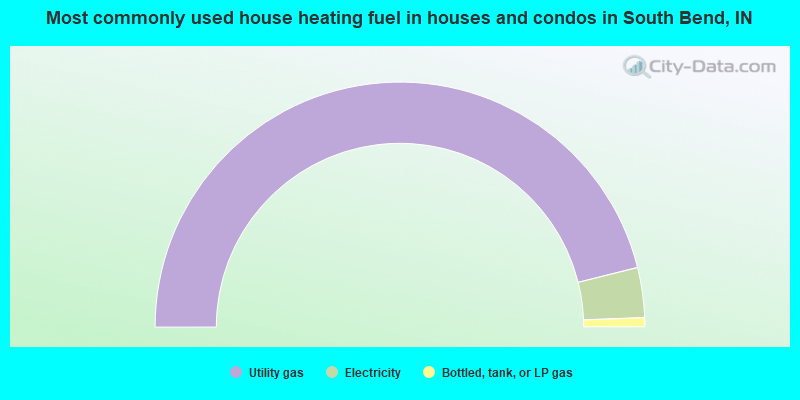
House heating fuel used in houses and condos - Utility gas (%)
House heating fuel used in houses and condos - Bottled, tank, or LP gas (%)
House heating fuel used in houses and condos - Electricity (%)
House heating fuel used in houses and condos - Fuel oil, kerosene, etc. (%)
House heating fuel used in houses and condos - Coal or coke (%)
House heating fuel used in houses and condos - Wood (%)
House heating fuel used in houses and condos - Solar energy (%)
House heating fuel used in houses and condos - Other fuel (%)
House heating fuel used in houses and condos - No fuel used (%)
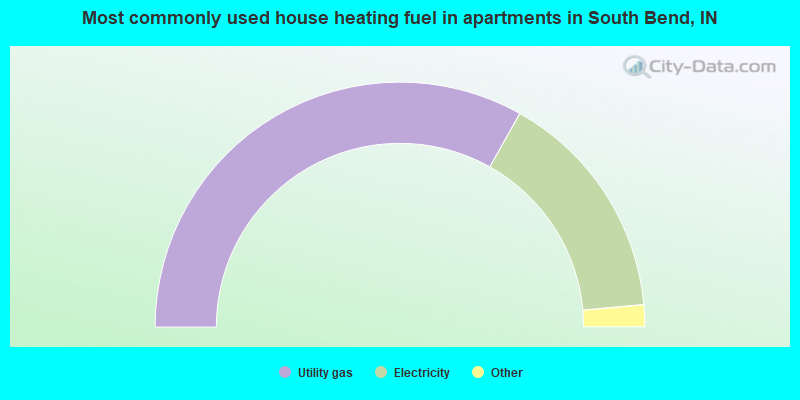
House heating fuel used in apartments - Utility gas (%)
House heating fuel used in apartments - Bottled, tank, or LP gas (%)
House heating fuel used in apartments - Electricity (%)
House heating fuel used in apartments - Fuel oil, kerosene, etc. (%)
House heating fuel used in apartments - Coal or coke (%)
House heating fuel used in apartments - Wood (%)
House heating fuel used in apartments - Solar energy (%)
House heating fuel used in apartments - Other fuel (%)
House heating fuel used in apartments - No fuel used (%)
Median year house/condo built: 1953Median year apartment built: 1960Household type by relationship:
Households: 105,984
Male householders: 19,536 (6,759 living alone ), Female householders: 21,952 (7,263 living alone )14,507 spouses (14,254 opposite-sex spouses ), 4,009 unmarried partners , (3,431 opposite-sex unmarried partners ), 34,380 children (32,357 natural , 913 adopted , 1,110 stepchildren ), 3,064 grandchildren , 1,270 brothers or sisters , 1,269 parents , 88 foster children , 990 other relatives , 3,019 non-relatives In group quarters: 1,900
Size of family households: 10,617 2-persons , 5,751 3-persons , 3,800 4-persons , 2,272 5-persons , 736 6-persons , 549 7-or-more-persons .
Size of nonfamily households: 14,022 1-person , 3,558 2-persons , 70 3-persons , 66 4-persons , 47 6-persons .
12,922 married couples with children. single-parent households (1,712 men , 8,990 women ).
84.1% of residents of South Bend speak English at home. of residents speak Spanish at home (64% speak English very well , 21% speak English well , 12% speak English not well , 2% don't speak English at all ).of residents speak other Indo-European language at home (84% speak English very well , 10% speak English well , 6% speak English not well ).of residents speak Asian or Pacific Island language at home (53% speak English very well , 28% speak English well , 17% speak English not well , 3% don't speak English at all ).of residents speak other language at home (66% speak English very well , 23% speak English well , 11% speak English not well ).
Foreign born population: 9,236 (8.7%)of them are naturalized citizens )
Median number of rooms in houses and condos:
Median number of rooms in apartments
Owner-occupied Renter-occupied
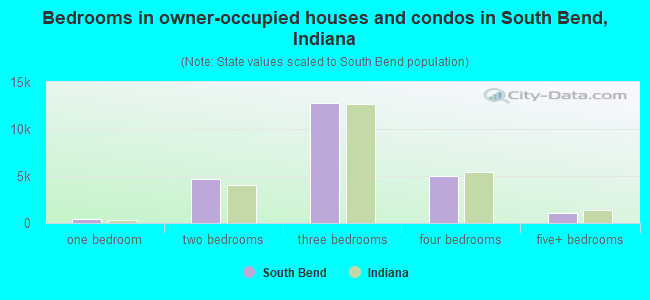
Bedrooms in owner-occupied houses and condos in South Bend, Indiana
0 no bedroom 392 1 bedroom 4,675 2 bedrooms 12,768 3 bedrooms 5,003 4 bedrooms 1,030 5+ bedrooms
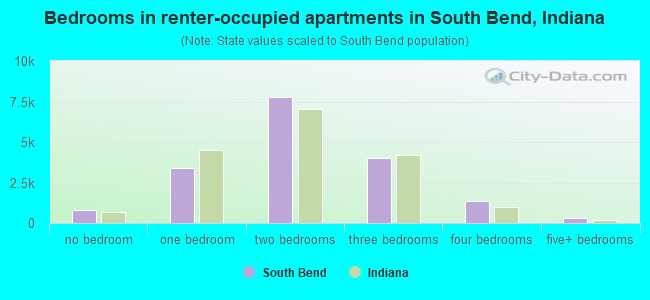
Bedrooms in renter-occupied apartments in South Bend, Indiana
791 no bedroom 3,372 1 bedroom 7,763 2 bedrooms 4,022 3 bedrooms 1,370 4 bedrooms 302 5+ bedrooms
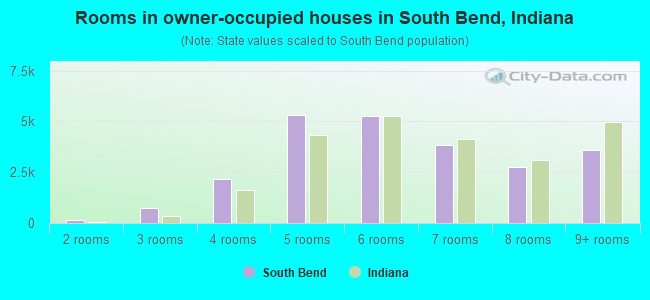
Owner-occupied Renter-occupied
Rooms in owner-occupied houses in South Bend, Indiana
0 1 room 137 2 rooms 717 3 rooms 2,185 4 rooms 5,319 5 rooms 5,259 6 rooms 3,863 7 rooms 2,772 8 rooms 3,616 9+ rooms
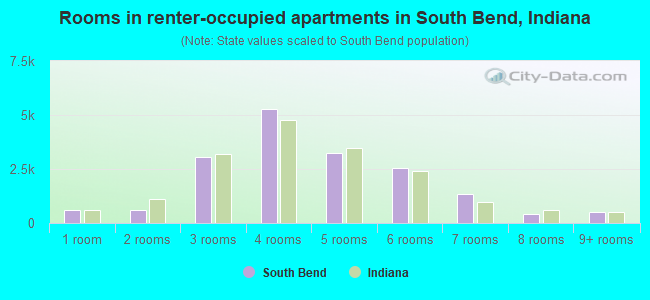
Rooms in renter-occupied apartments in South Bend, Indiana
580 1 room 622 2 rooms 3,073 3 rooms 5,277 4 rooms 3,237 5 rooms 2,566 6 rooms 1,361 7 rooms 415 8 rooms 489 9+ rooms
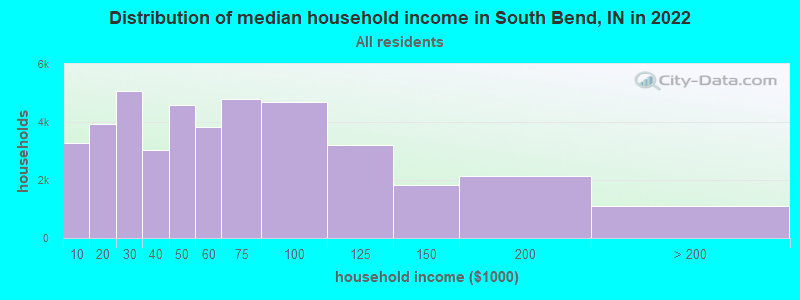
South Bend, IN household income distribution 3,285 Less than $10,0003,947 $10,000 to $19,9995,068 $20,000 to $29,9993,040 $30,000 to $39,9994,593 $40,000 to $49,9993,817 $50,000 to $59,9994,785 $60,000 to $74,9994,705 $75,000 to $99,9993,204 $100,000 to $124,9991,830 $125,000 to $149,9992,123 $150,000 to $199,9991,091 $200,000 or more
Home value of owner - occupied houses in 2022 in South Bend, IN 157 Less than $10,000286 $10,000 to $14,99980 $15,000 to $19,999154 $25,000 to $29,999183 $30,000 to $34,999322 $35,000 to $39,999528 $40,000 to $49,999714 $50,000 to $59,999946 $60,000 to $69,9991,894 $70,000 to $79,9991,162 $80,000 to $89,9991,664 $90,000 to $99,9992,018 $100,000 to $124,9992,635 $125,000 to $149,9992,554 $150,000 to $174,9992,133 $175,000 to $199,9992,379 $200,000 to $249,9991,549 $250,000 to $299,9991,100 $300,000 to $399,999744 $400,000 to $499,999389 $500,000 to $749,999231 $750,000 to $999,99946 $1,000,000 to $1,499,999Rent paid by renters in 2022 in South Bend, IN 174 Less than $10044 $150 to $199388 $200 to $249109 $250 to $299863 $300 to $349432 $350 to $399312 $400 to $449353 $450 to $499876 $500 to $549660 $550 to $599722 $600 to $649956 $650 to $6992,283 $700 to $7491,533 $750 to $7992,152 $800 to $8991,824 $900 to $9991,624 $1,000 to $1,249991 $1,250 to $1,499680 $1,500 to $1,99927 $2,000 to $2,499164 $3,500 or more453 No cash rent
Percentage of workers working in this county: 82.7%Number of people working at home: 3,548 (7.1% of all workers )
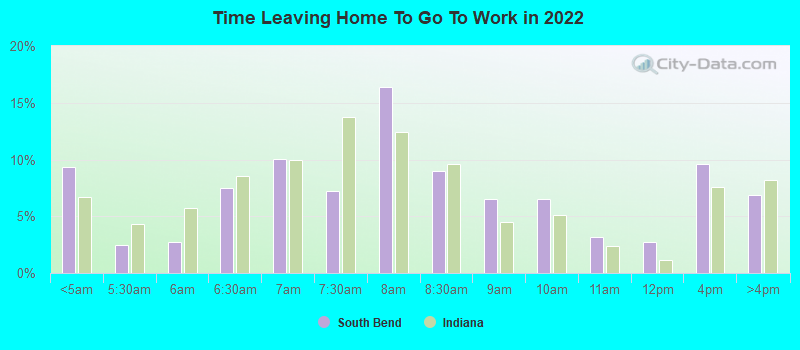
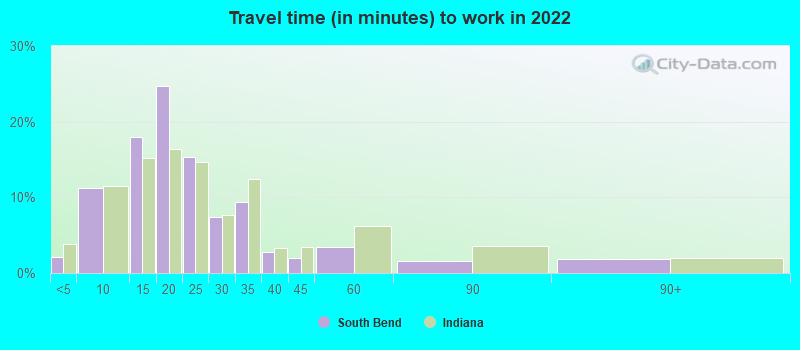
Travel time to work (commute)
Less than 5 minutes: 6475 to 9 minutes: 5,54810 to 14 minutes: 9,28015 to 19 minutes: 11,28320 to 24 minutes: 5,78125 to 29 minutes: 1,54330 to 34 minutes: 5,55735 to 39 minutes: 1,55340 to 44 minutes: 1,18845 to 59 minutes: 2,59460 to 89 minutes: 82190 or more minutes: 366
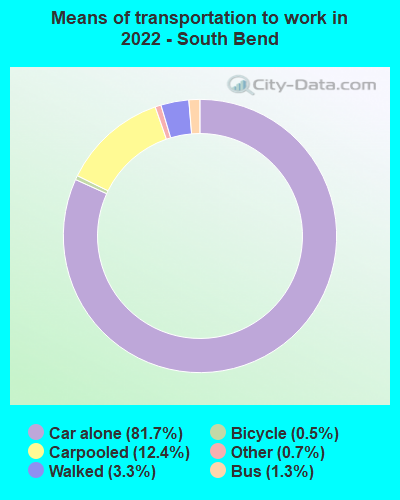
Means of transportation to work:
Drove a car alone: 49,240 (77.1%)Carpooled: 7,488 (11.7%)Bus : 792 (1.2%)Ferryboat: 28 (0.0%)Taxi: 431 (0.7%)Bicycle: 312 (0.5%)Walked: 2,008 (3.1%)Worked at home: 3,548 (5.6%)
Unemployment by race in 2022
Unemployment rate for White non-Hispanic residents 3.6% Males3.3% FemalesUnemployment rate for Black residents 14.4% Males7.3% FemalesUnemployment rate for American Indian and Alaska Native residents 4.0% MalesUnemployment rate for Asian residents 3.9% Males1.3% FemalesUnemployment rate for other race residents 5.9% Males1.9% FemalesUnemployment rate for two or more race residents 2.5% Males7.1% FemalesUnemployment rate for Hispanic or Latino residents 3.0% Males9.7% Females
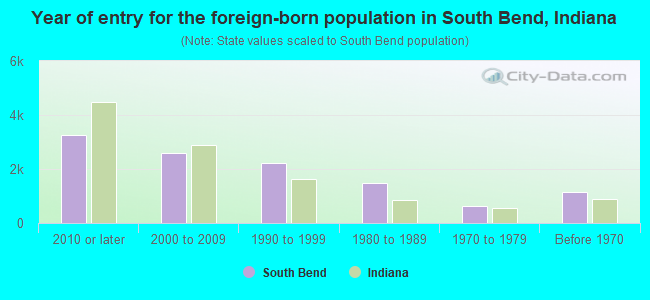
Year of entry for the foreign-born population in South Bend, Indiana
3,272 2010 or later 2,598 2000 to 2009 2,222 1990 to 1999 1,494 1980 to 1989 619 1970 to 1979 1,134 Before 1970
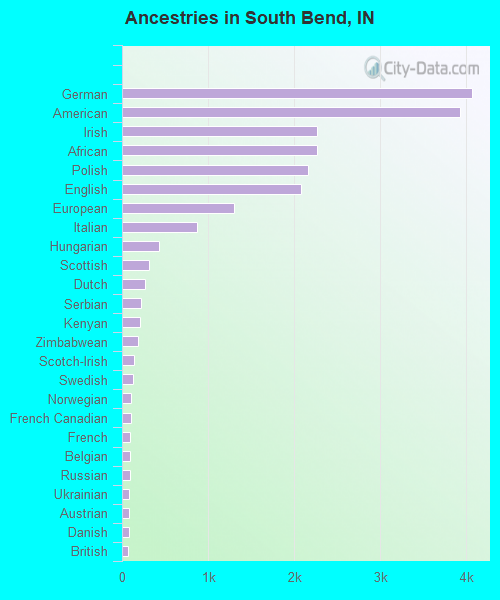
First ancestries reported:
German: 4,060 (7.9%)
American: 3,922 (7.6%)
Irish: 2,264 (4.4%)
African: 2,263 (4.4%)
Polish: 2,166 (4.2%)
English: 2,083 (4.0%)
European: 1,303 (2.5%)
Italian: 875 (1.7%)
Hungarian: 425 (0.8%)
Scottish: 318 (0.6%)
Dutch: 268 (0.5%)
Serbian: 226 (0.4%)
Kenyan: 208 (0.4%)
Zimbabwean: 181 (0.4%)
Scotch-Irish: 134 (0.3%)
Swedish: 126 (0.2%)
Norwegian: 109 (0.2%)
French Canadian: 105 (0.2%)
French: 93 (0.2%)
Belgian: 91 (0.2%)
Russian: 91 (0.2%)
Ukrainian: 86 (0.2%)
Austrian: 80 (0.2%)
Danish: 77 (0.1%)
British: 72 (0.1%)
Eastern European: 72 (0.1%)
Greek: 72 (0.1%)
Scandinavian: 69 (0.1%)
Ethiopian: 64 (0.1%)
Ghanaian: 62 (0.1%)
Liberian: 59 (0.1%)
Northern European: 54 (0.1%)
Jamaican: 54 (0.1%)
Lithuanian: 51 (0.10%)
Canadian: 40 (0.08%)
Welsh: 40 (0.08%)
Pennsylvania German: 39 (0.08%)
Haitian: 39 (0.08%)
Swiss: 37 (0.07%)
Nigerian: 37 (0.07%)
Croatian: 36 (0.07%)
Assyrian: 34 (0.07%)
Yugoslavian: 29 (0.06%)
Guyanese: 28 (0.05%)
Lebanese: 22 (0.04%)
Iranian: 19 (0.04%)
Cajun: 17 (0.03%)
Sierra Leonean: 16 (0.03%)
Slavic: 14 (0.03%)
Czech: 13 (0.03%)
Luxembourger: 11 (0.02%)
Cape Verdean: 10 (0.02%)
Brazilian: 9 (0.02%)
Palestinian: 9 (0.02%)
Finnish: 8 (0.02%)
Maltese: 6 (0.01%)
Armenian: 5 (0.01%)
Syrian: 5 (0.01%)
Carpatho Rusyn: 5 (0.01%)
Most common places of birth for foreign-born residents (%): Mexico South Bend:
41.4% (3,984)Indiana:
27.0% (101,996)
Other Eastern Africa South Bend:
3.3% (315)Indiana:
0.4% (1,469)
Venezuela South Bend:
3.1% (297)Indiana:
1.8% (6,718)
Zimbabwe South Bend:
2.7% (260)Indiana:
0.3% (1,036)
Honduras South Bend:
2.6% (251)Indiana:
1.6% (5,892)
China, excluding Hong Kong and Taiwan South Bend:
2.6% (246)Indiana:
5.3% (19,877)
India South Bend:
2.5% (242)Indiana:
8.5% (32,127)
Kenya South Bend:
2.3% (218)Indiana:
0.8% (2,987)
Philippines South Bend:
2.1% (207)Indiana:
3.1% (11,851)
Ecuador South Bend:
1.7% (164)Indiana:
0.2% (835)
Vietnam South Bend:
1.6% (157)Indiana:
1.8% (6,645)
Canada South Bend:
1.6% (155)Indiana:
2.1% (7,834)
Colombia South Bend:
1.6% (155)Indiana:
0.8% (3,114)
Korea South Bend:
1.6% (155)Indiana:
2.0% (7,653)
Place of birth for U.S.-born residents:
This state: 63,978Other state: 31,261Northeast: 2,219Midwest: 16,685South: 6,580West: 5,777 86.4% of South Bend residents lived in the same house 1 years ago.
Out of people who lived in different houses, 37.1% lived in this county.
Out of people who lived in different counties, 38.0% lived in Indiana.
South Bend:
86.4%State average:
87.1%
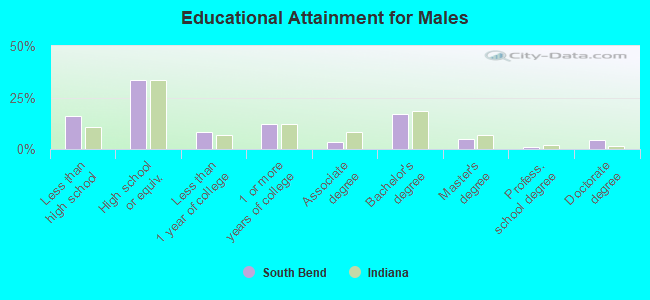
Education attainment for males 25 years and older:
No schooling: 746Nursery to 4th grade: 2255th and 6th grade: 2297th and 8th grade: 1529th grade: 36210th grade: 1,07711th grade: 91412th grade, no diploma: 1,440High school graduate (or equivalency): 10,766Less than 1 year of college: 2,592Some college more than 1 year, no degree: 3,825Associate degree: 1,113Bachelor's degree: 5,385Master's degree: 1,566Professional school degree: 294Doctorate degree: 1,390
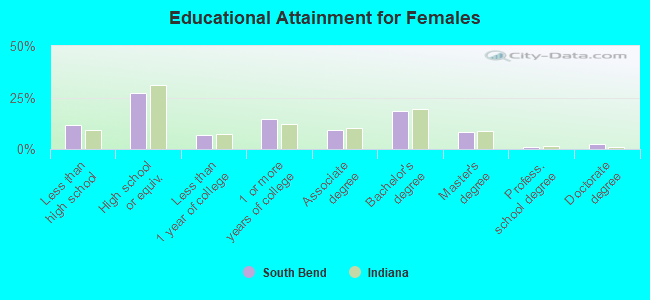
Education attainment for females 25 years and older:
No schooling: 704Nursery to 4th grade: 05th and 6th grade: 1567th and 8th grade: 6809th grade: 54810th grade: 32111th grade: 86912th grade, no diploma: 906High school graduate (or equivalency): 9,702Less than 1 year of college: 2,463Some college more than 1 year, no degree: 5,250Associate degree: 3,315Bachelor's degree: 6,516Master's degree: 2,841Professional school degree: 267Doctorate degree: 935
Housing units in structures:
One, detached: 34,410One, attached: 1,905Two: 1,0763 or 4: 2,1655 to 9: 2,58410 to 19: 1,52520 to 49: 2,33850 or more: 2,736Mobile homes: 179Housing units lacking complete plumbing facilities in 2022: 1.4%Housing units lacking complete kitchen facilities in 2022: 3.0%House/condo owner moved in on average 13 years ago
Renter moved in on average 2 years ago
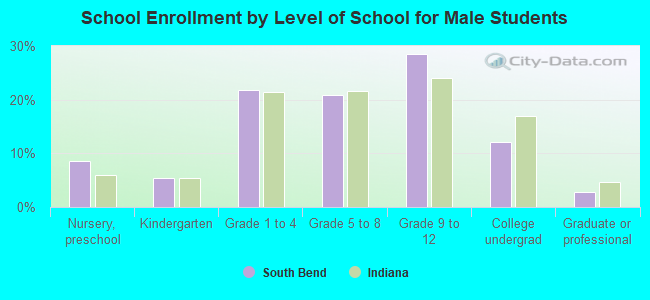
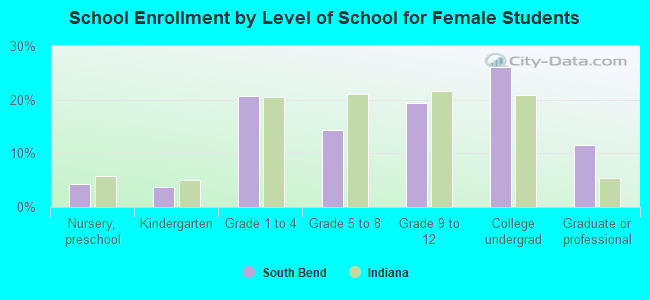
Private vs. public school enrollment:
Students in private schools in grades 1 to 8 (elementary and middle school): 2,410 Students in private schools in grades 9 to 12 (high school): 1,179 Students in private undergraduate colleges: 1,553