South Burlington, VT (Vermont) Houses and Residents
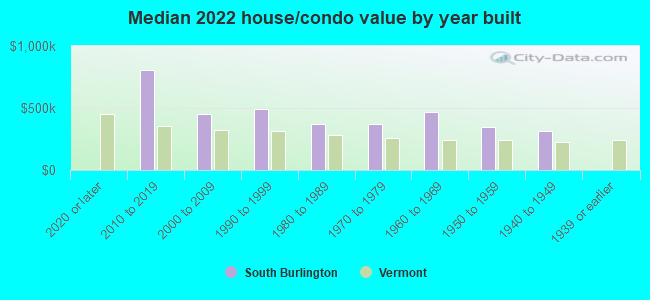
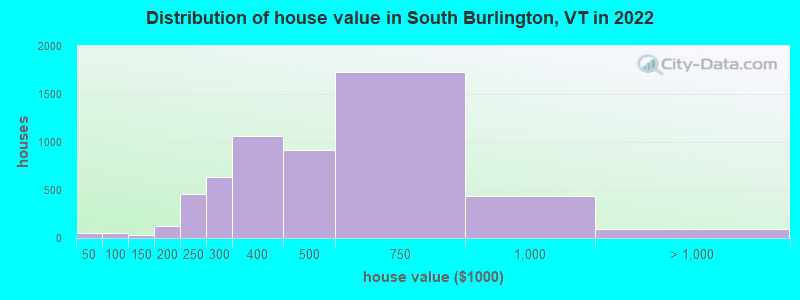
Estimated median house or condo value in 2022: $428,388 (it was $134,700 in 2000 )
South Burlington:
$428,388Vermont:
$304,700
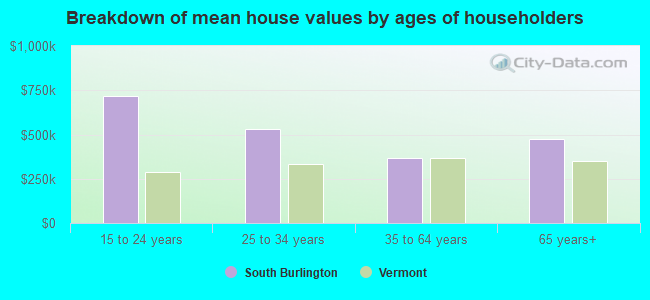
Lower value quartile - upper value quartile: $300,157 - $661,862Mean price in 2022: Detached houses: $540,459 Here:
$540,459State:
$378,260
Townhouses or other attached units: $382,405 Here:
$382,405State:
$360,670
In 2-unit structures: $389,912 Here:
$389,912State:
$304,383
In 3-to-4-unit structures: $500,524 Here:
$500,524State:
$746,315
In 5-or-more-unit structures: $233,278 Here:
$233,278State:
$259,595
Total population: 18,743 (Urban population: 15,035, Rural population: 779 (all nonfarm) )
Houses: 9,394 (8,987 occupied: 5,430 owner occupied, 3,705 renter occupied )
% of renters here:
41%State:
26%
Housing density: 564 houses/condos per square mile
Median price asked for vacant for-sale houses and condos in 2022 in this county: $706,355.
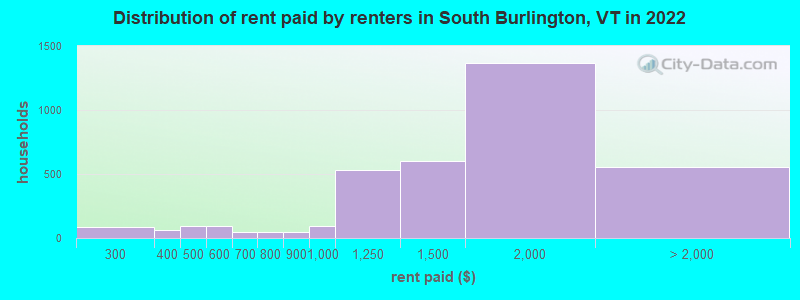
Median contract rent in 2022: $1,559 (lower quartile is $1,194, upper quartile is $1,879)
Median rent asked for vacant for-rent units in 2022: $4,030
Median gross rent in South Burlington, VT in 2022: $1,661
Housing units in South Burlington with a mortgage: 3,954 (368 second mortgage, 6 home equity loan, 356 both second mortgage and home equity loan )Houses without a mortgage: 197
Median household income for houses/condos with a mortgage: $133,146
Median household income for apartments without a mortgage: $94,012
Median monthly housing costs: $1,650
Data:
Median house or condo value ($)
Median house or condo value ($ change since 2000)
Median house or condo value ($) - White
Median house or condo value ($) - Black or African American
Median house or condo value ($) - Asian
Median house or condo value ($) - Hispanic or Latino
Median house or condo value ($) - American Indian and Alaska Native
Median house or condo value ($) - Multirace
Median house or condo value ($) - Other Race
Median price asked for mobile homes ($)
Household density (households per square mile)
Mean house or condo value by units in structure - 1, detached ($)
Mean house or condo value by units in structure - 1, attached ($)
Mean house or condo value by units in structure - 2 ($)
Mean house or condo value by units in structure by units in structure - 3 or 4 ($)
Mean house or condo value by units in structure - 5 or more ($)
Mean house or condo value by units in structure - Boat, RV, van, etc. ($)
Mean house or condo value by units in structure - Mobile home ($)
Median contract rent ($)
Median contract rent - Lower quartile ($)
Median contract rent - Upper quartile ($)
Median gross rent ($)
Urban houses (%)
Rural houses (%)
Houses occupied (%)
Houses occupied (% change since 2000)
Houses owner occupied (%)
Houses owner occupied (% change since 2000)
Houses renter occupied (%)
Houses renter occupied (% change since 2000)
Vacant housing units - For rent (%)
Vacant housing units - For rent (% change since 2000)
Vacant housing units - For sale only (%)
Vacant housing units - For sale only (% change since 2000)
Vacant housing units - Rented or sold, not occupied (%)
Vacant housing units - Rented or sold, not occupied (% change since 2000)
Vacant housing units - For seasonal, recreational, or occasional use (%)
Vacant housing units - For seasonal, recreational, or occasional use (% change since 2000)
Vacant housing units - For migrant workers (%)
Vacant housing units - For migrant workers (% change since 2000)
Vacant housing units - Other vacant (%)
Vacant housing units - Other vacant (% change since 2000)
Median monthly housing costs ($)
Median household income for houses/condos with a mortgage ($)
Median household income for houses/condos without a mortgage ($)
Median household income ($)
Median household income ($) - White
Median household income ($) - Black or African American
Median household income ($) - Asian
Median household income ($) - Hispanic or Latino
Median household income ($) - American Indian and Alaska Native
Median household income ($) - Multirace
Median household income ($) - Other Race
Mortgage status - with mortgage (%)
Mortgage status - with second mortgage (%)
Mortgage status - with home equity loan (%)
Mortgage status - with both second mortgage and home equity loan (%)
Mortgage status - without a mortgage (%)
Median year house/condo built
Median year apartment built
Household type by relationship - Male householder living alone (%)
Household type by relationship - Male householder not living alone (%)
Household type by relationship - Female householder living alone (%)
Household type by relationship - Female householder not living alone (%)
Household type by relationship - Opposite-Sex spouse (%)
Household type by relationship - Same-Sex spouse (%)
Household type by relationship - Opposite-Sex unmarried partner (%)
Household type by relationship - Same-Sex unmarried partner (%)
Household type by relationship - In group quarters (%)
Size of family households - 2-person household (%)
Size of family households - 3-person household (%)
Size of family households - 4-person household (%)
Size of family households - 5-person household (%)
Size of family households - 6-person household (%)
Size of family households - 7-or-more-person household (%)
Size of nonfamily households - 1-person household (%)
Size of nonfamily households - 2-person household (%)
Size of nonfamily households - 3-person household (%)
Size of nonfamily households - 4-person household (%)
Size of nonfamily households - 5-person household (%)
Size of nonfamily households - 6-person household (%)
Size of nonfamily households - 7-or-moreperson household (%)
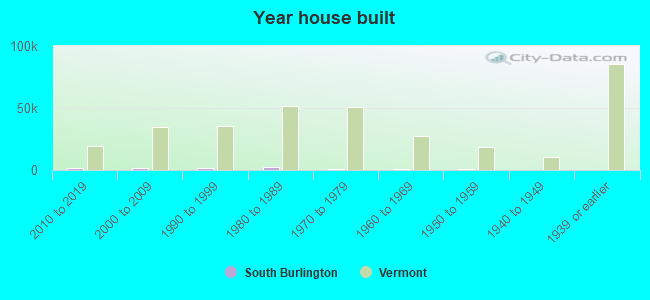
Year house built - Built 2010 or later (%)
Year house built - Built 2000 to 2009 (%)
Year house built - Built 1990 to 1999 (%)
Year house built - Built 1980 to 1989 (%)
Year house built - Built 1970 to 1979 (%)
Year house built - Built 1960 to 1969 (%)
Year house built - Built 1950 to 1959 (%)
Year house built - Built 1940 to 1949 (%)
Year house built - Built 1939 or earlier (%)
Median number of rooms in houses and condos
Median number of rooms in apartments
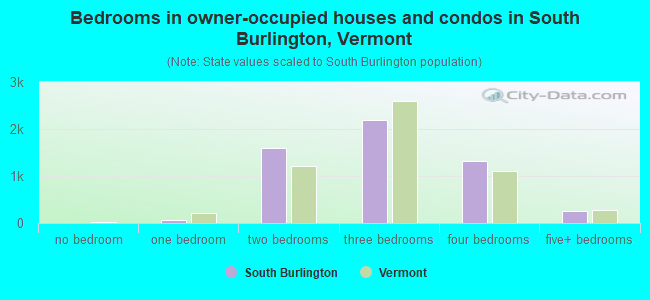
Median number of bedrooms in owner occupied houses
Mean number of bedrooms in owner occupied houses
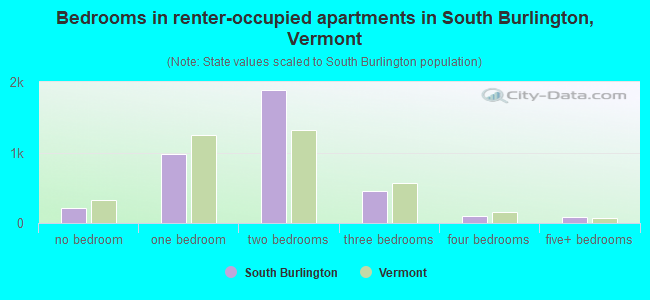
Median number of bedrooms in renter occupied houses
Mean number of bedrooms in renter occupied houses
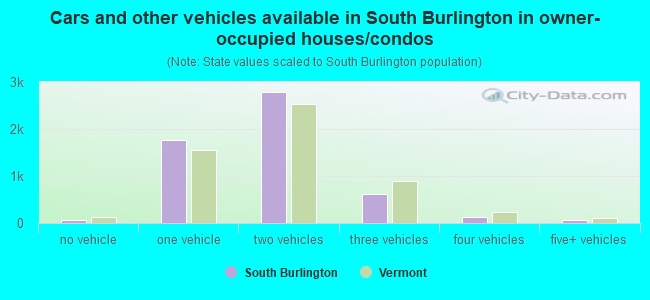
Median number of vehichles in owner occupied houses
Mean number of vehichles in owner occupied houses
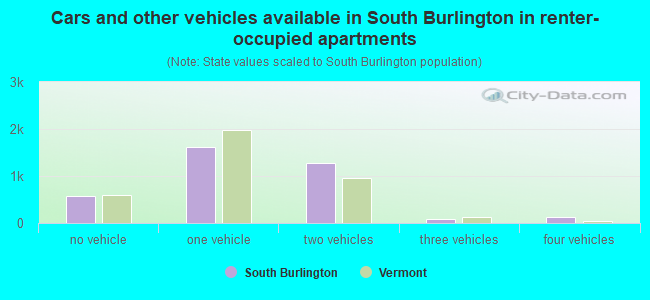
Median number of vehichles in renter occupied houses
Mean number of vehichles in renter occupied houses
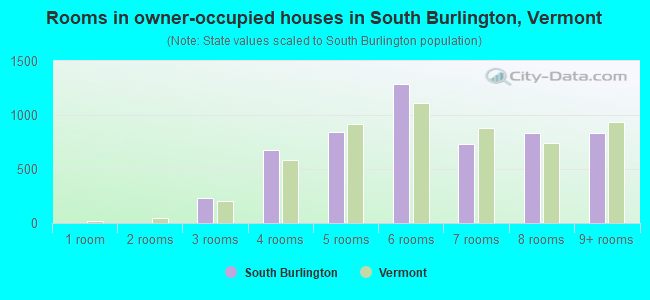
Rooms in owner-occupied houses - 1 room (%)
Rooms in owner-occupied houses - 2 rooms (%)
Rooms in owner-occupied houses - 3 rooms (%)
Rooms in owner-occupied houses - 4 rooms (%)
Rooms in owner-occupied houses - 5 rooms (%)
Rooms in owner-occupied houses - 6 rooms (%)
Rooms in owner-occupied houses - 7 rooms (%)
Rooms in owner-occupied houses - 8 rooms (%)
Rooms in owner-occupied houses - 9+ rooms (%)
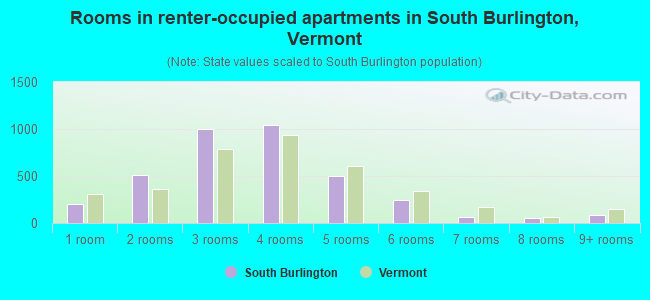
Rooms in renter-occupied houses - 1 room (%)
Rooms in renter-occupied houses - 2 rooms (%)
Rooms in renter-occupied houses - 3 rooms (%)
Rooms in renter-occupied houses - 4 rooms (%)
Rooms in renter-occupied houses - 5 rooms (%)
Rooms in renter-occupied houses - 6 rooms (%)
Rooms in renter-occupied houses - 7 rooms (%)
Rooms in renter-occupied houses - 8 rooms (%)
Rooms in renter-occupied houses - 9+ rooms (%)
Bedrooms in owner-occupied houses - no bedrooms (%)
Bedrooms in owner-occupied houses - 1 bedroom (%)
Bedrooms in owner-occupied houses - 2 bedrooms (%)
Bedrooms in owner-occupied houses - 3 bedrooms (%)
Bedrooms in owner-occupied houses - 4 bedrooms (%)
Bedrooms in owner-occupied houses - 5+ bedrooms (%)
Bedrooms in renter-occupied houses - no bedrooms (%)
Bedrooms in renter-occupied houses - 1 bedroom (%)
Bedrooms in renter-occupied houses - 2 bedrooms (%)
Bedrooms in renter-occupied houses - 3 bedrooms (%)
Bedrooms in renter-occupied houses - 4 bedrooms (%)
Bedrooms in renter-occupied houses - 5+ bedrooms (%)
Vehicles available in owner-occupied houses - no vehicle available (%)
Vehicles available in owner-occupied houses - 1 vehicle available(%)
Vehicles available in owner-occupied houses - 2 Vehicles available (%)
Vehicles available in owner-occupied houses - 3 Vehicles available (%)
Vehicles available in owner-occupied houses - 4 Vehicles available (%)
Vehicles available in owner-occupied houses - 5+ Vehicles available (%)
Vehicles available in renter-occupied houses - no vehicle available (%)
Vehicles available in renter-occupied houses - 1 vehicle available (%)
Vehicles available in renter-occupied houses - 2 Vehicles available (%)
Vehicles available in renter-occupied houses - 3 Vehicles available (%)
Vehicles available in renter-occupied houses - 4 Vehicles available (%)
Vehicles available in renter-occupied houses - 5+ Vehicles available (%)
Housing units in structures - 1, detached (%)
Housing units in structures - 1, attached (%)
Housing units in structures - 2 (%)
Housing units in structures - 3 or 4 (%)
Housing units in structures - 5 to 9 (%)
Housing units in structures - 10 to 19 (%)
Housing units in structures - 20 to 49 (%)
Housing units in structures - 50 or more (%)
Housing units in structures - Mobile home (%)
Housing units in structures - Boat, RV, van, etc. (%)
Housing units in structures - Owners - 1, detached (%)
Housing units in structures - Owners - 1, attached (%)
Housing units in structures - Owners - 2 (%)
Housing units in structures - Owners - 3 or 4 (%)
Housing units in structures - Owners - 5 to 9 (%)
Housing units in structures - Owners - 10 to 19 (%)
Housing units in structures - Owners - 20 to 49 (%)
Housing units in structures - Owners - 50 or more (%)
Housing units in structures - Owners - Mobile home (%)
Housing units in structures - Owners - Boat, RV, van, etc. (%)
Housing units in structures - Renters - 1, detached (%)
Housing units in structures - Renters - 1, attached (%)
Housing units in structures - Renters - 2 (%)
Housing units in structures - Renters - 3 or 4 (%)
Housing units in structures - Renters - 5 to 9 (%)
Housing units in structures - Renters - 10 to 19 (%)
Housing units in structures - Renters - 20 to 49 (%)
Housing units in structures - Renters - 50 or more (%)
Housing units in structures - Renters - Mobile home (%)
Housing units in structures - Renters - Boat, RV, van, etc. (%)
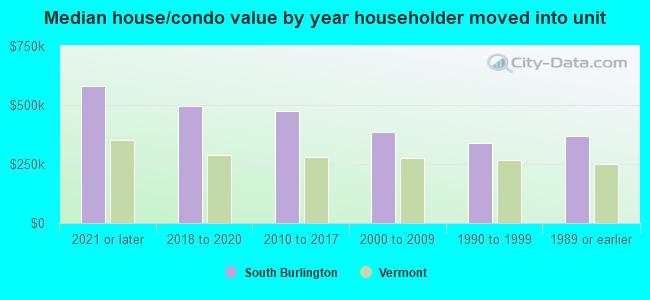
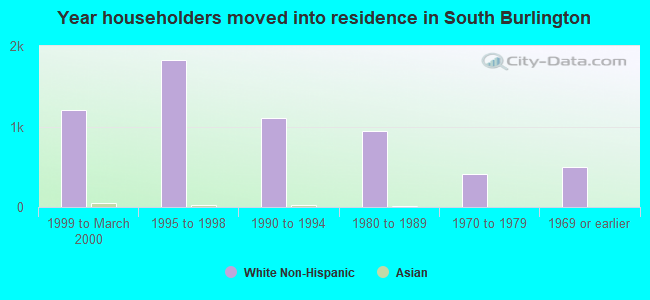
House/condo owner moved in on average (years ago)
Renter moved in on average (years ago)
Year householder moved into unit - Moved in 1999 to March 2000 (%)
Year householder moved into unit - Moved in 1999 to March 2000 (%) - White
Year householder moved into unit - Moved in 1999 to March 2000 (%) - Black or African American
Year householder moved into unit - Moved in 1999 to March 2000 (%) - Asian
Year householder moved into unit - Moved in 1999 to March 2000 (%) - Hispanic or Latino
Year householder moved into unit - Moved in 1999 to March 2000 (%) - American Indian and Alaska Native
Year householder moved into unit - Moved in 1999 to March 2000 (%) - Multirace
Year householder moved into unit - Moved in 1999 to March 2000 (%) - Other Race
Year householder moved into unit - Moved in 1995 to 1998 (%)
Year householder moved into unit - Moved in 1995 to 1998 (%) - White
Year householder moved into unit - Moved in 1995 to 1998 (%) - Black or African American
Year householder moved into unit - Moved in 1995 to 1998 (%) - Asian
Year householder moved into unit - Moved in 1995 to 1998 (%) - Hispanic or Latino
Year householder moved into unit - Moved in 1995 to 1998 (%) - American Indian and Alaska Native
Year householder moved into unit - Moved in 1995 to 1998 (%) - Multirace
Year householder moved into unit - Moved in 1995 to 1998 (%) - Other Race
Year householder moved into unit - Moved in 1990 to 1994 (%)
Year householder moved into unit - Moved in 1990 to 1994 (%) - White
Year householder moved into unit - Moved in 1990 to 1994 (%) - Black or African American
Year householder moved into unit - Moved in 1990 to 1994 (%) - Asian
Year householder moved into unit - Moved in 1990 to 1994 (%) - Hispanic or Latino
Year householder moved into unit - Moved in 1990 to 1994 (%) - American Indian and Alaska Native
Year householder moved into unit - Moved in 1990 to 1994 (%) - Multirace
Year householder moved into unit - Moved in 1990 to 1994 (%) - Other Race
Year householder moved into unit - Moved in 1980 to 1989 (%)
Year householder moved into unit - Moved in 1980 to 1989 (%) - White
Year householder moved into unit - Moved in 1980 to 1989 (%) - Black or African American
Year householder moved into unit - Moved in 1980 to 1989 (%) - Asian
Year householder moved into unit - Moved in 1980 to 1989 (%) - Hispanic or Latino
Year householder moved into unit - Moved in 1980 to 1989 (%) - American Indian and Alaska Native
Year householder moved into unit - Moved in 1980 to 1989 (%) - Multirace
Year householder moved into unit - Moved in 1980 to 1989 (%) - Other Race
Year householder moved into unit - Moved in 1970 to 1979 (%)
Year householder moved into unit - Moved in 1970 to 1979 (%) - White
Year householder moved into unit - Moved in 1970 to 1979 (%) - Black or African American
Year householder moved into unit - Moved in 1970 to 1979 (%) - Asian
Year householder moved into unit - Moved in 1970 to 1979 (%) - Hispanic or Latino
Year householder moved into unit - Moved in 1970 to 1979 (%) - American Indian and Alaska Native
Year householder moved into unit - Moved in 1970 to 1979 (%) - Multirace
Year householder moved into unit - Moved in 1970 to 1979 (%) - Other Race
Year householder moved into unit - Moved in 1969 or earlier (%)
Year householder moved into unit - Moved in 1969 or earlier (%) - White
Year householder moved into unit - Moved in 1969 or earlier (%) - Black or African American
Year householder moved into unit - Moved in 1969 or earlier (%) - Asian
Year householder moved into unit - Moved in 1969 or earlier (%) - Hispanic or Latino
Year householder moved into unit - Moved in 1969 or earlier (%) - American Indian and Alaska Native
Year householder moved into unit - Moved in 1969 or earlier (%) - Multirace
Year householder moved into unit - Moved in 1969 or earlier (%) - Other Race
Housing units lacking complete plumbing facilities (%)
Housing units lacking complete kitchen facilities (%)
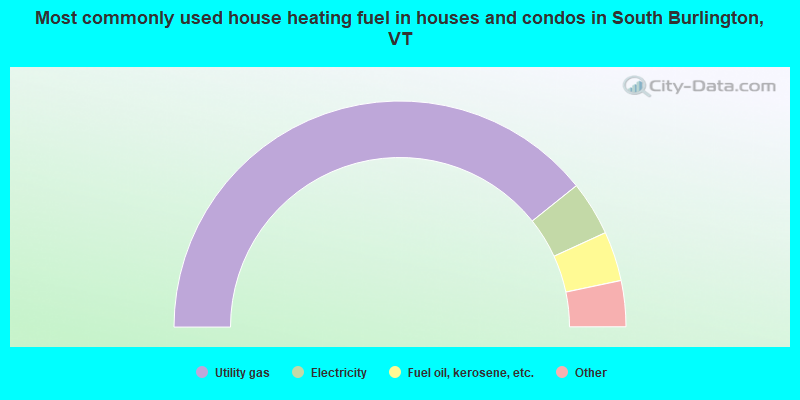
House heating fuel used in houses and condos - Utility gas (%)
House heating fuel used in houses and condos - Bottled, tank, or LP gas (%)
House heating fuel used in houses and condos - Electricity (%)
House heating fuel used in houses and condos - Fuel oil, kerosene, etc. (%)
House heating fuel used in houses and condos - Coal or coke (%)
House heating fuel used in houses and condos - Wood (%)
House heating fuel used in houses and condos - Solar energy (%)
House heating fuel used in houses and condos - Other fuel (%)
House heating fuel used in houses and condos - No fuel used (%)
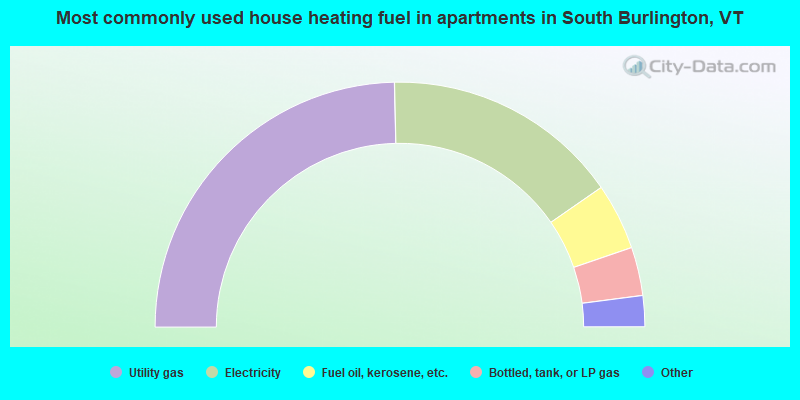
House heating fuel used in apartments - Utility gas (%)
House heating fuel used in apartments - Bottled, tank, or LP gas (%)
House heating fuel used in apartments - Electricity (%)
House heating fuel used in apartments - Fuel oil, kerosene, etc. (%)
House heating fuel used in apartments - Coal or coke (%)
House heating fuel used in apartments - Wood (%)
House heating fuel used in apartments - Solar energy (%)
House heating fuel used in apartments - Other fuel (%)
House heating fuel used in apartments - No fuel used (%)
Median year house/condo built: 1986Median year apartment built: 1995Household type by relationship:
Households: 20,360
Male householders: 3,824 (1,030 living alone ), Female householders: 5,010 (1,557 living alone )3,851 spouses (3,700 opposite-sex spouses ), 1,044 unmarried partners , (886 opposite-sex unmarried partners ), 4,719 children (4,565 natural , 49 adopted , 104 stepchildren ), 34 grandchildren , 112 brothers or sisters , 75 parents , 0 foster children , 147 other relatives , 1,196 non-relatives In group quarters: 344
Size of family households: 2,409 2-persons , 1,171 3-persons , 887 4-persons , 387 5-persons , 54 6-persons , 42 7-or-more-persons .
Size of nonfamily households: 2,706 1-person , 1,253 2-persons , 70 3-persons , 172 4-persons , 72 6-persons .
2,677 married couples with children. single-parent households (469 men , 571 women ).
85.7% of residents of South Burlington speak English at home. of residents speak Spanish at home (86% speak English very well , 13% speak English well , 1% don't speak English at all ).of residents speak other Indo-European language at home (78% speak English very well , 12% speak English well , 10% speak English not well ).of residents speak Asian or Pacific Island language at home (53% speak English very well , 31% speak English well , 15% speak English not well , 1% don't speak English at all ).of residents speak other language at home (92% speak English very well , 8% speak English well ).
Foreign born population: 2,454 (12.1%)of them are naturalized citizens )
Median number of rooms in houses and condos:
Median number of rooms in apartments
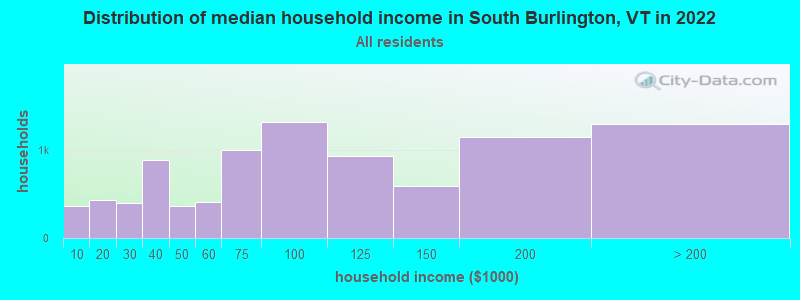
South Burlington, VT household income distribution 358 Less than $10,000432 $10,000 to $19,999396 $20,000 to $29,999885 $30,000 to $39,999363 $40,000 to $49,999410 $50,000 to $59,999995 $60,000 to $74,9991,318 $75,000 to $99,999928 $100,000 to $124,999594 $125,000 to $149,9991,142 $150,000 to $199,9991,291 $200,000 or more
Home value of owner - occupied houses in 2022 in South Burlington, VT 18 Less than $10,00034 $15,000 to $19,99953 $80,000 to $89,99926 $100,000 to $124,9995 $125,000 to $149,99950 $150,000 to $174,99976 $175,000 to $199,999455 $200,000 to $249,999634 $250,000 to $299,9991,060 $300,000 to $399,999919 $400,000 to $499,9991,726 $500,000 to $749,999437 $750,000 to $999,99965 $1,000,000 to $1,499,99931 $2,000,000 or moreRent paid by renters in 2022 in South Burlington, VT 46 $200 to $24939 $250 to $29953 $300 to $34913 $350 to $39967 $400 to $44923 $450 to $49992 $500 to $54944 $650 to $69926 $700 to $74916 $750 to $79944 $800 to $89993 $900 to $999528 $1,000 to $1,249603 $1,250 to $1,4991,371 $1,500 to $1,999301 $2,000 to $2,49960 $2,500 to $2,999145 $3,000 to $3,49915 $3,500 or more29 No cash rent
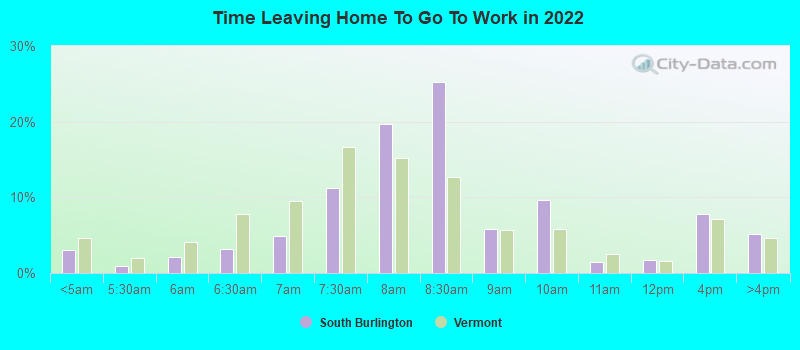
Percentage of workers working in this county: 94.9%Number of people working at home: 2,126 (17.3% of all workers )
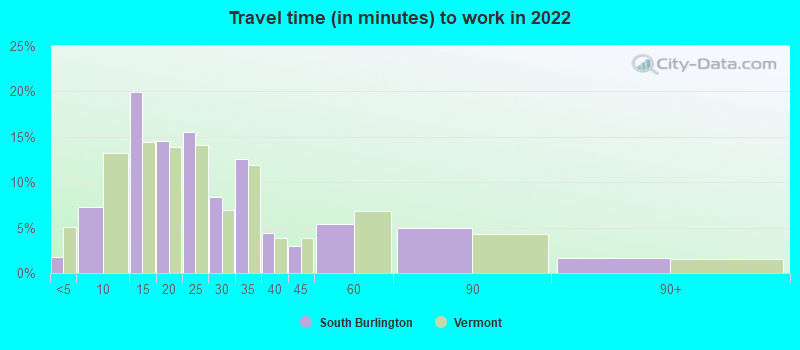
Travel time to work (commute)
Less than 5 minutes: 3925 to 9 minutes: 1,29410 to 14 minutes: 3,58615 to 19 minutes: 2,15720 to 24 minutes: 1,00525 to 29 minutes: 37430 to 34 minutes: 29035 to 39 minutes: 11940 to 44 minutes: 23645 to 59 minutes: 32660 to 89 minutes: 26590 or more minutes: 95
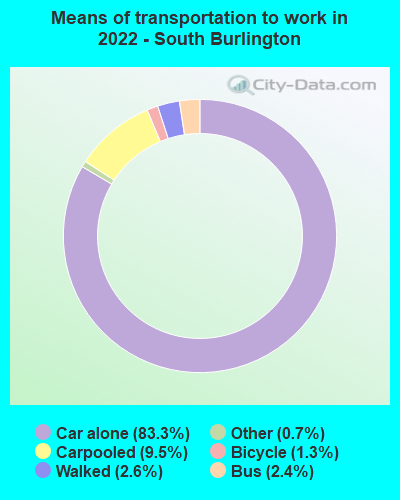
Means of transportation to work:
Drove a car alone: 13,864 (74.6%)Carpooled: 1,534 (8.3%)Bus : 217 (1.2%)Subway or elevated rail : 23 (0.1%)Taxi: 67 (0.4%)Bicycle: 178 (1.0%)Walked: 477 (2.6%)Worked at home: 2,126 (11.4%)
Unemployment by race in 2022
Unemployment rate for White non-Hispanic residents 4.0% Males3.9% FemalesUnemployment rate for Black residents 8.5% Males15.0% FemalesUnemployment rate for Asian residents 2.0% Males6.3% FemalesUnemployment rate for other race residents 31.9% MalesUnemployment rate for two or more race residents 12.2% Males1.0% FemalesUnemployment rate for Hispanic or Latino residents 4.5% Females
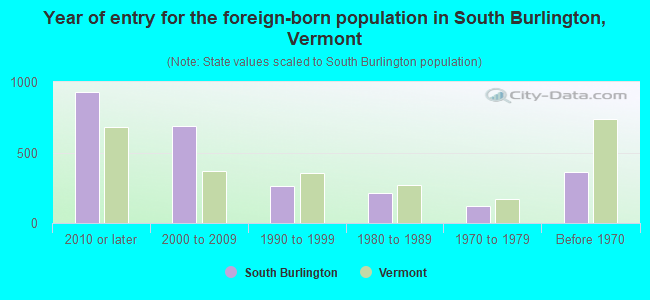
Year of entry for the foreign-born population in South Burlington, Vermont
932 2010 or later 691 2000 to 2009 260 1990 to 1999 214 1980 to 1989 122 1970 to 1979 359 Before 1970
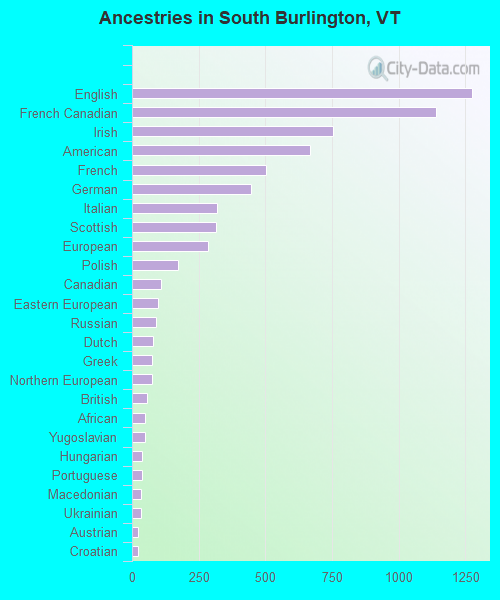
First ancestries reported:
English: 1,275 (13.8%)
French Canadian: 1,140 (12.3%)
Irish: 752 (8.1%)
American: 666 (7.2%)
French: 502 (5.4%)
German: 447 (4.8%)
Italian: 320 (3.5%)
Scottish: 314 (3.4%)
European: 284 (3.1%)
Polish: 172 (1.9%)
Canadian: 109 (1.2%)
Eastern European: 98 (1.1%)
Russian: 91 (1.0%)
Dutch: 77 (0.8%)
Greek: 76 (0.8%)
Northern European: 74 (0.8%)
British: 57 (0.6%)
African: 50 (0.5%)
Yugoslavian: 48 (0.5%)
Hungarian: 36 (0.4%)
Portuguese: 36 (0.4%)
Macedonian: 34 (0.4%)
Ukrainian: 34 (0.4%)
Austrian: 22 (0.2%)
Croatian: 21 (0.2%)
Finnish: 19 (0.2%)
Slovak: 19 (0.2%)
Nigerian: 19 (0.2%)
Romanian: 18 (0.2%)
Slovene: 18 (0.2%)
Swedish: 17 (0.2%)
Czech: 14 (0.2%)
Ghanaian: 11 (0.1%)
Jamaican: 11 (0.1%)
Welsh: 10 (0.1%)
Haitian: 10 (0.1%)
Lebanese: 8 (0.09%)
Danish: 7 (0.08%) Most common places of birth for foreign-born residents (%): India South Burlington:
12.6% (335)Vermont:
3.9% (1,087)
Canada South Burlington:
12.5% (333)Vermont:
18.5% (5,219)
China, excluding Hong Kong and Taiwan South Burlington:
10.6% (283)Vermont:
6.0% (1,706)
Burma (Myanmar) South Burlington:
8.7% (231)Vermont:
1.4% (382)
Nepal South Burlington:
8.1% (215)Vermont:
3.2% (902)
England South Burlington:
4.6% (122)Vermont:
3.1% (886)
Taiwan South Burlington:
3.6% (97)Vermont:
0.7% (199)
Democratic Republic of Congo (Zaire) South Burlington:
3.3% (89)Vermont:
1.2% (333)
Philippines South Burlington:
3.1% (83)Vermont:
3.1% (881)
Ghana South Burlington:
2.6% (69)Vermont:
1.0% (269)
Korea South Burlington:
2.3% (62)Vermont:
2.6% (740)
Peru South Burlington:
2.3% (61)Vermont:
0.7% (197)
Other Eastern Africa South Burlington:
2.2% (60)Vermont:
0.3% (94)
Russia South Burlington:
2.1% (55)Vermont:
1.9% (548)
Bosnia and Herzegovina South Burlington:
1.8% (48)Vermont:
3.1% (866)
United Kingdom, excluding England and Scotland South Burlington:
1.7% (46)Vermont:
3.5% (981)
Place of birth for U.S.-born residents:
This state: 7,514Other state: 10,120Northeast: 6,751Midwest: 1,165South: 1,410West: 729 84.7% of South Burlington residents lived in the same house 1 years ago.
Out of people who lived in different houses, 34.0% lived in this county.
Out of people who lived in different counties, 14.4% lived in Vermont.
South Burlington:
84.7%State average:
88.2%
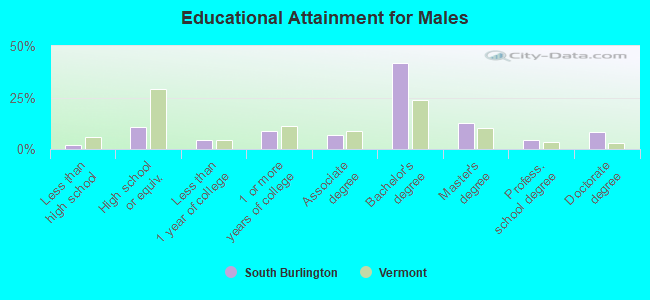
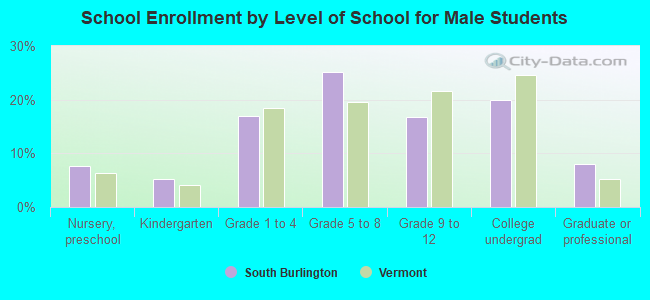
Education attainment for males 25 years and older:
No schooling: 73Nursery to 4th grade: 05th and 6th grade: 07th and 8th grade: 139th grade: 1210th grade: 011th grade: 012th grade, no diploma: 38High school graduate (or equivalency): 760Less than 1 year of college: 324Some college more than 1 year, no degree: 638Associate degree: 488Bachelor's degree: 3,015Master's degree: 911Professional school degree: 330Doctorate degree: 580
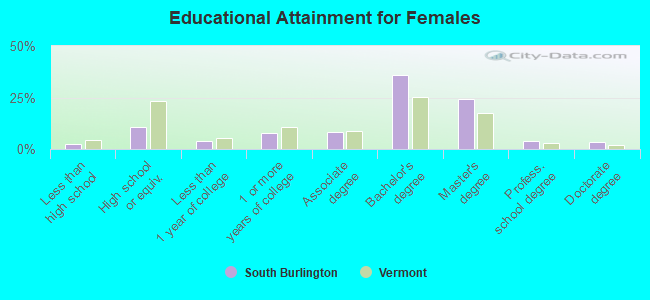
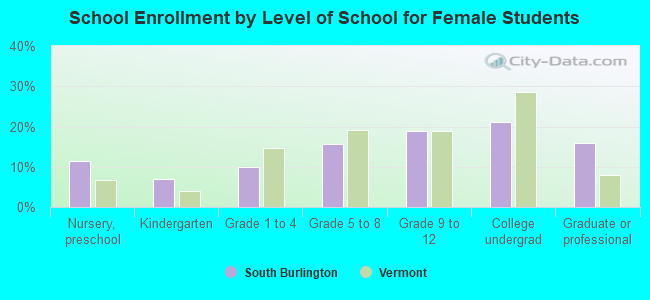
Education attainment for females 25 years and older:
No schooling: 0Nursery to 4th grade: 05th and 6th grade: 07th and 8th grade: 319th grade: 710th grade: 1511th grade: 5112th grade, no diploma: 68High school graduate (or equivalency): 846Less than 1 year of college: 299Some college more than 1 year, no degree: 613Associate degree: 625Bachelor's degree: 2,808Master's degree: 1,874Professional school degree: 302Doctorate degree: 249
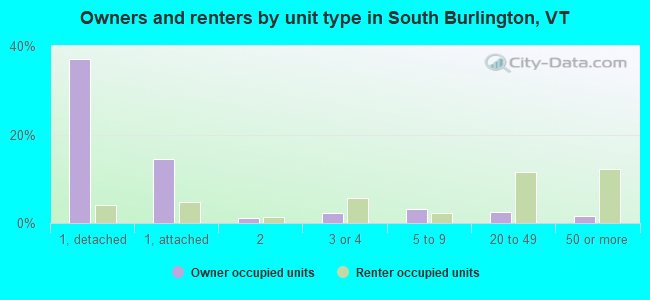
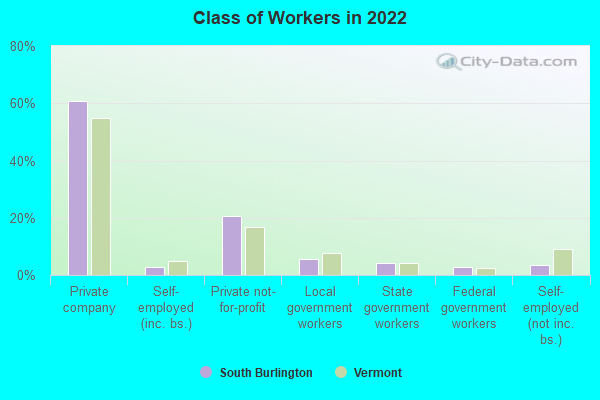
Housing units in structures:
One, detached: 3,807One, attached: 1,659Two: 2683 or 4: 8365 to 9: 57410 to 19: 15120 to 49: 1,07550 or more: 1,022Housing units lacking complete kitchen facilities in 2022: 0.6%House/condo owner moved in on average 8 years ago
Renter moved in on average 3 years ago
Private vs. public school enrollment:
Students in private schools in grades 1 to 8 (elementary and middle school): 87 Students in private schools in grades 9 to 12 (high school): 11 Students in private undergraduate colleges: 172