South Charleston, WV (West Virginia) Houses and Residents
Estimated median house or condo value in 2022: $151,508 (it was $83,600 in 2000 )
South Charleston:
$151,508West Virginia:
$155,100
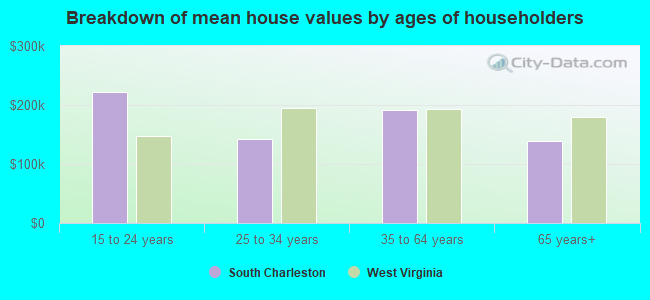
Lower value quartile - upper value quartile: $92,530 - $216,037Mean price in 2022: Detached houses: $271,739 Here:
$271,739State:
$206,655
Townhouses or other attached units: $292,075 Here:
$292,075State:
$205,683
In 2-unit structures: $109,177 Here:
$109,177State:
$127,101
In 3-to-4-unit structures: $97,268 Here:
$97,268State:
$136,692
In 5-or-more-unit structures: $89,613 Here:
$89,613State:
$177,533
Mobile homes: $18,778 Here:
$18,778State:
$63,963
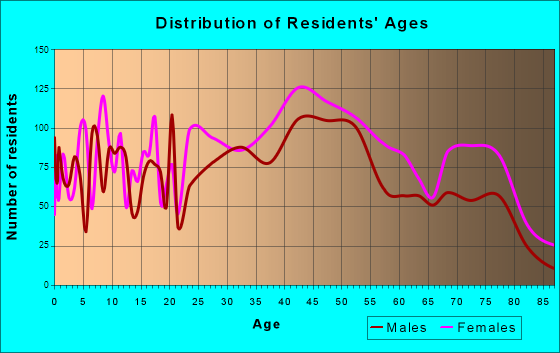
Total population: 13,214 (All urban)
Houses: 6,502 (6,012 occupied: 4,252 owner occupied, 1,843 renter occupied )
% of renters here:
30%State:
26%
Housing density: 875 houses/condos per square mile
Median price asked for vacant for-sale houses and condos in 2022: $84,697.
Median contract rent in 2022: $619 (lower quartile is $445, upper quartile is $727)
Median rent asked for vacant for-rent units in 2022: $778
Median gross rent in South Charleston, WV in 2022: $802
Housing units in South Charleston with a mortgage: 2,205 (155 second mortgage, 53 home equity loan, 115 both second mortgage and home equity loan )Houses without a mortgage: 19
Median household income for houses/condos with a mortgage: $90,986
Median household income for apartments without a mortgage: $50,291
Median monthly housing costs: $781
Data:
Median house or condo value ($)
Median house or condo value ($ change since 2000)
Median house or condo value ($) - White
Median house or condo value ($) - Black or African American
Median house or condo value ($) - Asian
Median house or condo value ($) - Hispanic or Latino
Median house or condo value ($) - American Indian and Alaska Native
Median house or condo value ($) - Multirace
Median house or condo value ($) - Other Race
Median price asked for mobile homes ($)
Household density (households per square mile)
Mean house or condo value by units in structure - 1, detached ($)
Mean house or condo value by units in structure - 1, attached ($)
Mean house or condo value by units in structure - 2 ($)
Mean house or condo value by units in structure by units in structure - 3 or 4 ($)
Mean house or condo value by units in structure - 5 or more ($)
Mean house or condo value by units in structure - Boat, RV, van, etc. ($)
Mean house or condo value by units in structure - Mobile home ($)
Median contract rent ($)
Median contract rent - Lower quartile ($)
Median contract rent - Upper quartile ($)
Median gross rent ($)
Urban houses (%)
Rural houses (%)
Houses occupied (%)
Houses occupied (% change since 2000)
Houses owner occupied (%)
Houses owner occupied (% change since 2000)
Houses renter occupied (%)
Houses renter occupied (% change since 2000)
Vacant housing units - For rent (%)
Vacant housing units - For rent (% change since 2000)
Vacant housing units - For sale only (%)
Vacant housing units - For sale only (% change since 2000)
Vacant housing units - Rented or sold, not occupied (%)
Vacant housing units - Rented or sold, not occupied (% change since 2000)
Vacant housing units - For seasonal, recreational, or occasional use (%)
Vacant housing units - For seasonal, recreational, or occasional use (% change since 2000)
Vacant housing units - For migrant workers (%)
Vacant housing units - For migrant workers (% change since 2000)
Vacant housing units - Other vacant (%)
Vacant housing units - Other vacant (% change since 2000)
Median monthly housing costs ($)
Median household income for houses/condos with a mortgage ($)
Median household income for houses/condos without a mortgage ($)
Median household income ($)
Median household income ($) - White
Median household income ($) - Black or African American
Median household income ($) - Asian
Median household income ($) - Hispanic or Latino
Median household income ($) - American Indian and Alaska Native
Median household income ($) - Multirace
Median household income ($) - Other Race
Mortgage status - with mortgage (%)
Mortgage status - with second mortgage (%)
Mortgage status - with home equity loan (%)
Mortgage status - with both second mortgage and home equity loan (%)
Mortgage status - without a mortgage (%)
Median year house/condo built
Median year apartment built
Household type by relationship - Male householder living alone (%)
Household type by relationship - Male householder not living alone (%)
Household type by relationship - Female householder living alone (%)
Household type by relationship - Female householder not living alone (%)
Household type by relationship - Opposite-Sex spouse (%)
Household type by relationship - Same-Sex spouse (%)
Household type by relationship - Opposite-Sex unmarried partner (%)
Household type by relationship - Same-Sex unmarried partner (%)
Household type by relationship - In group quarters (%)
Size of family households - 2-person household (%)
Size of family households - 3-person household (%)
Size of family households - 4-person household (%)
Size of family households - 5-person household (%)
Size of family households - 6-person household (%)
Size of family households - 7-or-more-person household (%)
Size of nonfamily households - 1-person household (%)
Size of nonfamily households - 2-person household (%)
Size of nonfamily households - 3-person household (%)
Size of nonfamily households - 4-person household (%)
Size of nonfamily households - 5-person household (%)
Size of nonfamily households - 6-person household (%)
Size of nonfamily households - 7-or-moreperson household (%)
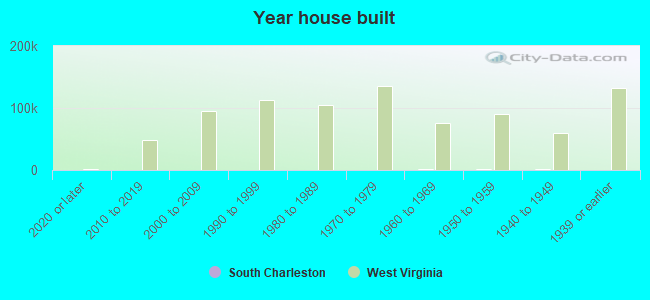
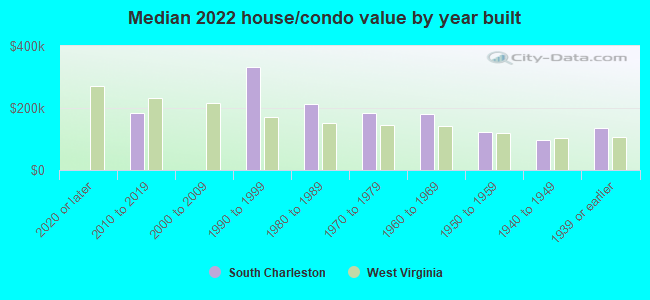
Year house built - Built 2010 or later (%)
Year house built - Built 2000 to 2009 (%)
Year house built - Built 1990 to 1999 (%)
Year house built - Built 1980 to 1989 (%)
Year house built - Built 1970 to 1979 (%)
Year house built - Built 1960 to 1969 (%)
Year house built - Built 1950 to 1959 (%)
Year house built - Built 1940 to 1949 (%)
Year house built - Built 1939 or earlier (%)
Median number of rooms in houses and condos
Median number of rooms in apartments
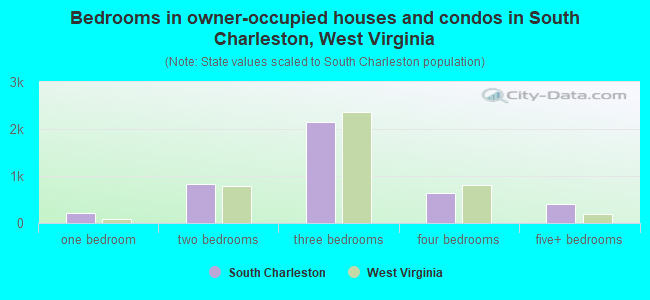
Median number of bedrooms in owner occupied houses
Mean number of bedrooms in owner occupied houses
Median number of bedrooms in renter occupied houses
Mean number of bedrooms in renter occupied houses
Median number of vehichles in owner occupied houses
Mean number of vehichles in owner occupied houses
Median number of vehichles in renter occupied houses
Mean number of vehichles in renter occupied houses
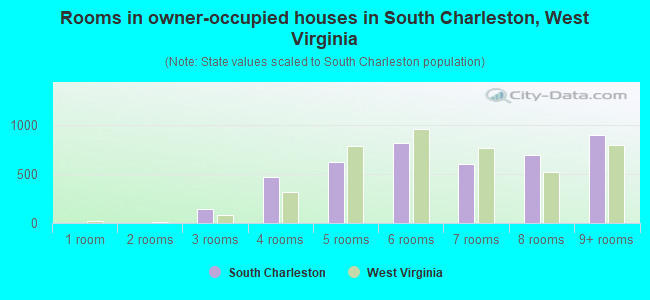
Rooms in owner-occupied houses - 1 room (%)
Rooms in owner-occupied houses - 2 rooms (%)
Rooms in owner-occupied houses - 3 rooms (%)
Rooms in owner-occupied houses - 4 rooms (%)
Rooms in owner-occupied houses - 5 rooms (%)
Rooms in owner-occupied houses - 6 rooms (%)
Rooms in owner-occupied houses - 7 rooms (%)
Rooms in owner-occupied houses - 8 rooms (%)
Rooms in owner-occupied houses - 9+ rooms (%)
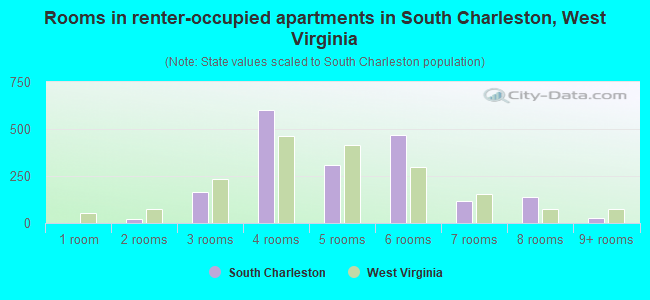
Rooms in renter-occupied houses - 1 room (%)
Rooms in renter-occupied houses - 2 rooms (%)
Rooms in renter-occupied houses - 3 rooms (%)
Rooms in renter-occupied houses - 4 rooms (%)
Rooms in renter-occupied houses - 5 rooms (%)
Rooms in renter-occupied houses - 6 rooms (%)
Rooms in renter-occupied houses - 7 rooms (%)
Rooms in renter-occupied houses - 8 rooms (%)
Rooms in renter-occupied houses - 9+ rooms (%)
Bedrooms in owner-occupied houses - no bedrooms (%)
Bedrooms in owner-occupied houses - 1 bedroom (%)
Bedrooms in owner-occupied houses - 2 bedrooms (%)
Bedrooms in owner-occupied houses - 3 bedrooms (%)
Bedrooms in owner-occupied houses - 4 bedrooms (%)
Bedrooms in owner-occupied houses - 5+ bedrooms (%)
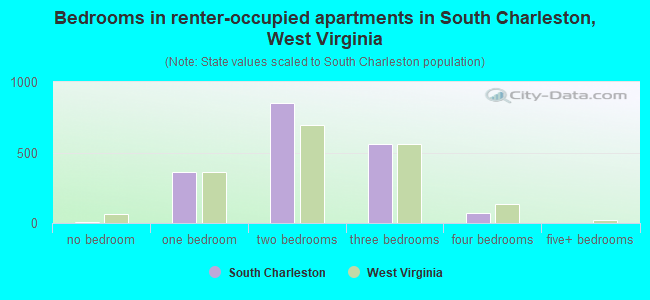
Bedrooms in renter-occupied houses - no bedrooms (%)
Bedrooms in renter-occupied houses - 1 bedroom (%)
Bedrooms in renter-occupied houses - 2 bedrooms (%)
Bedrooms in renter-occupied houses - 3 bedrooms (%)
Bedrooms in renter-occupied houses - 4 bedrooms (%)
Bedrooms in renter-occupied houses - 5+ bedrooms (%)
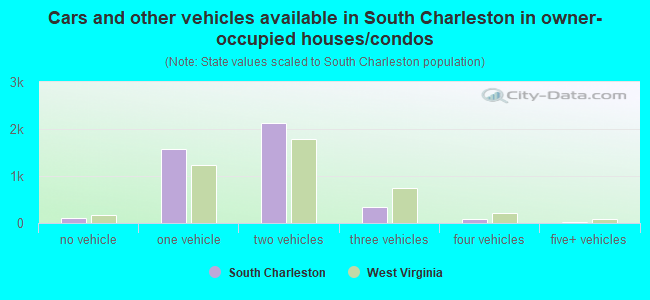
Vehicles available in owner-occupied houses - no vehicle available (%)
Vehicles available in owner-occupied houses - 1 vehicle available(%)
Vehicles available in owner-occupied houses - 2 Vehicles available (%)
Vehicles available in owner-occupied houses - 3 Vehicles available (%)
Vehicles available in owner-occupied houses - 4 Vehicles available (%)
Vehicles available in owner-occupied houses - 5+ Vehicles available (%)
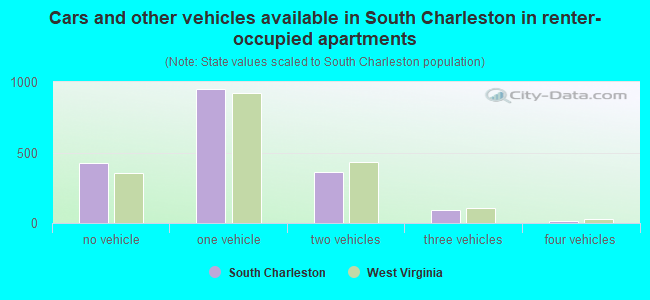
Vehicles available in renter-occupied houses - no vehicle available (%)
Vehicles available in renter-occupied houses - 1 vehicle available (%)
Vehicles available in renter-occupied houses - 2 Vehicles available (%)
Vehicles available in renter-occupied houses - 3 Vehicles available (%)
Vehicles available in renter-occupied houses - 4 Vehicles available (%)
Vehicles available in renter-occupied houses - 5+ Vehicles available (%)
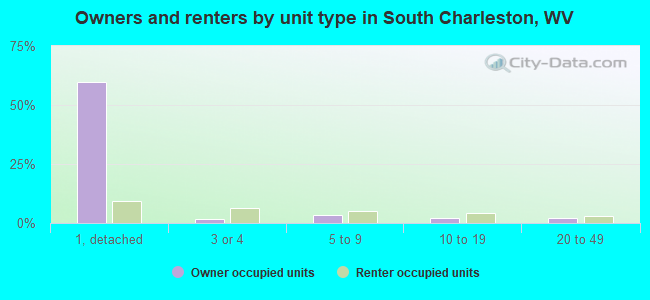
Housing units in structures - 1, detached (%)
Housing units in structures - 1, attached (%)
Housing units in structures - 2 (%)
Housing units in structures - 3 or 4 (%)
Housing units in structures - 5 to 9 (%)
Housing units in structures - 10 to 19 (%)
Housing units in structures - 20 to 49 (%)
Housing units in structures - 50 or more (%)
Housing units in structures - Mobile home (%)
Housing units in structures - Boat, RV, van, etc. (%)
Housing units in structures - Owners - 1, detached (%)
Housing units in structures - Owners - 1, attached (%)
Housing units in structures - Owners - 2 (%)
Housing units in structures - Owners - 3 or 4 (%)
Housing units in structures - Owners - 5 to 9 (%)
Housing units in structures - Owners - 10 to 19 (%)
Housing units in structures - Owners - 20 to 49 (%)
Housing units in structures - Owners - 50 or more (%)
Housing units in structures - Owners - Mobile home (%)
Housing units in structures - Owners - Boat, RV, van, etc. (%)
Housing units in structures - Renters - 1, detached (%)
Housing units in structures - Renters - 1, attached (%)
Housing units in structures - Renters - 2 (%)
Housing units in structures - Renters - 3 or 4 (%)
Housing units in structures - Renters - 5 to 9 (%)
Housing units in structures - Renters - 10 to 19 (%)
Housing units in structures - Renters - 20 to 49 (%)
Housing units in structures - Renters - 50 or more (%)
Housing units in structures - Renters - Mobile home (%)
Housing units in structures - Renters - Boat, RV, van, etc. (%)
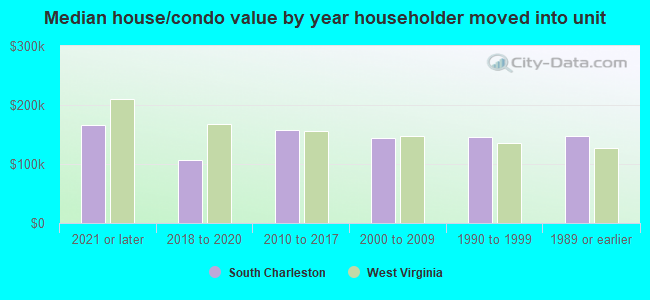
House/condo owner moved in on average (years ago)
Renter moved in on average (years ago)
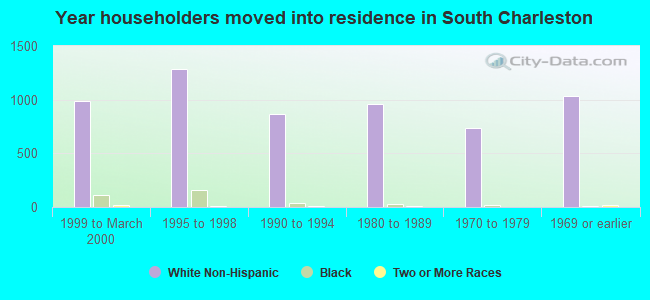
Year householder moved into unit - Moved in 1999 to March 2000 (%)
Year householder moved into unit - Moved in 1999 to March 2000 (%) - White
Year householder moved into unit - Moved in 1999 to March 2000 (%) - Black or African American
Year householder moved into unit - Moved in 1999 to March 2000 (%) - Asian
Year householder moved into unit - Moved in 1999 to March 2000 (%) - Hispanic or Latino
Year householder moved into unit - Moved in 1999 to March 2000 (%) - American Indian and Alaska Native
Year householder moved into unit - Moved in 1999 to March 2000 (%) - Multirace
Year householder moved into unit - Moved in 1999 to March 2000 (%) - Other Race
Year householder moved into unit - Moved in 1995 to 1998 (%)
Year householder moved into unit - Moved in 1995 to 1998 (%) - White
Year householder moved into unit - Moved in 1995 to 1998 (%) - Black or African American
Year householder moved into unit - Moved in 1995 to 1998 (%) - Asian
Year householder moved into unit - Moved in 1995 to 1998 (%) - Hispanic or Latino
Year householder moved into unit - Moved in 1995 to 1998 (%) - American Indian and Alaska Native
Year householder moved into unit - Moved in 1995 to 1998 (%) - Multirace
Year householder moved into unit - Moved in 1995 to 1998 (%) - Other Race
Year householder moved into unit - Moved in 1990 to 1994 (%)
Year householder moved into unit - Moved in 1990 to 1994 (%) - White
Year householder moved into unit - Moved in 1990 to 1994 (%) - Black or African American
Year householder moved into unit - Moved in 1990 to 1994 (%) - Asian
Year householder moved into unit - Moved in 1990 to 1994 (%) - Hispanic or Latino
Year householder moved into unit - Moved in 1990 to 1994 (%) - American Indian and Alaska Native
Year householder moved into unit - Moved in 1990 to 1994 (%) - Multirace
Year householder moved into unit - Moved in 1990 to 1994 (%) - Other Race
Year householder moved into unit - Moved in 1980 to 1989 (%)
Year householder moved into unit - Moved in 1980 to 1989 (%) - White
Year householder moved into unit - Moved in 1980 to 1989 (%) - Black or African American
Year householder moved into unit - Moved in 1980 to 1989 (%) - Asian
Year householder moved into unit - Moved in 1980 to 1989 (%) - Hispanic or Latino
Year householder moved into unit - Moved in 1980 to 1989 (%) - American Indian and Alaska Native
Year householder moved into unit - Moved in 1980 to 1989 (%) - Multirace
Year householder moved into unit - Moved in 1980 to 1989 (%) - Other Race
Year householder moved into unit - Moved in 1970 to 1979 (%)
Year householder moved into unit - Moved in 1970 to 1979 (%) - White
Year householder moved into unit - Moved in 1970 to 1979 (%) - Black or African American
Year householder moved into unit - Moved in 1970 to 1979 (%) - Asian
Year householder moved into unit - Moved in 1970 to 1979 (%) - Hispanic or Latino
Year householder moved into unit - Moved in 1970 to 1979 (%) - American Indian and Alaska Native
Year householder moved into unit - Moved in 1970 to 1979 (%) - Multirace
Year householder moved into unit - Moved in 1970 to 1979 (%) - Other Race
Year householder moved into unit - Moved in 1969 or earlier (%)
Year householder moved into unit - Moved in 1969 or earlier (%) - White
Year householder moved into unit - Moved in 1969 or earlier (%) - Black or African American
Year householder moved into unit - Moved in 1969 or earlier (%) - Asian
Year householder moved into unit - Moved in 1969 or earlier (%) - Hispanic or Latino
Year householder moved into unit - Moved in 1969 or earlier (%) - American Indian and Alaska Native
Year householder moved into unit - Moved in 1969 or earlier (%) - Multirace
Year householder moved into unit - Moved in 1969 or earlier (%) - Other Race
Housing units lacking complete plumbing facilities (%)
Housing units lacking complete kitchen facilities (%)
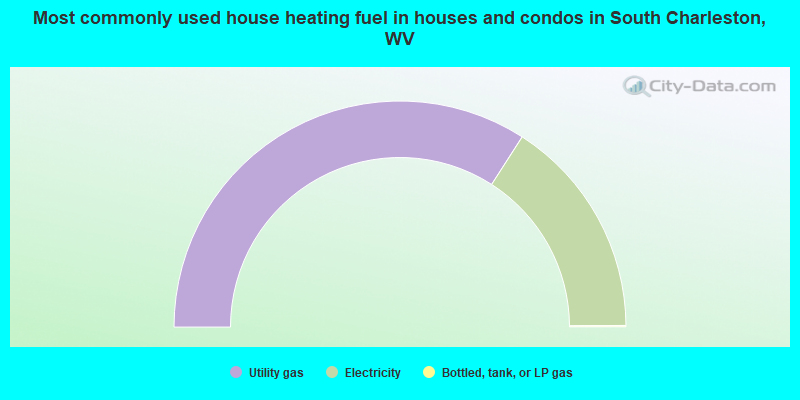
House heating fuel used in houses and condos - Utility gas (%)
House heating fuel used in houses and condos - Bottled, tank, or LP gas (%)
House heating fuel used in houses and condos - Electricity (%)
House heating fuel used in houses and condos - Fuel oil, kerosene, etc. (%)
House heating fuel used in houses and condos - Coal or coke (%)
House heating fuel used in houses and condos - Wood (%)
House heating fuel used in houses and condos - Solar energy (%)
House heating fuel used in houses and condos - Other fuel (%)
House heating fuel used in houses and condos - No fuel used (%)
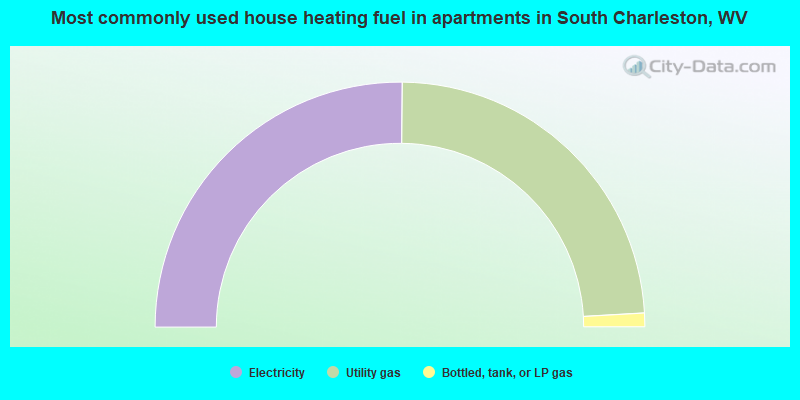
House heating fuel used in apartments - Utility gas (%)
House heating fuel used in apartments - Bottled, tank, or LP gas (%)
House heating fuel used in apartments - Electricity (%)
House heating fuel used in apartments - Fuel oil, kerosene, etc. (%)
House heating fuel used in apartments - Coal or coke (%)
House heating fuel used in apartments - Wood (%)
House heating fuel used in apartments - Solar energy (%)
House heating fuel used in apartments - Other fuel (%)
House heating fuel used in apartments - No fuel used (%)
Median year house/condo built: 1959Median year apartment built: 1960Household type by relationship:
Households: 13,197
Male householders: 2,733 (831 living alone ), Female householders: 3,137 (1,309 living alone )1,893 spouses (1,837 opposite-sex spouses ), 737 unmarried partners , (711 opposite-sex unmarried partners ), 3,214 children (2,945 natural , 80 adopted , 188 stepchildren ), 609 grandchildren , 120 brothers or sisters , 120 parents , 6 foster children , 166 other relatives , 443 non-relatives In group quarters: 10
Size of family households: 1,544 2-persons , 1,253 3-persons , 413 4-persons , 178 5-persons , 21 6-persons , 11 7-or-more-persons .
Size of nonfamily households: 2,276 1-person , 387 2-persons , 77 3-persons , 14 6-persons .
1,011 married couples with children. single-parent households (216 men , 1,520 women ).
98.2% of residents of South Charleston speak English at home. of residents speak Spanish at home (100% speak English very well ).of residents speak other Indo-European language at home (94% speak English very well , 6% speak English well ).of residents speak Asian or Pacific Island language at home (59% speak English very well , 38% speak English well , 3% speak English not well ).of residents speak other language at home (100% speak English very well ).
Foreign born population: 313 (2.4%)of them are naturalized citizens )
Median number of rooms in houses and condos:
Median number of rooms in apartments
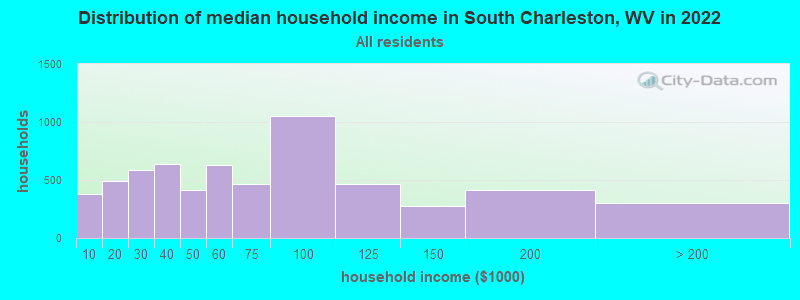
South Charleston, WV household income distribution 382 Less than $10,000492 $10,000 to $19,999587 $20,000 to $29,999636 $30,000 to $39,999416 $40,000 to $49,999630 $50,000 to $59,999466 $60,000 to $74,9991,055 $75,000 to $99,999463 $100,000 to $124,999274 $125,000 to $149,999411 $150,000 to $199,999303 $200,000 or more
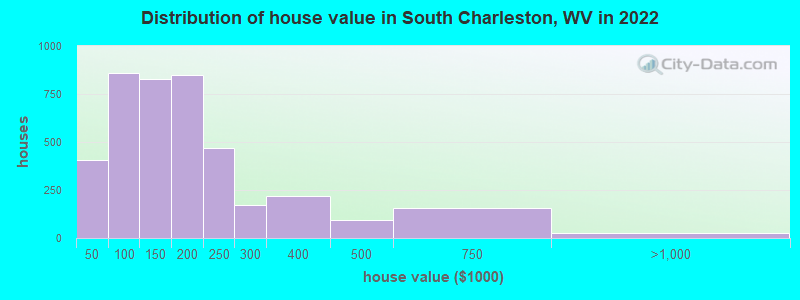
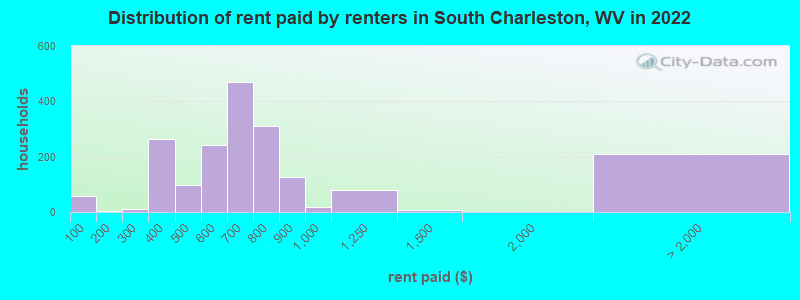
Home value of owner - occupied houses in 2022 in South Charleston, WV 54 Less than $10,0009 $10,000 to $14,999109 $15,000 to $19,9996 $20,000 to $24,99964 $25,000 to $29,999132 $30,000 to $34,9997 $35,000 to $39,99921 $40,000 to $49,999106 $50,000 to $59,99944 $60,000 to $69,999204 $70,000 to $79,999266 $80,000 to $89,999214 $90,000 to $99,999474 $100,000 to $124,999355 $125,000 to $149,999520 $150,000 to $174,999329 $175,000 to $199,999470 $200,000 to $249,999171 $250,000 to $299,999221 $300,000 to $399,99993 $400,000 to $499,999154 $500,000 to $749,99922 $750,000 to $999,9993 $2,000,000 or moreRent paid by renters in 2022 in South Charleston, WV 59 Less than $1003 $100 to $1499 $250 to $29993 $300 to $349169 $350 to $39927 $400 to $44971 $450 to $49984 $500 to $549156 $550 to $599307 $600 to $649162 $650 to $699215 $700 to $74994 $750 to $799126 $800 to $89917 $900 to $99979 $1,000 to $1,2498 $1,250 to $1,499209 No cash rent
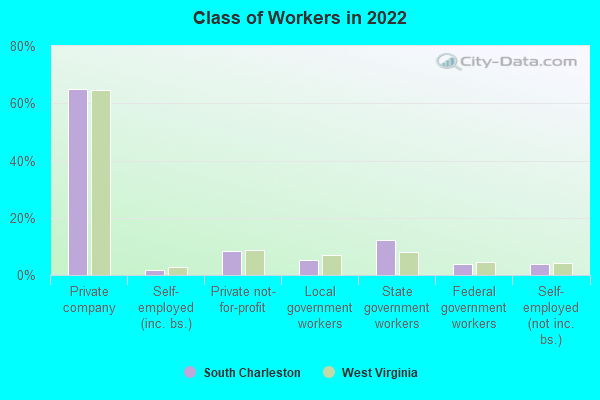
Percentage of workers working in this county: 86.5%Number of people working at home: 461 (7.3% of all workers )
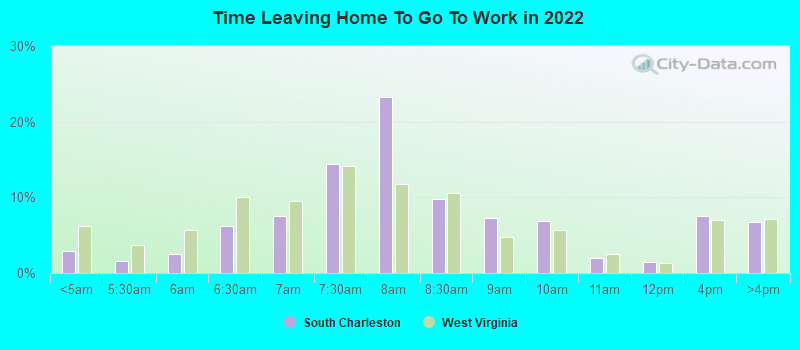
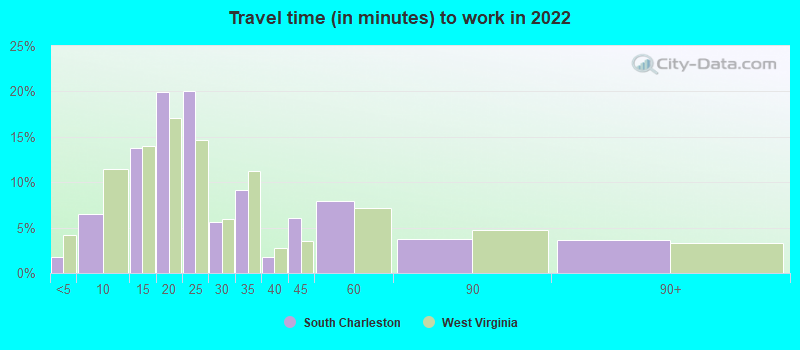
Travel time to work (commute)
Less than 5 minutes: 1955 to 9 minutes: 60910 to 14 minutes: 1,21615 to 19 minutes: 1,42220 to 24 minutes: 84625 to 29 minutes: 29830 to 34 minutes: 41735 to 39 minutes: 8040 to 44 minutes: 8845 to 59 minutes: 15160 to 89 minutes: 8190 or more minutes: 67
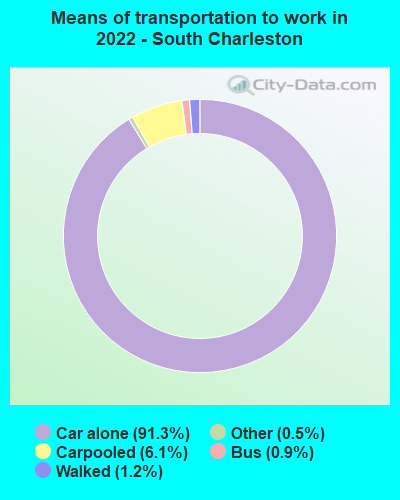
Means of transportation to work:
Drove a car alone: 9,331 (87.6%)Carpooled: 544 (5.1%)Bus : 52 (0.5%)Taxi: 60 (0.6%)Bicycle: 2 (0.0%)Walked: 99 (0.9%)Worked at home: 500 (4.7%)
Unemployment by race in 2022
Unemployment rate for White non-Hispanic residents 6.3% Males8.1% FemalesUnemployment rate for Black residents 3.0% MalesUnemployment rate for two or more race residents 45.1% Females
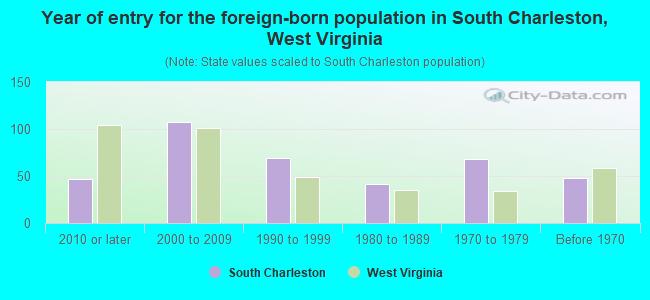
Year of entry for the foreign-born population in South Charleston, West Virginia
47 2010 or later 107 2000 to 2009 69 1990 to 1999 41 1980 to 1989 68 1970 to 1979 48 Before 1970
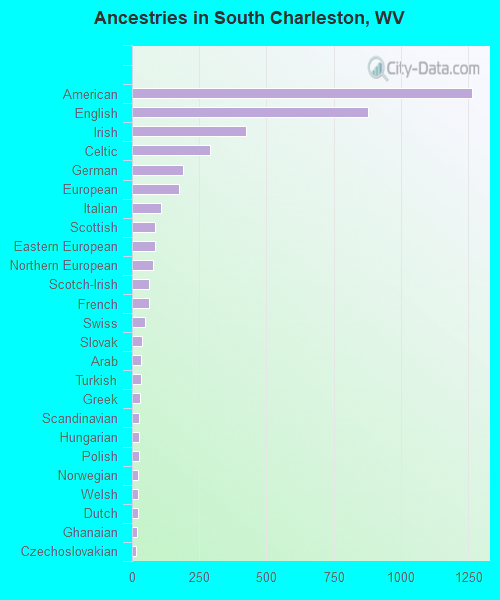
First ancestries reported:
American: 1,264 (21.8%)
English: 878 (15.1%)
Irish: 425 (7.3%)
Celtic: 289 (5.0%)
German: 190 (3.3%)
European: 175 (3.0%)
Italian: 107 (1.8%)
Scottish: 86 (1.5%)
Eastern European: 84 (1.4%)
Northern European: 77 (1.3%)
Scotch-Irish: 64 (1.1%)
French: 62 (1.1%)
Swiss: 47 (0.8%)
Slovak: 36 (0.6%)
Arab: 34 (0.6%)
Turkish: 34 (0.6%)
Greek: 29 (0.5%)
Scandinavian: 27 (0.5%)
Hungarian: 26 (0.4%)
Polish: 25 (0.4%)
Norwegian: 22 (0.4%)
Welsh: 22 (0.4%)
Dutch: 21 (0.4%)
Ghanaian: 18 (0.3%)
Czechoslovakian: 14 (0.2%)
Belgian: 11 (0.2%)
Finnish: 11 (0.2%)
Austrian: 10 (0.2%)
Romanian: 9 (0.2%)
Pennsylvania German: 8 (0.1%)
Lebanese: 5 (0.09%)
British: 4 (0.07%)
African: 1 (0.02%) Most common places of birth for foreign-born residents (%): Korea South Charleston:
21.6% (69)West Virginia:
2.5% (733)
India South Charleston:
19.4% (62)West Virginia:
7.2% (2,098)
Algeria South Charleston:
14.1% (45)West Virginia:
0.2% (44)
Pakistan South Charleston:
12.5% (40)West Virginia:
1.1% (326)
Mexico South Charleston:
11.0% (35)West Virginia:
7.4% (2,143)
Turkey South Charleston:
7.2% (23)West Virginia:
0.5% (134)
Ghana South Charleston:
5.3% (17)West Virginia:
0.6% (168)
Burma (Myanmar) South Charleston:
3.4% (11)West Virginia:
0.5% (152)
Vietnam South Charleston:
3.4% (11)West Virginia:
3.0% (877)
Place of birth for U.S.-born residents:
This state: 10,379Other state: 2,410Northeast: 436Midwest: 636South: 1,117West: 218 92.9% of South Charleston residents lived in the same house 1 years ago.
Out of people who lived in different houses, 40.4% lived in this county.
Out of people who lived in different counties, 37.9% lived in West Virginia.
South Charleston:
92.9%State average:
89.6%
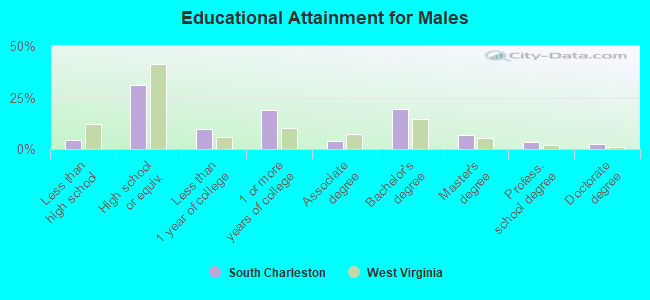
Education attainment for males 25 years and older:
No schooling: 115Nursery to 4th grade: 05th and 6th grade: 07th and 8th grade: 09th grade: 010th grade: 411th grade: 012th grade, no diploma: 78High school graduate (or equivalency): 1,343Less than 1 year of college: 415Some college more than 1 year, no degree: 820Associate degree: 160Bachelor's degree: 829Master's degree: 284Professional school degree: 150Doctorate degree: 95
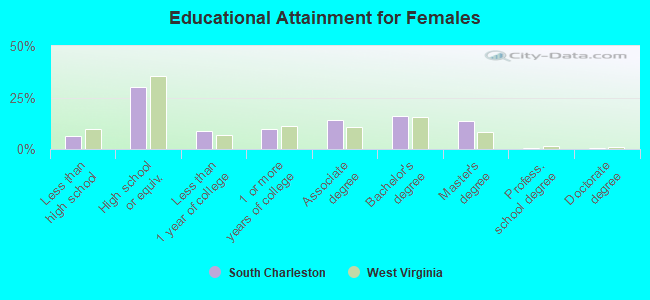
Education attainment for females 25 years and older:
No schooling: 118Nursery to 4th grade: 05th and 6th grade: 07th and 8th grade: 459th grade: 4910th grade: 1111th grade: 5612th grade, no diploma: 46High school graduate (or equivalency): 1,541Less than 1 year of college: 450Some college more than 1 year, no degree: 493Associate degree: 728Bachelor's degree: 832Master's degree: 703Professional school degree: 31Doctorate degree: 29
Housing units in structures:
One, detached: 4,769One, attached: 113Two: 2893 or 4: 3875 to 9: 29310 to 19: 32220 to 49: 9050 or more: 157Mobile homes: 75Housing units lacking complete plumbing facilities in 2022: 0.8%Housing units lacking complete kitchen facilities in 2022: 0.8%House/condo owner moved in on average 9 years ago
Renter moved in on average 3 years ago
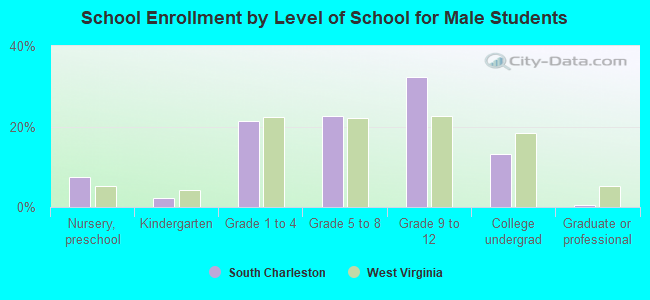
Private vs. public school enrollment:
Students in private schools in grades 1 to 8 (elementary and middle school): 203 Here:
13.6%West Virginia:
12.2%
Students in private schools in grades 9 to 12 (high school): 34 Here:
4.4%West Virginia:
8.8%
Students in private undergraduate colleges: 27 Here:
11.4%West Virginia:
17.3%