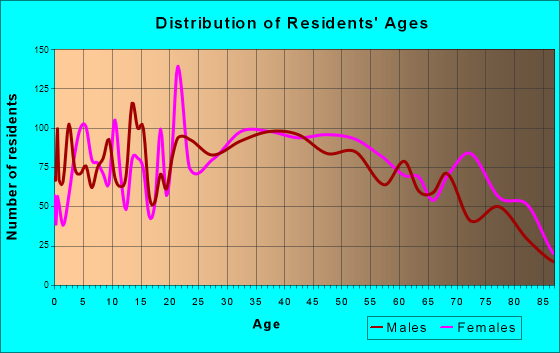
South Daytona, FL (Florida) Houses and Residents
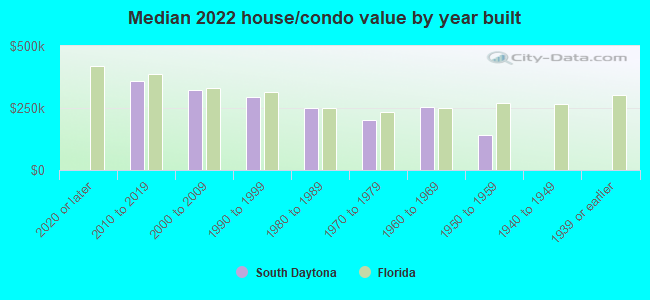
| South Daytona: | $231,660 |
| Florida: | $354,100 |
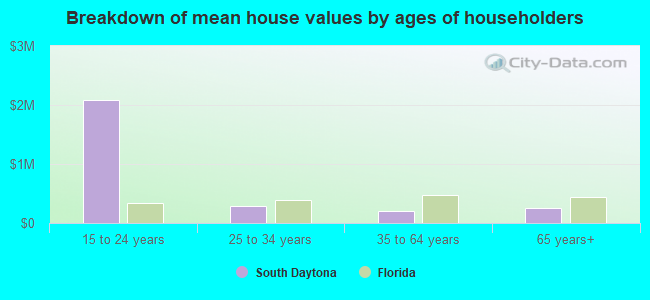
Mean price in 2022:
Detached houses: $291,786
Here: $291,786 State: $500,941 Townhouses or other attached units: $134,812
Here: $134,812 State: $370,869 In 3-to-4-unit structures: $81,563
Here: $81,563 State: $309,944 In 5-or-more-unit structures: $205,403
Here: $205,403 State: $447,145 Mobile homes: $128,688
Here: $128,688 State: $113,202
Total population: 12,397 (All urban)
Houses: 6,848 (6,111 occupied: 3,948 owner occupied, 2,216 renter occupied)
| % of renters here: | 36% |
| State: | 33% |
Housing density: 1,922 houses/condos per square mile
Median price asked for vacant for-sale houses and condos in 2022: $176,243.
Median contract rent in 2022: $1,127 (lower quartile is $888, upper quartile is $1,476)
Median rent asked for vacant for-rent units in 2022: $1,180
Median gross rent in South Daytona, FL in 2022: $1,306
Housing units in South Daytona with a mortgage: 1,980 (130 second mortgage, 0 home equity loan, 117 both second mortgage and home equity loan)
Houses without a mortgage: 50
Median household income for houses/condos with a mortgage: $69,429
Median household income for apartments without a mortgage: $53,423
Median monthly housing costs: $1,098
Compare current foreclosures near South Daytona, FL:
| Photo | Address | Area | Beds / Baths | Price | Details |
|---|---|---|---|---|---|

|
#1
Silver Beach Ave
Daytona Beach, FL 32118
|
1,125 sq. feet
|
2 baths 2 beds |
$180,000
|
show details |

|
#2
Ocean Shore Blvd
Ormond Beach, FL 32176
|
1,065 sq. feet
|
2 baths 2 beds |
$385,000
|
show details |

|
#3
Brookside Cir
Ormond Beach, FL 32174
|
1,533 sq. feet
|
2 baths 3 beds |
show details | |

|
#4
Sherman Rd
Daytona Beach, FL 32119
|
1,426 sq. feet
|
2 baths 3 beds |
show details | |

|
#5
Pine Ave
Deland, FL 32724
|
1,821 sq. feet
|
2 baths 4 beds |
show details | |

|
#6
Madison Ave
Daytona Beach, FL 32114
|
888 sq. feet
|
1 baths 2 beds |
show details | |

|
#7
N Atlantic Ave Apt 108
Daytona Beach, FL 32118
|
665 sq. feet
|
1 baths 1 beds |
show details | |

|
#8
Rush St
New Smyrna Beach, FL 32168
|
1,970 sq. feet
|
2 baths 4 beds |
show details | |

|
#9
Melonie Trl
New Smyrna Beach, FL 32168
|
2,541 sq. feet
|
2 baths 3 beds |
show details | |

|
#10
Fern Palm Dr
Edgewater, FL 32141
|
1,295 sq. feet
|
1 baths 2 beds |
show details |
| Photo | Address | Area | Beds / Baths | Price | Details |
|---|---|---|---|---|---|

|
#11
Scarlett Trl
New Smyrna Beach, FL 32168
|
2,352 sq. feet
|
2 baths 3 beds |
show details | |

|
#12
Florida Blvd
Daytona Beach, FL 32119
|
784 sq. feet
|
1 baths 2 beds |
show details | |

|
#13
Osprey Nest Ln
Port Orange, FL 32128
|
2,546 sq. feet
|
4 baths 4 beds |
show details | |

|
#14
Miami Ave
Daytona Beach, FL 32117
|
782 sq. feet
|
1 baths 2 beds |
show details | |

|
#15
Halifax Dr
Port Orange, FL 32128
|
2,054 sq. feet
|
3 baths 3 beds |
show details | |

|
#16
Cranberry Dr
Port Orange, FL 32127
|
2,744 sq. feet
|
3 baths 3 beds |
show details | |

|
#17
Stuart Dr
Daytona Beach, FL 32117
|
725 sq. feet
|
1 baths 2 beds |
show details | |

|
#18
Carmen Ave
Daytona Beach, FL 32117
|
1,107 sq. feet
|
1 baths 3 beds |
show details | |

|
#19
Halifax Dr
Port Orange, FL 32128
|
2,054 sq. feet
|
3 baths 3 beds |
show details | |

|
#20
Valencia Ave
Daytona Beach, FL 32117
|
986 sq. feet
|
3 baths 2 beds |
show details |
| Photo | Address | Area | Beds / Baths | Price | Details |
|---|---|---|---|---|---|

|
#21
Revere Ln
Daytona Beach, FL 32117
|
848 sq. feet
|
1 baths 2 beds |
show details | |

|
#22
Euclid Ave
Daytona Beach, FL 32118
|
1,240 sq. feet
|
3 baths 3 beds |
show details | |

|
#23
Hancock Ln
Daytona Beach, FL 32117
|
915 sq. feet
|
1 baths 2 beds |
show details | |

|
#24
Champions Dr
Daytona Beach, FL 32124
|
1,759 sq. feet
|
2 baths 3 beds |
show details | |

|
#25
Revere Ln
Daytona Beach, FL 32117
|
848 sq. feet
|
1 baths 2 beds |
show details | |

|
#26
Flomich St
Daytona Beach, FL 32117
|
1,640 sq. feet
|
3 baths 3 beds |
show details | |

|
#27
Jackson Ave
Daytona Beach, FL 32117
|
1,494 sq. feet
|
3 baths 3 beds |
show details | |

|
#28
Jubilee Cir
Daytona Beach, FL 32124
|
1,411 sq. feet
|
2 baths 3 beds |
show details | |

|
#29
N Atlantic Ave # 1204
Daytona Beach, FL 32118
|
- sq. feet
|
- baths - beds |
$124,900
|
show details |

|
#30
N Peninsula Dr
Daytona Beach, FL 32118
|
2,019 sq. feet
|
3 baths 3 beds |
show details |
| Photo | Address | Area | Beds / Baths | Price | Details |
|---|---|---|---|---|---|

|
#31
Sunset Dr
New Smyrna Beach, FL 32168
|
1,460 sq. feet
|
3 baths 2 beds |
show details | |

|
#32
Afshin Ct
Port Orange, FL 32128
|
2,272 sq. feet
|
2 baths 3 beds |
show details | |

|
#33
Cordova Ave
Ormond Beach, FL 32174
|
1,316 sq. feet
|
3 baths 2 beds |
show details | |

|
#34
Great Oaks Dr
Daytona Beach, FL 32117
|
1,197 sq. feet
|
1 baths 2 beds |
show details | |

|
#35
Riverside Dr
Daytona Beach, FL 32117
|
3,647 sq. feet
|
2 baths 4 beds |
show details | |

|
#36
Daytona Ave
Daytona Beach, FL 32117
|
884 sq. feet
|
1 baths 2 beds |
show details | |

|
#37
Dorothy Ave
Daytona Beach, FL 32117
|
704 sq. feet
|
1 baths 2 beds |
show details | |

|
#38
Coconut Palm Cir
Port Orange, FL 32128
|
1,250 sq. feet
|
2 baths 2 beds |
show details | |

|
#39
Baywood Dr
Daytona Beach, FL 32117
|
1,899 sq. feet
|
1 baths 3 beds |
show details | |

|
#40
Tracy St
Daytona Beach, FL 32117
|
1,269 sq. feet
|
2 baths 2 beds |
show details |
| Photo | Address | Area | Beds / Baths | Price | Details |
|---|---|---|---|---|---|

|
#41
Surrey Park Dr
Port Orange, FL 32128
|
1,611 sq. feet
|
2 baths 3 beds |
show details | |

|
#42
Merrimac Dr
Port Orange, FL 32127
|
1,703 sq. feet
|
3 baths 3 beds |
show details | |

|
#43
Berkshire Rd
Daytona Beach, FL 32117
|
1,325 sq. feet
|
1 baths 3 beds |
show details | |

|
#44
3rd St
Daytona Beach, FL 32117
|
2,854 sq. feet
|
4 baths 4 beds |
show details | |

|
#45
Cypress Pond Rd
Port Orange, FL 32128
|
968 sq. feet
|
3 baths 2 beds |
show details | |

|
#46
Osprey Dr
Port Orange, FL 32127
|
1,274 sq. feet
|
3 baths 3 beds |
show details | |

|
#47
Osprey Dr
Port Orange, FL 32127
|
1,280 sq. feet
|
3 baths 3 beds |
show details | |

|
#48
Saybrook St
Port Orange, FL 32127
|
1,738 sq. feet
|
2 baths 3 beds |
show details | |

|
#49
Riverside Dr
Daytona Beach, FL 32117
|
2,016 sq. feet
|
4 baths 4 beds |
show details | |

|
Check over 1 million property listings on Foreclosure.com!
|
browse all offers | |||


 | lot rents for modular homes (11 replies) |
| Deltona - nice homes sell cheap - whats wrong? (34 replies) |
| Recommended apartments near Daytona State College? (2 replies) |
| What is the difference between "South Daytona" and "Daytona"? (18 replies) |
| Daytona Beach homeless saga continues (21 replies) |
| Pelican Bay gated commumity (1 reply) |
Median year apartment built: 1979
Household type by relationship:
Households: 13,618- Male householders: 2,883 (646 living alone), Female householders: 3,265 (1,180 living alone)
2,438 spouses (2,424 opposite-sex spouses), 709 unmarried partners, (680 opposite-sex unmarried partners), 2,797 children (2,613 natural, 79 adopted, 104 stepchildren), 184 grandchildren, 39 brothers or sisters, 218 parents, 0 foster children, 287 other relatives, 709 non-relatives
- In group quarters: 83
Size of family households: 2,128 2-persons, 573 3-persons, 564 4-persons, 168 5-persons, 37 6-persons, 40 7-or-more-persons.
Size of nonfamily households: 1,857 1-person, 682 2-persons, 102 3-persons.
1,153 married couples with children.
855 single-parent households (182 men, 673 women).
88.4% of residents of South Daytona speak English at home.
6.5% of residents speak Spanish at home (75% speak English very well, 10% speak English well, 10% speak English not well, 4% don't speak English at all).
3.7% of residents speak other Indo-European language at home (58% speak English very well, 36% speak English well, 5% speak English not well).
0.6% of residents speak Asian or Pacific Island language at home (72% speak English very well, 28% speak English not well).
1.1% of residents speak other language at home (76% speak English very well, 16% speak English well, 8% speak English not well).
Foreign born population: 1,151 (8.5%)
(53.3% of them are naturalized citizens)
| Here: | 5.6 |
| State: | 5.9 |
| Here: | 4.1 |
| State: | 4.2 |
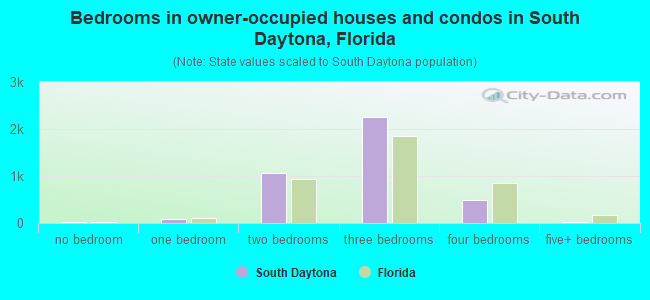
- Bedrooms in owner-occupied houses and condos in South Daytona, Florida
- 21no bedroom
- 851 bedroom
- 1,0712 bedrooms
- 2,2563 bedrooms
- 4884 bedrooms
- 285+ bedrooms
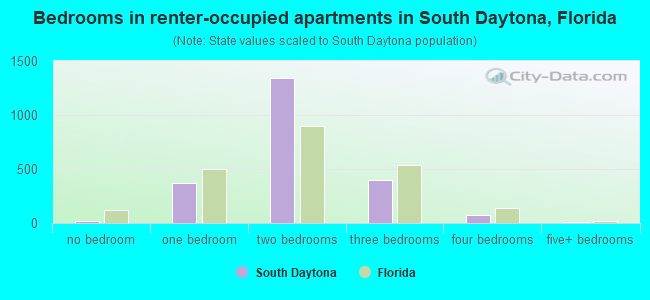
- Bedrooms in renter-occupied apartments in South Daytona, Florida
- 20no bedroom
- 3661 bedroom
- 1,3442 bedrooms
- 3973 bedrooms
- 784 bedrooms
- 115+ bedrooms
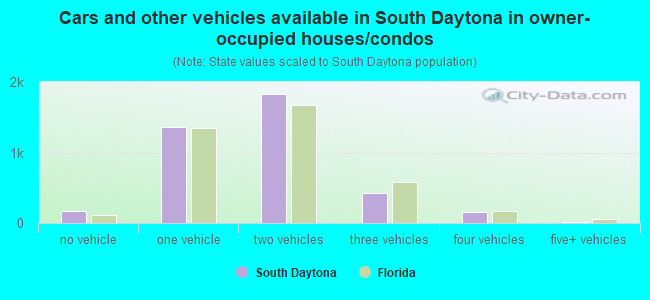
- Cars and other vehicles available in South Daytona in owner-occupied houses/condos
- 164no vehicle
- 1,3671 vehicle
- 1,8252 vehicles
- 4213 vehicles
- 1614 vehicles
- 95+ vehicles
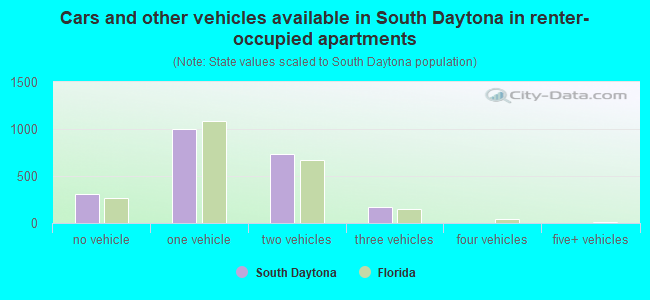
- Cars and other vehicles available in South Daytona in renter-occupied apartments
- 313no vehicle
- 9971 vehicle
- 7362 vehicles
- 1703 vehicles
- 04 vehicles
- 05+ vehicles
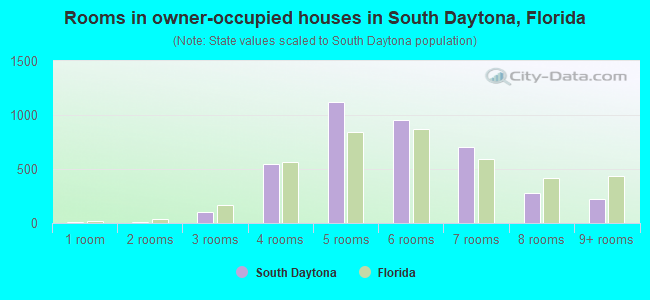
- Rooms in owner-occupied houses in South Daytona, Florida
- 101 room
- 102 rooms
- 983 rooms
- 5444 rooms
- 1,1205 rooms
- 9576 rooms
- 7077 rooms
- 2808 rooms
- 2229+ rooms
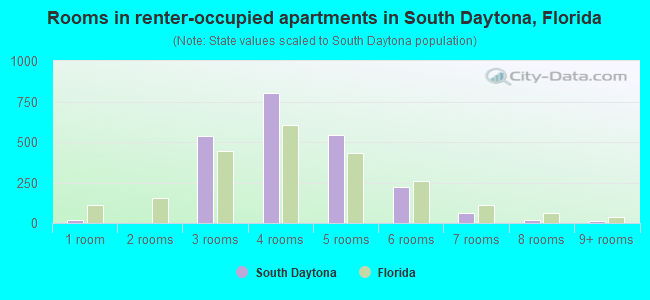
- Rooms in renter-occupied apartments in South Daytona, Florida
- 201 room
- 02 rooms
- 5343 rooms
- 8054 rooms
- 5415 rooms
- 2256 rooms
- 607 rooms
- 218 rooms
- 119+ rooms
South Daytona, FL household income distribution

- 355Less than $10,000
- 517$10,000 to $19,999
- 740$20,000 to $29,999
- 546$30,000 to $39,999
- 432$40,000 to $49,999
- 640$50,000 to $59,999
- 911$60,000 to $74,999
- 751$75,000 to $99,999
- 655$100,000 to $124,999
- 143$125,000 to $149,999
- 242$150,000 to $199,999
- 160$200,000 or more

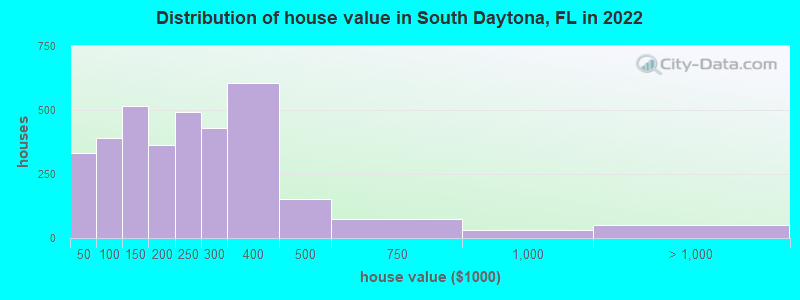
Home value of owner - occupied houses in 2022 in South Daytona, FL
-
- 109Less than $10,000
- 25$10,000 to $14,999
- 34$15,000 to $19,999
- 49$20,000 to $24,999
- 32$30,000 to $34,999
- 25$35,000 to $39,999
- 55$40,000 to $49,999
- 35$50,000 to $59,999
- 188$60,000 to $69,999
- 33$70,000 to $79,999
- 59$80,000 to $89,999
- 17$90,000 to $99,999
- 338$100,000 to $124,999
- 176$125,000 to $149,999
- 135$150,000 to $174,999
- 225$175,000 to $199,999
- 492$200,000 to $249,999
- 430$250,000 to $299,999
- 604$300,000 to $399,999
- 151$400,000 to $499,999
- 75$500,000 to $749,999
- 31$750,000 to $999,999
- 14$1,000,000 to $1,499,999
- 37$1,500,000 to $1,999,999
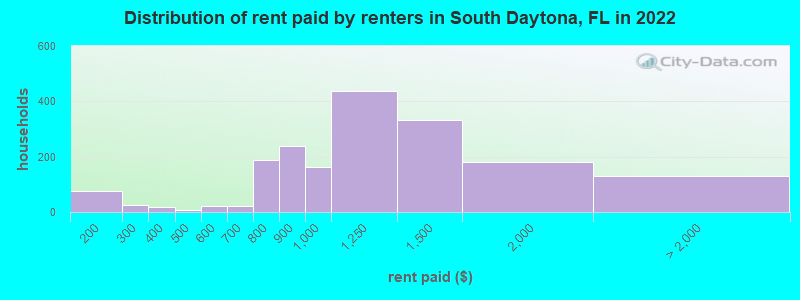
Rent paid by renters in 2022 in South Daytona, FL
-
- 25$100 to $149
- 51$150 to $199
- 24$250 to $299
- 19$350 to $399
- 8$400 to $449
- 14$500 to $549
- 5$550 to $599
- 7$600 to $649
- 15$650 to $699
- 39$700 to $749
- 149$750 to $799
- 238$800 to $899
- 160$900 to $999
- 438$1,000 to $1,249
- 332$1,250 to $1,499
- 181$1,500 to $1,999
- 102$2,000 to $2,499
- 26No cash rent
Percentage of workers working in this county: 93.3%
Number of people working at home: 723 (11.5% of all workers)
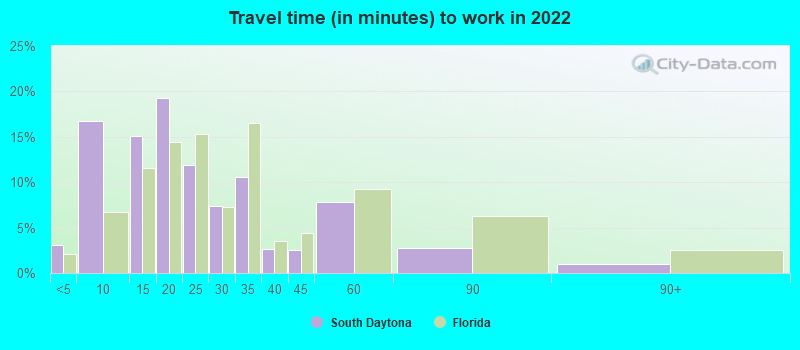
Travel time to work (commute)
- Less than 5 minutes: 155
- 5 to 9 minutes: 650
- 10 to 14 minutes: 1,381
- 15 to 19 minutes: 1,284
- 20 to 24 minutes: 554
- 25 to 29 minutes: 300
- 30 to 34 minutes: 410
- 35 to 39 minutes: 92
- 40 to 44 minutes: 140
- 45 to 59 minutes: 170
- 60 to 89 minutes: 204
- 90 or more minutes: 92
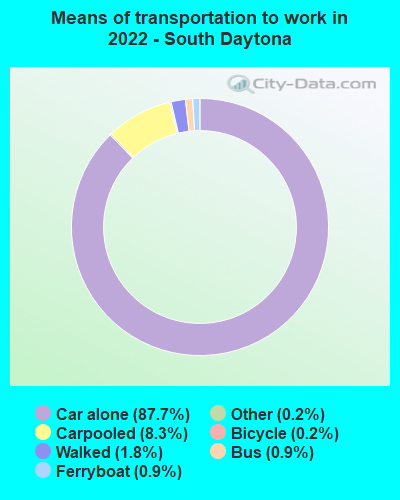
Means of transportation to work:
- Drove a car alone: 3,457 (73.3%)
- Carpooled: 358 (7.6%)
- Bus: 27 (0.6%)
- Ferryboat: 37 (0.8%)
- Taxi: 6 (0.1%)
- Bicycle: 7 (0.1%)
- Walked: 65 (1.4%)
- Worked at home: 723 (15.3%)
- Unemployment by race in 2022
- Unemployment rate for White non-Hispanic residents
- 4.8%Males
- 1.8%Females
- Unemployment rate for Black residents
- 13.7%Males
- Unemployment rate for Asian residents
- 43.5%Females
- Unemployment rate for two or more race residents
- 24.5%Males
- Unemployment rate for Hispanic or Latino residents
- 4.5%Males
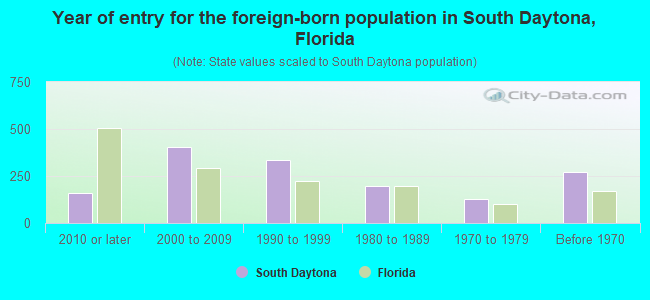
- Year of entry for the foreign-born population in South Daytona, Florida
- 1622010 or later
- 4022000 to 2009
- 3331990 to 1999
- 1951980 to 1989
- 1281970 to 1979
- 271Before 1970
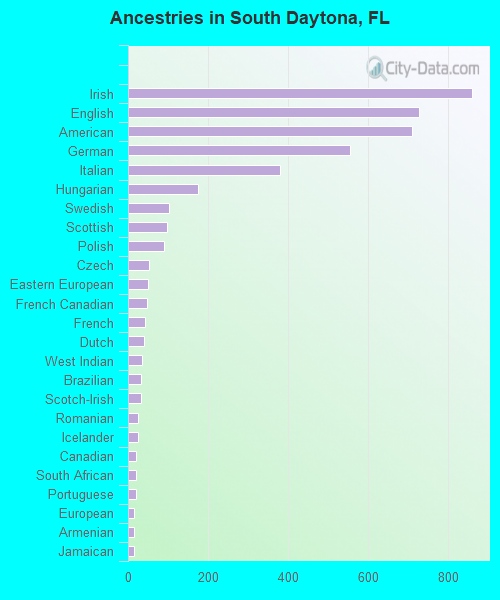
First ancestries reported:
- Irish: 860 (12.8%)
- English: 727 (10.8%)
- American: 711 (10.6%)
- German: 555 (8.2%)
- Italian: 379 (5.6%)
- Hungarian: 175 (2.6%)
- Swedish: 103 (1.5%)
- Scottish: 97 (1.4%)
- Polish: 89 (1.3%)
- Czech: 52 (0.8%)
- Eastern European: 51 (0.8%)
- French Canadian: 48 (0.7%)
- French: 42 (0.6%)
- Dutch: 41 (0.6%)
- West Indian: 35 (0.5%)
- Brazilian: 33 (0.5%)
- Scotch-Irish: 33 (0.5%)
- Romanian: 24 (0.4%)
- Icelander: 24 (0.4%)
- Canadian: 21 (0.3%)
- South African: 20 (0.3%)
- Portuguese: 19 (0.3%)
- European: 15 (0.2%)
- Armenian: 14 (0.2%)
- Jamaican: 14 (0.2%)
- Syrian: 11 (0.2%)
- Iranian: 11 (0.2%)
- Croatian: 8 (0.1%)
- Haitian: 8 (0.1%)
- Lithuanian: 7 (0.1%)
- Greek: 6 (0.09%)
- British: 6 (0.09%)
- Northern European: 4 (0.06%)
- Slavic: 1 (0.01%)
Most common places of birth for foreign-born residents (%):
| South Daytona: | 11.0% (137) |
| Florida: | 1.2% (54,272) |
| South Daytona: | 10.1% (126) |
| Florida: | 2.1% (96,693) |
| South Daytona: | 9.5% (118) |
| Florida: | 0.2% (9,122) |
| South Daytona: | 7.9% (98) |
| Florida: | 2.1% (94,349) |
| South Daytona: | 5.1% (64) |
| Florida: | 5.0% (227,319) |
| South Daytona: | 3.9% (49) |
| Florida: | 2.4% (109,132) |
| South Daytona: | 3.8% (47) |
| Florida: | 0.0% (1,114) |
| South Daytona: | 3.5% (44) |
| Florida: | 1.8% (84,403) |
| South Daytona: | 3.4% (42) |
| Florida: | 0.7% (34,227) |
| South Daytona: | 3.3% (41) |
| Florida: | 0.4% (16,570) |
| South Daytona: | 3.2% (40) |
| Florida: | 1.2% (54,585) |
| South Daytona: | 3.0% (37) |
| Florida: | 1.3% (57,263) |
| South Daytona: | 2.8% (35) |
| Florida: | 3.0% (137,727) |
| South Daytona: | 2.8% (35) |
| Florida: | 2.1% (97,632) |
| South Daytona: | 2.7% (34) |
| Florida: | 0.1% (4,700) |
| South Daytona: | 2.4% (30) |
| Florida: | 5.6% (257,152) |
| South Daytona: | 2.1% (26) |
| Florida: | 2.7% (122,906) |
| South Daytona: | 1.9% (24) |
| Florida: | 1.0% (43,642) |
| South Daytona: | 1.7% (21) |
| Florida: | 5.7% (262,042) |
| South Daytona: | 1.5% (19) |
| Florida: | 6.5% (298,669) |
Place of birth for U.S.-born residents:
- This state: 4,473
- Other state: 7,639
- Northeast: 3,353
- Midwest: 2,036
- South: 1,819
- West: 431
88.5% of South Daytona residents lived in the same house 1 years ago.
Out of people who lived in different houses, 33.1% lived in this county.
Out of people who lived in different counties, 39.2% lived in Florida.
| South Daytona: | 88.5% |
| State average: | 86.3% |
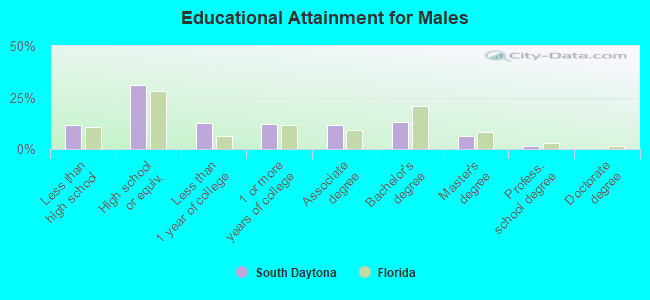
Education attainment for males 25 years and older:
- No schooling: 213
- Nursery to 4th grade: 23
- 5th and 6th grade: 0
- 7th and 8th grade: 59
- 9th grade: 58
- 10th grade: 81
- 11th grade: 78
- 12th grade, no diploma: 70
- High school graduate (or equivalency): 1,538
- Less than 1 year of college: 618
- Some college more than 1 year, no degree: 589
- Associate degree: 580
- Bachelor's degree: 653
- Master's degree: 300
- Professional school degree: 66
- Doctorate degree: 9
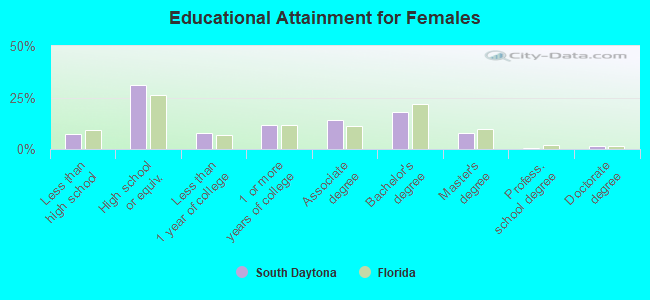
Education attainment for females 25 years and older:
- No schooling: 48
- Nursery to 4th grade: 0
- 5th and 6th grade: 18
- 7th and 8th grade: 59
- 9th grade: 22
- 10th grade: 92
- 11th grade: 68
- 12th grade, no diploma: 96
- High school graduate (or equivalency): 1,756
- Less than 1 year of college: 449
- Some college more than 1 year, no degree: 667
- Associate degree: 789
- Bachelor's degree: 1,009
- Master's degree: 436
- Professional school degree: 34
- Doctorate degree: 90
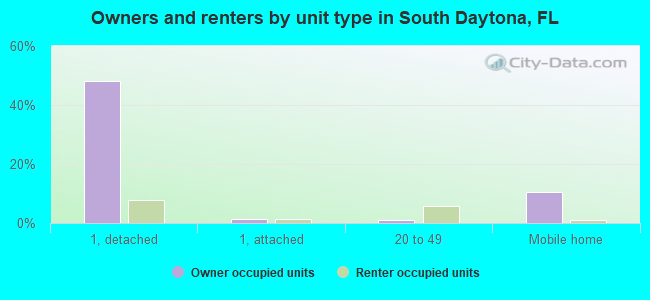
Housing units in structures:
- One, detached: 3,776
- One, attached: 113
- Two: 92
- 3 or 4: 463
- 5 to 9: 378
- 10 to 19: 448
- 20 to 49: 255
- 50 or more: 313
- Mobile homes: 977
- Boats, RVs, vans, etc.: 29
Median worth of mobile homes: $55,581
Housing units lacking complete kitchen facilities in 2022: 0.5%
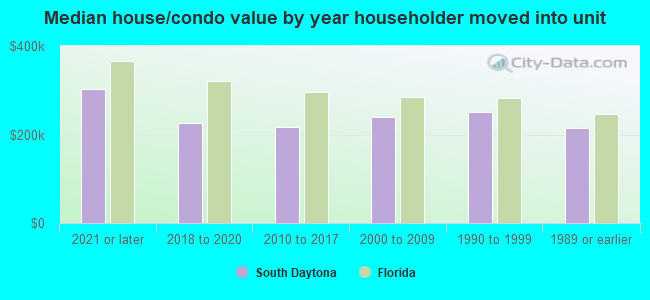
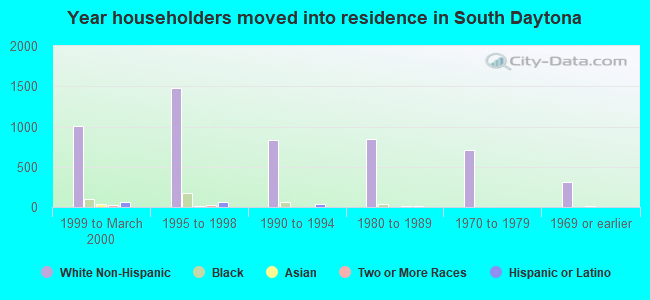
House/condo owner moved in on average 9 years ago
Renter moved in on average 2 years ago
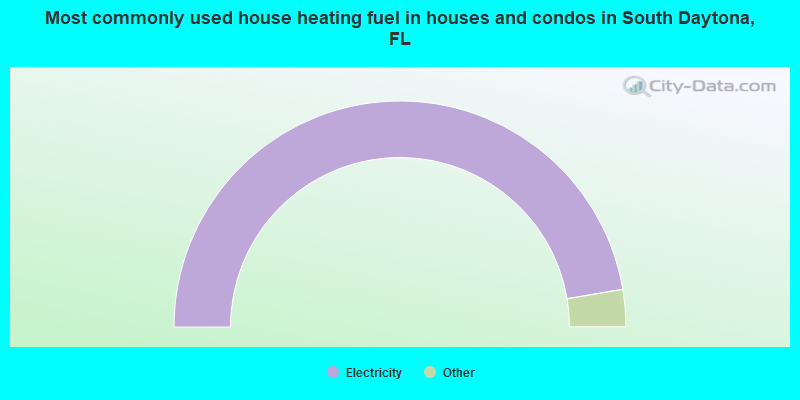
- 94.7%Electricity
- 2.7%Utility gas
- 1.9%Bottled, tank, or LP gas
- 0.5%Fuel oil, kerosene, etc.
- 0.2%No fuel used
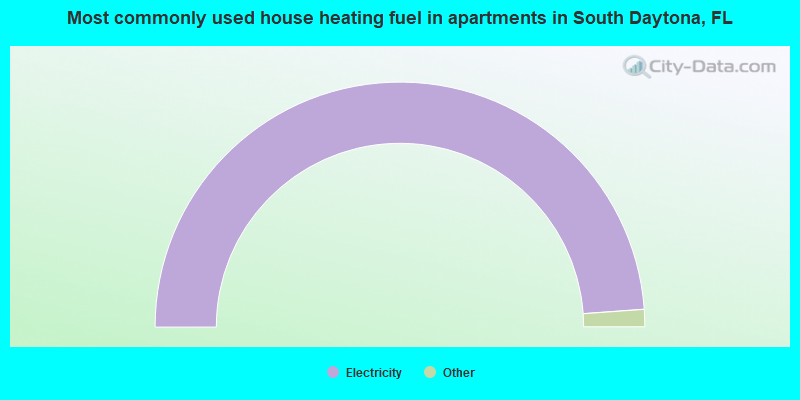
- 97.7%Electricity
- 1.9%Utility gas
- 0.3%No fuel used
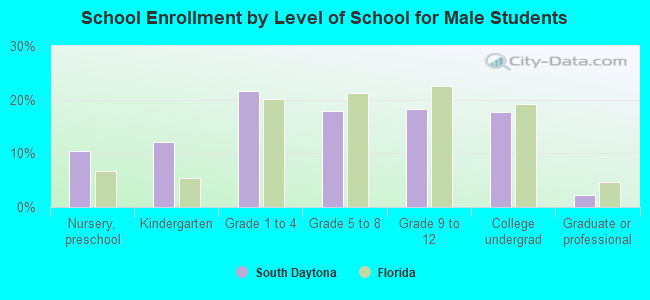
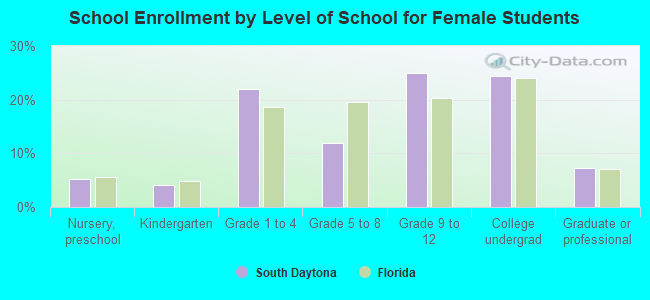
Private vs. public school enrollment:
| Here: | 39.5% |
| Florida: | 15.8% |
| Here: | 29.4% |
| Florida: | 12.9% |
| Here: | 13.3% |
| Florida: | 23.6% |