South Farmingdale, NY (New York) Houses and Residents
Estimated median house or condo value in 2022: $567,843 (it was $207,700 in 2000 )
South Farmingdale:
$567,843New York:
$400,400
Lower value quartile - upper value quartile: $481,786 - $681,582Mean price in 2022: Detached houses: $529,944 Here:
$529,944State:
$476,719
In 2-unit structures: $527,471 Here:
$527,471State:
$713,077
Total population: 14,486 (All urban)
Houses: 4,764 (4,764 occupied: 4,489 owner occupied, 266 renter occupied )
% of renters here:
6%State:
46%
Housing density: 2,178 houses/condos per square mile
Median price asked for vacant for-sale houses and condos in 2022 in this county: $728,543.
Median contract rent in 2022: over $2,000 (lower quartile is $1,554, upper quartile is over $2,000)
Median rent asked for vacant for-rent units in 2022: $2,211
Median gross rent in South Farmingdale, NY in 2022: over $2,000
Housing units in South Farmingdale with a mortgage: 2,926 (343 second mortgage, 3 home equity loan, 334 both second mortgage and home equity loan )Houses without a mortgage: 59
Median household income for houses/condos with a mortgage: $184,457
Median household income for apartments without a mortgage: $116,133
Median monthly housing costs: $2,629
Data:
Median house or condo value ($)
Median house or condo value ($ change since 2000)
Median house or condo value ($) - White
Median house or condo value ($) - Black or African American
Median house or condo value ($) - Asian
Median house or condo value ($) - Hispanic or Latino
Median house or condo value ($) - American Indian and Alaska Native
Median house or condo value ($) - Multirace
Median house or condo value ($) - Other Race
Median price asked for mobile homes ($)
Household density (households per square mile)
Mean house or condo value by units in structure - 1, detached ($)
Mean house or condo value by units in structure - 1, attached ($)
Mean house or condo value by units in structure - 2 ($)
Mean house or condo value by units in structure by units in structure - 3 or 4 ($)
Mean house or condo value by units in structure - 5 or more ($)
Mean house or condo value by units in structure - Boat, RV, van, etc. ($)
Mean house or condo value by units in structure - Mobile home ($)
Median contract rent ($)
Median contract rent - Lower quartile ($)
Median contract rent - Upper quartile ($)
Median gross rent ($)
Urban houses (%)
Rural houses (%)
Houses occupied (%)
Houses occupied (% change since 2000)
Houses owner occupied (%)
Houses owner occupied (% change since 2000)
Houses renter occupied (%)
Houses renter occupied (% change since 2000)
Vacant housing units - For rent (%)
Vacant housing units - For rent (% change since 2000)
Vacant housing units - For sale only (%)
Vacant housing units - For sale only (% change since 2000)
Vacant housing units - Rented or sold, not occupied (%)
Vacant housing units - Rented or sold, not occupied (% change since 2000)
Vacant housing units - For seasonal, recreational, or occasional use (%)
Vacant housing units - For seasonal, recreational, or occasional use (% change since 2000)
Vacant housing units - For migrant workers (%)
Vacant housing units - For migrant workers (% change since 2000)
Vacant housing units - Other vacant (%)
Vacant housing units - Other vacant (% change since 2000)
Median monthly housing costs ($)
Median household income for houses/condos with a mortgage ($)
Median household income for houses/condos without a mortgage ($)
Median household income ($)
Median household income ($) - White
Median household income ($) - Black or African American
Median household income ($) - Asian
Median household income ($) - Hispanic or Latino
Median household income ($) - American Indian and Alaska Native
Median household income ($) - Multirace
Median household income ($) - Other Race
Mortgage status - with mortgage (%)
Mortgage status - with second mortgage (%)
Mortgage status - with home equity loan (%)
Mortgage status - with both second mortgage and home equity loan (%)
Mortgage status - without a mortgage (%)
Median year house/condo built
Median year apartment built
Household type by relationship - Male householder living alone (%)
Household type by relationship - Male householder not living alone (%)
Household type by relationship - Female householder living alone (%)
Household type by relationship - Female householder not living alone (%)
Household type by relationship - Opposite-Sex spouse (%)
Household type by relationship - Same-Sex spouse (%)
Household type by relationship - Opposite-Sex unmarried partner (%)
Household type by relationship - Same-Sex unmarried partner (%)
Household type by relationship - In group quarters (%)
Size of family households - 2-person household (%)
Size of family households - 3-person household (%)
Size of family households - 4-person household (%)
Size of family households - 5-person household (%)
Size of family households - 6-person household (%)
Size of family households - 7-or-more-person household (%)
Size of nonfamily households - 1-person household (%)
Size of nonfamily households - 2-person household (%)
Size of nonfamily households - 3-person household (%)
Size of nonfamily households - 4-person household (%)
Size of nonfamily households - 5-person household (%)
Size of nonfamily households - 6-person household (%)
Size of nonfamily households - 7-or-moreperson household (%)
Year house built - Built 2010 or later (%)
Year house built - Built 2000 to 2009 (%)
Year house built - Built 1990 to 1999 (%)
Year house built - Built 1980 to 1989 (%)
Year house built - Built 1970 to 1979 (%)
Year house built - Built 1960 to 1969 (%)
Year house built - Built 1950 to 1959 (%)
Year house built - Built 1940 to 1949 (%)
Year house built - Built 1939 or earlier (%)
Median number of rooms in houses and condos
Median number of rooms in apartments
Median number of bedrooms in owner occupied houses
Mean number of bedrooms in owner occupied houses
Median number of bedrooms in renter occupied houses
Mean number of bedrooms in renter occupied houses
Median number of vehichles in owner occupied houses
Mean number of vehichles in owner occupied houses
Median number of vehichles in renter occupied houses
Mean number of vehichles in renter occupied houses
Rooms in owner-occupied houses - 1 room (%)
Rooms in owner-occupied houses - 2 rooms (%)
Rooms in owner-occupied houses - 3 rooms (%)
Rooms in owner-occupied houses - 4 rooms (%)
Rooms in owner-occupied houses - 5 rooms (%)
Rooms in owner-occupied houses - 6 rooms (%)
Rooms in owner-occupied houses - 7 rooms (%)
Rooms in owner-occupied houses - 8 rooms (%)
Rooms in owner-occupied houses - 9+ rooms (%)
Rooms in renter-occupied houses - 1 room (%)
Rooms in renter-occupied houses - 2 rooms (%)
Rooms in renter-occupied houses - 3 rooms (%)
Rooms in renter-occupied houses - 4 rooms (%)
Rooms in renter-occupied houses - 5 rooms (%)
Rooms in renter-occupied houses - 6 rooms (%)
Rooms in renter-occupied houses - 7 rooms (%)
Rooms in renter-occupied houses - 8 rooms (%)
Rooms in renter-occupied houses - 9+ rooms (%)
Bedrooms in owner-occupied houses - no bedrooms (%)
Bedrooms in owner-occupied houses - 1 bedroom (%)
Bedrooms in owner-occupied houses - 2 bedrooms (%)
Bedrooms in owner-occupied houses - 3 bedrooms (%)
Bedrooms in owner-occupied houses - 4 bedrooms (%)
Bedrooms in owner-occupied houses - 5+ bedrooms (%)
Bedrooms in renter-occupied houses - no bedrooms (%)
Bedrooms in renter-occupied houses - 1 bedroom (%)
Bedrooms in renter-occupied houses - 2 bedrooms (%)
Bedrooms in renter-occupied houses - 3 bedrooms (%)
Bedrooms in renter-occupied houses - 4 bedrooms (%)
Bedrooms in renter-occupied houses - 5+ bedrooms (%)
Vehicles available in owner-occupied houses - no vehicle available (%)
Vehicles available in owner-occupied houses - 1 vehicle available(%)
Vehicles available in owner-occupied houses - 2 Vehicles available (%)
Vehicles available in owner-occupied houses - 3 Vehicles available (%)
Vehicles available in owner-occupied houses - 4 Vehicles available (%)
Vehicles available in owner-occupied houses - 5+ Vehicles available (%)
Vehicles available in renter-occupied houses - no vehicle available (%)
Vehicles available in renter-occupied houses - 1 vehicle available (%)
Vehicles available in renter-occupied houses - 2 Vehicles available (%)
Vehicles available in renter-occupied houses - 3 Vehicles available (%)
Vehicles available in renter-occupied houses - 4 Vehicles available (%)
Vehicles available in renter-occupied houses - 5+ Vehicles available (%)
Housing units in structures - 1, detached (%)
Housing units in structures - 1, attached (%)
Housing units in structures - 2 (%)
Housing units in structures - 3 or 4 (%)
Housing units in structures - 5 to 9 (%)
Housing units in structures - 10 to 19 (%)
Housing units in structures - 20 to 49 (%)
Housing units in structures - 50 or more (%)
Housing units in structures - Mobile home (%)
Housing units in structures - Boat, RV, van, etc. (%)
Housing units in structures - Owners - 1, detached (%)
Housing units in structures - Owners - 1, attached (%)
Housing units in structures - Owners - 2 (%)
Housing units in structures - Owners - 3 or 4 (%)
Housing units in structures - Owners - 5 to 9 (%)
Housing units in structures - Owners - 10 to 19 (%)
Housing units in structures - Owners - 20 to 49 (%)
Housing units in structures - Owners - 50 or more (%)
Housing units in structures - Owners - Mobile home (%)
Housing units in structures - Owners - Boat, RV, van, etc. (%)
Housing units in structures - Renters - 1, detached (%)
Housing units in structures - Renters - 1, attached (%)
Housing units in structures - Renters - 2 (%)
Housing units in structures - Renters - 3 or 4 (%)
Housing units in structures - Renters - 5 to 9 (%)
Housing units in structures - Renters - 10 to 19 (%)
Housing units in structures - Renters - 20 to 49 (%)
Housing units in structures - Renters - 50 or more (%)
Housing units in structures - Renters - Mobile home (%)
Housing units in structures - Renters - Boat, RV, van, etc. (%)
House/condo owner moved in on average (years ago)
Renter moved in on average (years ago)
Year householder moved into unit - Moved in 1999 to March 2000 (%)
Year householder moved into unit - Moved in 1999 to March 2000 (%) - White
Year householder moved into unit - Moved in 1999 to March 2000 (%) - Black or African American
Year householder moved into unit - Moved in 1999 to March 2000 (%) - Asian
Year householder moved into unit - Moved in 1999 to March 2000 (%) - Hispanic or Latino
Year householder moved into unit - Moved in 1999 to March 2000 (%) - American Indian and Alaska Native
Year householder moved into unit - Moved in 1999 to March 2000 (%) - Multirace
Year householder moved into unit - Moved in 1999 to March 2000 (%) - Other Race
Year householder moved into unit - Moved in 1995 to 1998 (%)
Year householder moved into unit - Moved in 1995 to 1998 (%) - White
Year householder moved into unit - Moved in 1995 to 1998 (%) - Black or African American
Year householder moved into unit - Moved in 1995 to 1998 (%) - Asian
Year householder moved into unit - Moved in 1995 to 1998 (%) - Hispanic or Latino
Year householder moved into unit - Moved in 1995 to 1998 (%) - American Indian and Alaska Native
Year householder moved into unit - Moved in 1995 to 1998 (%) - Multirace
Year householder moved into unit - Moved in 1995 to 1998 (%) - Other Race
Year householder moved into unit - Moved in 1990 to 1994 (%)
Year householder moved into unit - Moved in 1990 to 1994 (%) - White
Year householder moved into unit - Moved in 1990 to 1994 (%) - Black or African American
Year householder moved into unit - Moved in 1990 to 1994 (%) - Asian
Year householder moved into unit - Moved in 1990 to 1994 (%) - Hispanic or Latino
Year householder moved into unit - Moved in 1990 to 1994 (%) - American Indian and Alaska Native
Year householder moved into unit - Moved in 1990 to 1994 (%) - Multirace
Year householder moved into unit - Moved in 1990 to 1994 (%) - Other Race
Year householder moved into unit - Moved in 1980 to 1989 (%)
Year householder moved into unit - Moved in 1980 to 1989 (%) - White
Year householder moved into unit - Moved in 1980 to 1989 (%) - Black or African American
Year householder moved into unit - Moved in 1980 to 1989 (%) - Asian
Year householder moved into unit - Moved in 1980 to 1989 (%) - Hispanic or Latino
Year householder moved into unit - Moved in 1980 to 1989 (%) - American Indian and Alaska Native
Year householder moved into unit - Moved in 1980 to 1989 (%) - Multirace
Year householder moved into unit - Moved in 1980 to 1989 (%) - Other Race
Year householder moved into unit - Moved in 1970 to 1979 (%)
Year householder moved into unit - Moved in 1970 to 1979 (%) - White
Year householder moved into unit - Moved in 1970 to 1979 (%) - Black or African American
Year householder moved into unit - Moved in 1970 to 1979 (%) - Asian
Year householder moved into unit - Moved in 1970 to 1979 (%) - Hispanic or Latino
Year householder moved into unit - Moved in 1970 to 1979 (%) - American Indian and Alaska Native
Year householder moved into unit - Moved in 1970 to 1979 (%) - Multirace
Year householder moved into unit - Moved in 1970 to 1979 (%) - Other Race
Year householder moved into unit - Moved in 1969 or earlier (%)
Year householder moved into unit - Moved in 1969 or earlier (%) - White
Year householder moved into unit - Moved in 1969 or earlier (%) - Black or African American
Year householder moved into unit - Moved in 1969 or earlier (%) - Asian
Year householder moved into unit - Moved in 1969 or earlier (%) - Hispanic or Latino
Year householder moved into unit - Moved in 1969 or earlier (%) - American Indian and Alaska Native
Year householder moved into unit - Moved in 1969 or earlier (%) - Multirace
Year householder moved into unit - Moved in 1969 or earlier (%) - Other Race
Housing units lacking complete plumbing facilities (%)
Housing units lacking complete kitchen facilities (%)
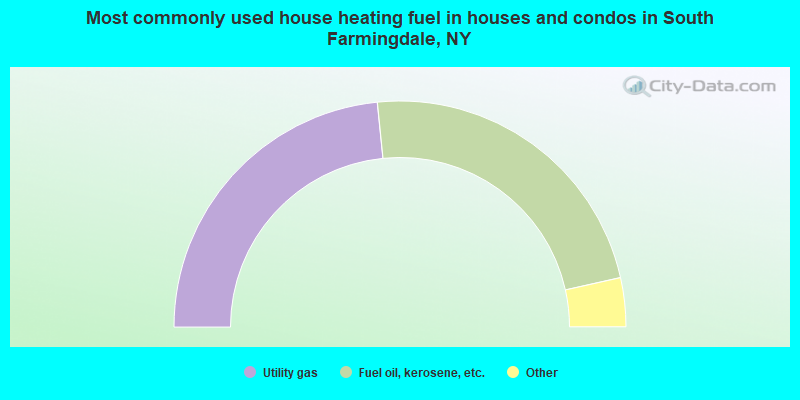
House heating fuel used in houses and condos - Utility gas (%)
House heating fuel used in houses and condos - Bottled, tank, or LP gas (%)
House heating fuel used in houses and condos - Electricity (%)
House heating fuel used in houses and condos - Fuel oil, kerosene, etc. (%)
House heating fuel used in houses and condos - Coal or coke (%)
House heating fuel used in houses and condos - Wood (%)
House heating fuel used in houses and condos - Solar energy (%)
House heating fuel used in houses and condos - Other fuel (%)
House heating fuel used in houses and condos - No fuel used (%)
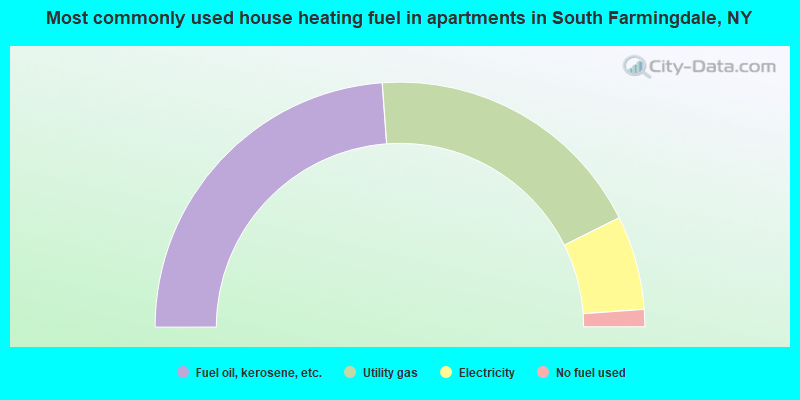
House heating fuel used in apartments - Utility gas (%)
House heating fuel used in apartments - Bottled, tank, or LP gas (%)
House heating fuel used in apartments - Electricity (%)
House heating fuel used in apartments - Fuel oil, kerosene, etc. (%)
House heating fuel used in apartments - Coal or coke (%)
House heating fuel used in apartments - Wood (%)
House heating fuel used in apartments - Solar energy (%)
House heating fuel used in apartments - Other fuel (%)
House heating fuel used in apartments - No fuel used (%)
Median year house/condo built: 1957Median year apartment built: 1964Household type by relationship:
Households: 14,969
Male householders: 2,512 (178 living alone ), Female householders: 2,211 (553 living alone )3,439 spouses (3,439 opposite-sex spouses ), 267 unmarried partners , (267 opposite-sex unmarried partners ), 4,949 children (4,875 natural , 50 adopted , 22 stepchildren ), 420 grandchildren , 73 brothers or sisters , 294 parents , 0 foster children , 315 other relatives , 440 non-relatives In group quarters: 43
Size of family households: 1,269 2-persons , 818 3-persons , 1,048 4-persons , 529 5-persons , 188 6-persons , 22 7-or-more-persons .
Size of nonfamily households: 763 1-person , 73 2-persons , 16 3-persons , 7 4-persons .
2,053 married couples with children. single-parent households (61 men , 231 women ).
83.4% of residents of South Farmingdale speak English at home. of residents speak Spanish at home (81% speak English very well , 14% speak English well , 3% speak English not well , 1% don't speak English at all ).of residents speak other Indo-European language at home (87% speak English very well , 12% speak English well , 1% speak English not well ).of residents speak Asian or Pacific Island language at home (56% speak English very well , 28% speak English well , 14% speak English not well , 2% don't speak English at all ).of residents speak other language at home (96% speak English very well , 4% speak English well ).
Foreign born population: 1,517 (10.1%)of them are naturalized citizens )
Median number of rooms in houses and condos:
Median number of rooms in apartments
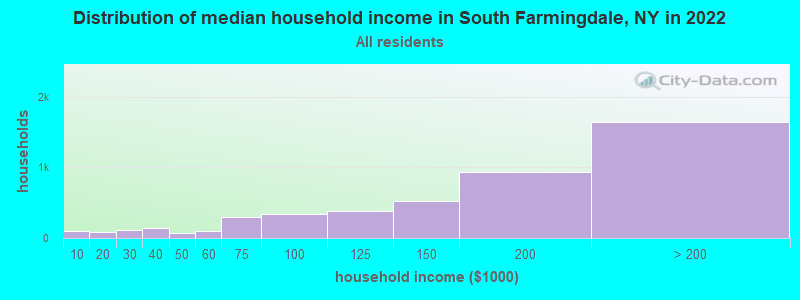
South Farmingdale, NY household income distribution 102 Less than $10,00086 $10,000 to $19,999120 $20,000 to $29,999137 $30,000 to $39,99965 $40,000 to $49,999105 $50,000 to $59,999297 $60,000 to $74,999341 $75,000 to $99,999387 $100,000 to $124,999521 $125,000 to $149,999938 $150,000 to $199,9991,644 $200,000 or more
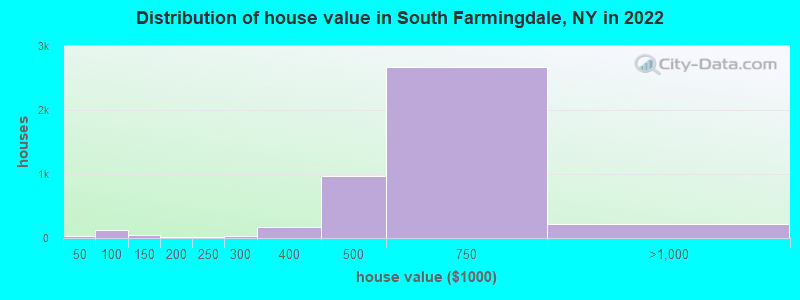
Home value of owner - occupied houses in 2022 in South Farmingdale, NY 4 $20,000 to $24,99911 $30,000 to $34,99911 $40,000 to $49,99995 $50,000 to $59,99921 $60,000 to $69,99950 $100,000 to $124,99916 $150,000 to $174,99916 $200,000 to $249,99935 $250,000 to $299,999165 $300,000 to $399,999969 $400,000 to $499,9992,671 $500,000 to $749,999214 $750,000 to $999,9999 $1,000,000 to $1,499,999Rent paid by renters in 2022 in South Farmingdale, NY 7 $900 to $9996 $1,000 to $1,24918 $1,250 to $1,49959 $1,500 to $1,99918 $2,000 to $2,49948 $2,500 to $2,9998 $3,000 to $3,49935 $3,500 or more74 No cash rent
Percentage of workers working in this county: 49.5%Number of people working at home: 941 (12.0% of all workers )
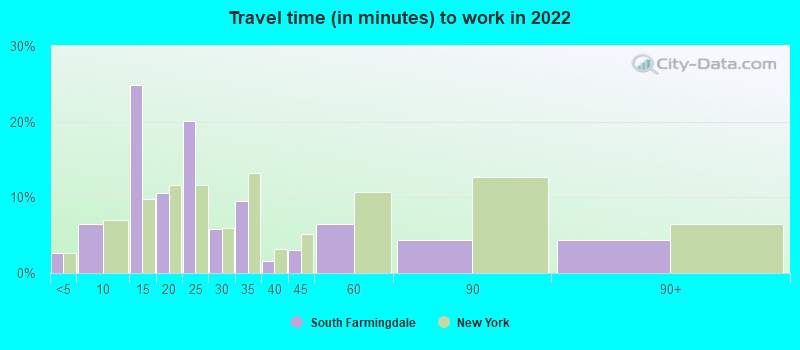
Travel time to work (commute)
Less than 5 minutes: 1235 to 9 minutes: 33410 to 14 minutes: 48115 to 19 minutes: 1,06320 to 24 minutes: 90025 to 29 minutes: 31030 to 34 minutes: 67535 to 39 minutes: 29640 to 44 minutes: 39145 to 59 minutes: 76760 to 89 minutes: 85990 or more minutes: 671
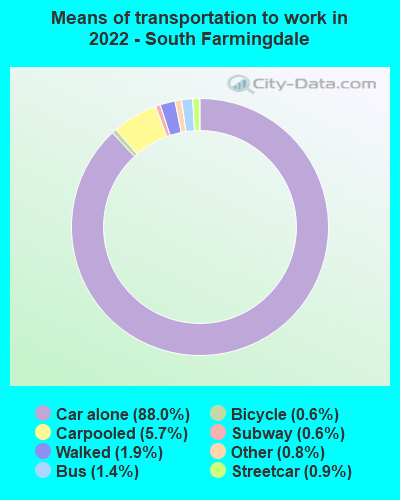
Means of transportation to work:
Drove a car alone: 1,696 (60.7%)Carpooled: 107 (3.8%)Bus : 26 (0.9%)Subway or elevated rail : 15 (0.5%)Long-distance train or commuter rail : 10 (0.4%)Taxi: 23 (0.8%)Bicycle: 17 (0.6%)Walked: 39 (1.4%)Worked at home: 941 (33.7%)
Unemployment by race in 2022
Unemployment rate for White non-Hispanic residents 7.2% Males3.6% FemalesUnemployment rate for Asian residents 0.3% MalesUnemployment rate for other race residents 2.0% FemalesUnemployment rate for two or more race residents 9.5% FemalesUnemployment rate for Hispanic or Latino residents 3.4% Females
Year of entry for the foreign-born population in South Farmingdale, New York
190 2010 or later 258 2000 to 2009 591 1990 to 1999 268 1980 to 1989 290 1970 to 1979 426 Before 1970
First ancestries reported:
Italian: 2,408 (36.8%)
Irish: 739 (11.3%)
Greek: 590 (9.0%)
American: 342 (5.2%)
German: 342 (5.2%)
Polish: 167 (2.6%)
European: 70 (1.1%)
Jamaican: 58 (0.9%)
Romanian: 44 (0.7%)
English: 39 (0.6%)
West Indian: 37 (0.6%)
British: 31 (0.5%)
Norwegian: 21 (0.3%)
Trinidadian and Tobagonian: 14 (0.2%)
French Canadian: 13 (0.2%)
Scotch-Irish: 13 (0.2%)
Turkish: 11 (0.2%)
Haitian: 11 (0.2%)
Czech: 8 (0.1%)
French: 8 (0.1%)
Egyptian: 7 (0.1%)
Portuguese: 7 (0.1%)
Russian: 7 (0.1%)
Ethiopian: 7 (0.1%)
Cypriot: 6 (0.09%)
Scottish: 6 (0.09%)
Lithuanian: 5 (0.08%)
Guyanese: 3 (0.05%) Most common places of birth for foreign-born residents (%): Ecuador South Farmingdale:
16.2% (237)New York:
3.9% (177,448)
Philippines South Farmingdale:
14.7% (216)New York:
2.0% (91,070)
China, excluding Hong Kong and Taiwan South Farmingdale:
11.7% (172)New York:
9.1% (410,910)
India South Farmingdale:
6.2% (91)New York:
3.5% (158,432)
Italy South Farmingdale:
5.2% (77)New York:
1.8% (81,374)
Jamaica South Farmingdale:
4.6% (68)New York:
5.0% (227,557)
Dominican Republic South Farmingdale:
3.6% (53)New York:
11.1% (501,040)
Colombia South Farmingdale:
3.3% (49)New York:
2.5% (111,920)
Hong Kong South Farmingdale:
3.1% (45)New York:
0.9% (42,220)
Ireland South Farmingdale:
2.5% (37)New York:
0.6% (26,772)
Jordan South Farmingdale:
2.2% (33)New York:
0.1% (5,923)
Germany South Farmingdale:
2.2% (33)New York:
0.9% (38,713)
Pakistan South Farmingdale:
2.2% (32)New York:
1.4% (62,442)
Trinidad and Tobago South Farmingdale:
1.9% (28)New York:
2.0% (91,428)
United Arab Emirates South Farmingdale:
1.8% (27)New York:
0.1% (2,409)
Egypt South Farmingdale:
1.6% (24)New York:
0.6% (27,385)
Place of birth for U.S.-born residents:
This state: 12,190Other state: 888Northeast: 331Midwest: 92South: 139West: 333 94.0% of South Farmingdale residents lived in the same house 1 years ago.
Out of people who lived in different houses, 17.2% lived in this county.
Out of people who lived in different counties, 98.6% lived in New York.
South Farmingdale:
94.0%State average:
89.6%
Education attainment for males 25 years and older:
No schooling: 201Nursery to 4th grade: 165th and 6th grade: 247th and 8th grade: 499th grade: 010th grade: 411th grade: 5112th grade, no diploma: 32High school graduate (or equivalency): 1,294Less than 1 year of college: 361Some college more than 1 year, no degree: 609Associate degree: 559Bachelor's degree: 1,329Master's degree: 517Professional school degree: 130Doctorate degree: 89
Education attainment for females 25 years and older:
No schooling: 173Nursery to 4th grade: 115th and 6th grade: 297th and 8th grade: 89th grade: 1810th grade: 1511th grade: 712th grade, no diploma: 46High school graduate (or equivalency): 1,238Less than 1 year of college: 358Some college more than 1 year, no degree: 688Associate degree: 386Bachelor's degree: 1,206Master's degree: 1,252Professional school degree: 31Doctorate degree: 44
Housing units in structures:
One, detached: 4,491One, attached: 101Two: 1543 or 4: 17Housing units lacking complete plumbing facilities in 2022: 0.1%Housing units lacking complete kitchen facilities in 2022: 0.1%House/condo owner moved in on average 22 years ago
Renter moved in on average 6 years ago
Private vs. public school enrollment:
Students in private schools in grades 1 to 8 (elementary and middle school): 72 Students in private schools in grades 9 to 12 (high school): 39 Students in private undergraduate colleges: 308