South Haven, IN (Indiana) Houses and Residents
| South Haven: | $170,076 |
| Indiana: | $208,700 |
Mean price in 2022:
Detached houses: $182,220
Here: $182,220 State: $257,916 Mobile homes: $51,437
Here: $51,437 State: $67,116
Total population: 5,282 (All urban)
Houses: 2,920 (2,795 occupied: 2,030 owner occupied, 808 renter occupied)
| % of renters here: | 28% |
| State: | 29% |
Housing density: 2,346 houses/condos per square mile
Median price asked for vacant for-sale houses and condos in 2022: $318,370.
Median contract rent in 2022: $892 (lower quartile is $666, upper quartile is $1,210)
Median rent asked for vacant for-rent units in 2022: $921
Median gross rent in South Haven, IN in 2022: $1,182
Housing units in South Haven with a mortgage: 1,476 (178 second mortgage, 0 home equity loan, 147 both second mortgage and home equity loan)
Houses without a mortgage: 81
Median household income for houses/condos with a mortgage: $79,609
Median household income for apartments without a mortgage: $62,687
Median monthly housing costs: $1,087
Compare current foreclosures near South Haven, IN:
| Photo | Address | Area | Beds / Baths | Price | Details |
|---|---|---|---|---|---|

|
#1
W 53rd Ln
Merrillville, IN 46410
|
1,194 sq. feet
|
1 baths 3 beds |
$230,000
|
show details |

|
#2
Ellsworth Pl
Gary, IN 46408
|
1,248 sq. feet
|
1 baths 2 beds |
$69,900
|
show details |

|
#3
W Coolspring Ave
Michigan City, IN 46360
|
720 sq. feet
|
1 baths 2 beds |
$144,500
|
show details |

|
#4
Amber Dr
Hobart, IN 46342
|
1,714 sq. feet
|
1 baths 3 beds |
show details | |

|
#5
Condit St
Highland, IN 46322
|
1,808 sq. feet
|
1 baths 2 beds |
show details | |

|
#6
Stone Ave
Portage, IN 46368
|
1,244 sq. feet
|
2 baths 3 beds |
show details | |

|
#7
Jackson St
Gary, IN 46408
|
1,105 sq. feet
|
1 baths 3 beds |
show details | |

|
#8
177th Pl
Hammond, IN 46323
|
975 sq. feet
|
1 baths 3 beds |
show details | |

|
#9
S Virginia St
Hobart, IN 46342
|
2,166 sq. feet
|
4 baths 3 beds |
show details | |

|
#10
Massachusetts St
Merrillville, IN 46410
|
895 sq. feet
|
2 baths 2 beds |
show details |
| Photo | Address | Area | Beds / Baths | Price | Details |
|---|---|---|---|---|---|

|
#11
Lakewood Ave
Gary, IN 46403
|
1,248 sq. feet
|
1 baths 4 beds |
show details | |

|
#12
Montana Ave
Hammond, IN 46323
|
1,344 sq. feet
|
2 baths 3 beds |
show details | |

|
#13
E 3rd Ave
Gary, IN 46403
|
1,588 sq. feet
|
1 baths 3 beds |
show details | |

|
#14
Dearborn St
Lake Station, IN 46405
|
912 sq. feet
|
1 baths 3 beds |
show details | |

|
#15
Carolina St
Gary, IN 46409
|
704 sq. feet
|
1 baths 3 beds |
show details | |

|
#16
Parrish Ave
Hammond, IN 46323
|
1,016 sq. feet
|
1 baths 3 beds |
show details | |

|
#17
Price St
Crown Point, IN 46307
|
1,782 sq. feet
|
2 baths 3 beds |
show details | |

|
#18
6th St
Wheeler, IN 46393
|
1,166 sq. feet
|
1 baths 4 beds |
show details | |

|
#19
W 63rd Ave
Merrillville, IN 46410
|
1,782 sq. feet
|
2 baths 3 beds |
show details | |

|
#20
Williams Dr
Crown Point, IN 46307
|
2,174 sq. feet
|
2 baths 4 beds |
show details |
| Photo | Address | Area | Beds / Baths | Price | Details |
|---|---|---|---|---|---|

|
#21
Birch St
Crown Point, IN 46307
|
875 sq. feet
|
1 baths 3 beds |
show details | |

|
#22
W 97th Pl
Crown Point, IN 46307
|
1,918 sq. feet
|
2 baths 4 beds |
show details | |

|
#23
Chase St
Gary, IN 46404
|
2,604 sq. feet
|
2 baths 3 beds |
show details | |

|
#24
Vigo St
Lake Station, IN 46405
|
1,224 sq. feet
|
1 baths 3 beds |
show details | |

|
#25
N Union St
Hobart, IN 46342
|
2,275 sq. feet
|
2 baths 4 beds |
show details | |

|
#26
Rush Pl
Lake Station, IN 46405
|
2,972 sq. feet
|
1 baths 3 beds |
show details | |

|
#27
Poplar Ln
Hobart, IN 46342
|
2,020 sq. feet
|
2 baths 3 beds |
show details | |

|
#28
Lincoln St
Hobart, IN 46342
|
2,352 sq. feet
|
3 baths 2 beds |
show details | |

|
#29
Manhattan St
Michigan City, IN 46360
|
2,207 sq. feet
|
2 baths 3 beds |
show details | |

|
#30
King St
Gary, IN 46406
|
816 sq. feet
|
1 baths 2 beds |
show details |
| Photo | Address | Area | Beds / Baths | Price | Details |
|---|---|---|---|---|---|

|
#31
E Lake St
Griffith, IN 46319
|
1,344 sq. feet
|
1 baths 3 beds |
show details | |

|
#32
W 21st Ave
Gary, IN 46404
|
2,460 sq. feet
|
1 baths 4 beds |
show details | |

|
#33
Swanson Rd
Portage, IN 46368
|
1,284 sq. feet
|
2 baths 2 beds |
show details | |

|
#34
W 57th Ave
Merrillville, IN 46410
|
1,446 sq. feet
|
2 baths 3 beds |
show details | |

|
#35
Beverly Blvd
Hobart, IN 46342
|
2,173 sq. feet
|
1 baths 2 beds |
show details | |

|
#36
Rillstone Dr
Kouts, IN 46347
|
1,816 sq. feet
|
4 baths 4 beds |
show details | |

|
#37
Old Forge Rd
Valparaiso, IN 46385
|
1,920 sq. feet
|
2 baths 4 beds |
show details | |

|
#38
W 74th Ave
Merrillville, IN 46410
|
1,872 sq. feet
|
2 baths 3 beds |
show details | |

|
#39
Woodview Dr
Valparaiso, IN 46383
|
1,484 sq. feet
|
2 baths 3 beds |
show details | |

|
#40
New Jersey St
Gary, IN 46403
|
1,540 sq. feet
|
2 baths 4 beds |
show details |
| Photo | Address | Area | Beds / Baths | Price | Details |
|---|---|---|---|---|---|

|
#41
Arkansas Ave
Hammond, IN 46323
|
2,762 sq. feet
|
2 baths 3 beds |
show details | |

|
#42
16th St
Hobart, IN 46342
|
1,120 sq. feet
|
1 baths 2 beds |
show details | |

|
#43
Hunter Dr
Westville, IN 46391
|
2,988 sq. feet
|
2 baths 4 beds |
show details | |

|
#44
California St
Lake Station, IN 46405
|
920 sq. feet
|
1 baths 2 beds |
show details | |

|
#45
W 74th Pl
Merrillville, IN 46410
|
2,484 sq. feet
|
2 baths 3 beds |
show details | |

|
#46
W 57th Pl
Merrillville, IN 46410
|
2,200 sq. feet
|
1 baths 3 beds |
show details | |

|
#47
Mckinley St
Merrillville, IN 46410
|
2,236 sq. feet
|
1 baths 3 beds |
show details | |

|
#48
Evergreen St
Hobart, IN 46342
|
1,209 sq. feet
|
1 baths 3 beds |
show details | |

|
#49
Lincoln St
Gary, IN 46402
|
2,304 sq. feet
|
1 baths 2 beds |
show details | |

|
Check over 1 million property listings on Foreclosure.com!
|
browse all offers | |||


 | Portage Indiana (18 replies) |
| need help house hunting not successful in Valparaiso/Chesterton (11 replies) |
| Portage, IN: the "Gary/Hammond/E.C." of Porter County? (43 replies) |
| Possible move to NWI (33 replies) |
| Summer lake fun (8 replies) |
| Rental needed in Chesterton/Valparaiso (3 replies) |

Median year apartment built: 1974
Household type by relationship:
Households: 7,296- Male householders: 1,407 (275 living alone), Female householders: 1,366 (274 living alone)
1,396 spouses (1,376 opposite-sex spouses), 305 unmarried partners, (294 opposite-sex unmarried partners), 2,253 children (1,920 natural, 61 adopted, 271 stepchildren), 83 grandchildren, 57 brothers or sisters, 133 parents, 0 foster children, 109 other relatives, 168 non-relatives
- In group quarters: 15
Size of family households: 914 2-persons, 520 3-persons, 346 4-persons, 108 5-persons, 147 6-persons.
Size of nonfamily households: 612 1-person, 146 2-persons, 35 3-persons.
968 married couples with children.
571 single-parent households (322 men, 249 women).
97.1% of residents of South Haven speak English at home.
1.6% of residents speak Spanish at home (67% speak English very well, 7% speak English well, 21% speak English not well, 5% don't speak English at all).
0.1% of residents speak other Indo-European language at home (12% speak English very well, 88% speak English well).
0.1% of residents speak Asian or Pacific Island language at home (100% speak English very well).
Foreign born population: 85 (1.2%)
(44.7% of them are naturalized citizens)
| Here: | 6.2 |
| State: | 6.6 |
| Here: | 5.2 |
| State: | 4.3 |

- Bedrooms in owner-occupied houses and condos in South Haven, Indiana
- 0no bedroom
- 181 bedroom
- 422 bedrooms
- 1,3363 bedrooms
- 5754 bedrooms
- 605+ bedrooms

- Bedrooms in renter-occupied apartments in South Haven, Indiana
- 0no bedroom
- 631 bedroom
- 2032 bedrooms
- 3783 bedrooms
- 1644 bedrooms
- 05+ bedrooms

- Cars and other vehicles available in South Haven in owner-occupied houses/condos
- 0no vehicle
- 6161 vehicle
- 9502 vehicles
- 2693 vehicles
- 1634 vehicles
- 325+ vehicles

- Cars and other vehicles available in South Haven in renter-occupied apartments
- 31no vehicle
- 3021 vehicle
- 3762 vehicles
- 863 vehicles
- 54 vehicles
- 85+ vehicles

- Rooms in owner-occupied houses in South Haven, Indiana
- 01 room
- 02 rooms
- 213 rooms
- 554 rooms
- 4945 rooms
- 7496 rooms
- 3117 rooms
- 2548 rooms
- 1489+ rooms

- Rooms in renter-occupied apartments in South Haven, Indiana
- 01 room
- 02 rooms
- 933 rooms
- 1444 rooms
- 2355 rooms
- 2726 rooms
- 367 rooms
- 08 rooms
- 279+ rooms


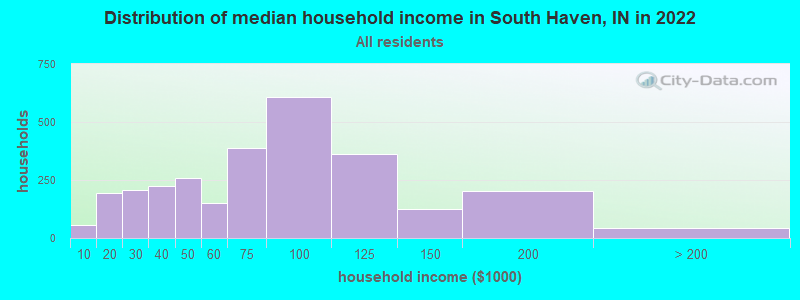
South Haven, IN household income distribution

- 56Less than $10,000
- 196$10,000 to $19,999
- 205$20,000 to $29,999
- 226$30,000 to $39,999
- 260$40,000 to $49,999
- 150$50,000 to $59,999
- 388$60,000 to $74,999
- 607$75,000 to $99,999
- 363$100,000 to $124,999
- 125$125,000 to $149,999
- 203$150,000 to $199,999
- 42$200,000 or more
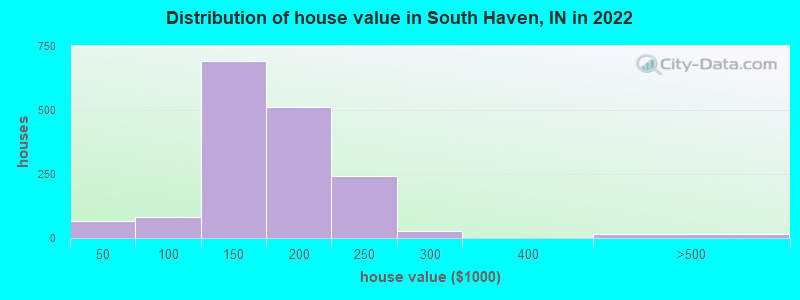
Home value of owner - occupied houses in 2022 in South Haven, IN
-
- 21$10,000 to $14,999
- 16$15,000 to $19,999
- 9$30,000 to $34,999
- 6$35,000 to $39,999
- 14$40,000 to $49,999
- 18$50,000 to $59,999
- 36$80,000 to $89,999
- 13$90,000 to $99,999
- 479$100,000 to $124,999
- 212$125,000 to $149,999
- 267$150,000 to $174,999
- 244$175,000 to $199,999
- 244$200,000 to $249,999
- 25$250,000 to $299,999
- 4$400,000 to $499,999
- 7$500,000 to $749,999
- 4$1,500,000 to $1,999,999
Rent paid by renters in 2022 in South Haven, IN
-
- 84$200 to $249
- 19$250 to $299
- 19$350 to $399
- 9$400 to $449
- 7$500 to $549
- 17$600 to $649
- 26$650 to $699
- 14$700 to $749
- 151$800 to $899
- 127$900 to $999
- 82$1,000 to $1,249
- 129$1,250 to $1,499
- 32$1,500 to $1,999
- 61No cash rent


Percentage of workers working in this county: 63.7%
Number of people working at home: 136 (3.9% of all workers)
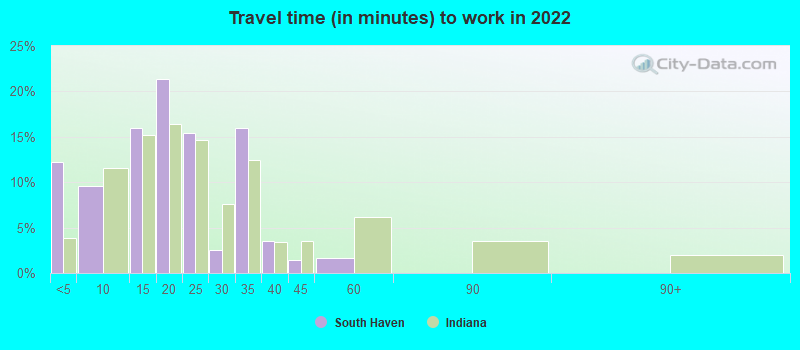
Travel time to work (commute)
- Less than 5 minutes: 47
- 5 to 9 minutes: 141
- 10 to 14 minutes: 470
- 15 to 19 minutes: 572
- 20 to 24 minutes: 483
- 25 to 29 minutes: 147
- 30 to 34 minutes: 1,007
- 35 to 39 minutes: 90
- 40 to 44 minutes: 85
- 45 to 59 minutes: 91
- 60 to 89 minutes: 186
- 90 or more minutes: 80
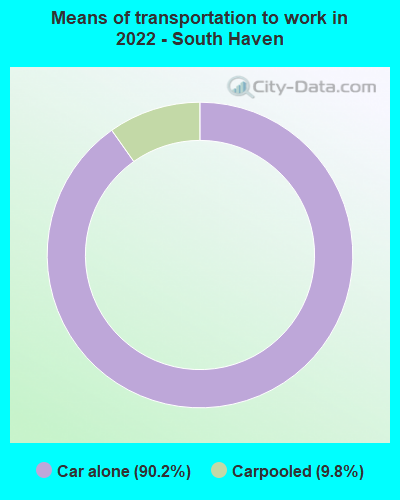
Means of transportation to work:
- Drove a car alone: 531 (85.1%)
- Carpooled: 65 (10.4%)

- Unemployment by race in 2022
- Unemployment rate for White non-Hispanic residents
- 5.5%Males
- 0.9%Females
- Unemployment rate for Black residents
- 12.2%Males
- 41.4%Females
- Unemployment rate for two or more race residents
- 7.2%Females

- Year of entry for the foreign-born population in South Haven, Indiana
- 512010 or later
- 02000 to 2009
- 101990 to 1999
- 01980 to 1989
- 01970 to 1979
- 52Before 1970

First ancestries reported:
- German: 314 (12.9%)
- English: 267 (10.9%)
- Polish: 209 (8.6%)
- American: 180 (7.4%)
- Irish: 163 (6.7%)
- European: 130 (5.3%)
- Italian: 107 (4.4%)
- Slovak: 83 (3.4%)
- Serbian: 46 (1.9%)
- Greek: 37 (1.5%)
- French Canadian: 26 (1.1%)
- Scottish: 18 (0.7%)
- British: 15 (0.6%)
- Dutch: 9 (0.4%)
- Scandinavian: 7 (0.3%)
- French: 6 (0.2%)
- Scotch-Irish: 5 (0.2%)
- Welsh: 5 (0.2%)
- Hungarian: 4 (0.2%)
- Slavic: 4 (0.2%)
Most common places of birth for foreign-born residents (%):
| South Haven: | 42.2% (43) |
| Indiana: | 27.0% (101,996) |
| South Haven: | 17.6% (18) |
| Indiana: | 0.8% (2,847) |
| South Haven: | 13.7% (14) |
| Indiana: | 2.1% (7,834) |
| South Haven: | 10.8% (11) |
| Indiana: | 0.1% (280) |
| South Haven: | 7.8% (8) |
| Indiana: | 0.1% (283) |
| South Haven: | 2.0% (2) |
| Indiana: | 3.1% (11,851) |
Place of birth for U.S.-born residents:
- This state: 5,258
- Other state: 1,948
- Northeast: 244
- Midwest: 895
- South: 539
- West: 183
85.9% of South Haven residents lived in the same house 1 years ago.
Out of people who lived in different houses, 41.4% lived in this county.
Out of people who lived in different counties, 68.7% lived in Indiana.
| South Haven: | 85.9% |
| State average: | 87.1% |
Education attainment for males 25 years and older:
- No schooling: 2
- Nursery to 4th grade: 0
- 5th and 6th grade: 0
- 7th and 8th grade: 11
- 9th grade: 73
- 10th grade: 70
- 11th grade: 57
- 12th grade, no diploma: 65
- High school graduate (or equivalency): 1,215
- Less than 1 year of college: 260
- Some college more than 1 year, no degree: 404
- Associate degree: 157
- Bachelor's degree: 167
- Master's degree: 41
- Professional school degree: 5
- Doctorate degree: 5

Education attainment for females 25 years and older:
- No schooling: 76
- Nursery to 4th grade: 0
- 5th and 6th grade: 8
- 7th and 8th grade: 9
- 9th grade: 33
- 10th grade: 5
- 11th grade: 28
- 12th grade, no diploma: 38
- High school graduate (or equivalency): 1,117
- Less than 1 year of college: 200
- Some college more than 1 year, no degree: 272
- Associate degree: 320
- Bachelor's degree: 257
- Master's degree: 90
- Professional school degree: 5
- Doctorate degree: 0


Housing units in structures:
- One, detached: 2,533
- One, attached: 113
- Two: 8
- 3 or 4: 21
- 5 to 9: 21
- 10 to 19: 194
- Mobile homes: 28
Housing units lacking complete kitchen facilities in 2022: 0.8%
House/condo owner moved in on average 21 years ago
Renter moved in on average 5 years ago

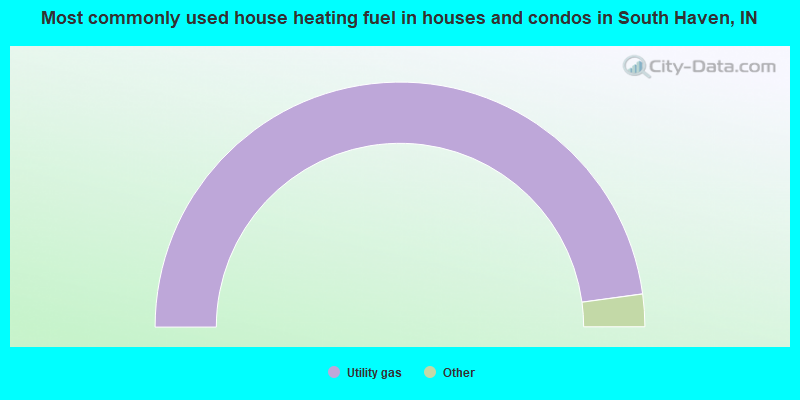
- 95.7%Utility gas
- 3.9%Electricity
- 0.3%Other fuel
- 0.2%No fuel used
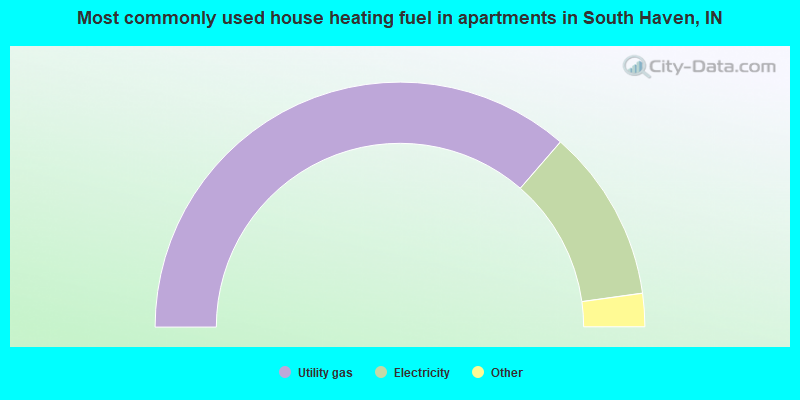
- 72.9%Utility gas
- 22.9%Electricity
- 2.8%Fuel oil, kerosene, etc.
- 1.4%No fuel used
Private vs. public school enrollment:
| Here: | 7.2% |
| Indiana: | 14.9% |
| Here: | 10.1% |
| Indiana: | 11.4% |
| Here: | 25.3% |
| Indiana: | 22.3% |


