South Miami Heights, FL (Florida) Houses and Residents
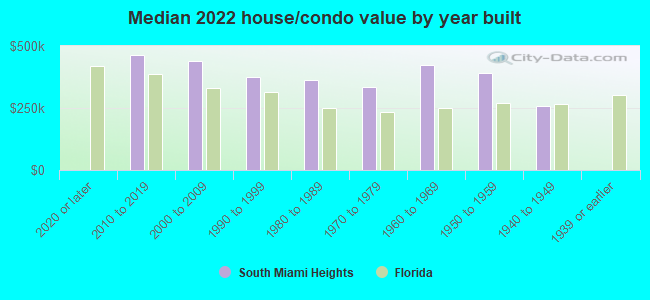
| South Miami Heights: | $381,967 |
| Florida: | $354,100 |
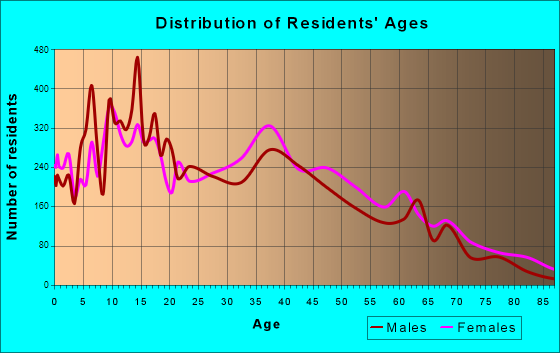
Total population: 35,696 (Urban population: 33,579, Rural population: 0)
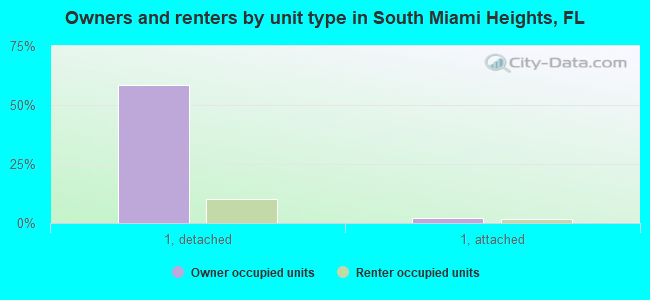
Houses: 12,102 (11,619 occupied: 7,557 owner occupied, 4,216 renter occupied)
| % of renters here: | 36% |
| State: | 33% |
Housing density: 2,455 houses/condos per square mile
Median price asked for vacant for-sale houses and condos in 2022: $594,970.
Median contract rent in 2022: $1,288 (lower quartile is $997, upper quartile is $1,555)
Median rent asked for vacant for-rent units in 2022: $1,583
Median gross rent in South Miami Heights, FL in 2022: $1,409
Housing units in South Miami Heights with a mortgage: 4,566 (186 second mortgage, 10 home equity loan, 116 both second mortgage and home equity loan)
Houses without a mortgage: 40
Median household income for houses/condos with a mortgage: $83,471
Median household income for apartments without a mortgage: $66,648
Median monthly housing costs: $1,338
Compare current foreclosures near South Miami Heights, FL:
| Photo | Address | Area | Beds / Baths | Price | Details |
|---|---|---|---|---|---|

|
#1
SW 122nd St
Miami, FL 33186
|
2,310 sq. feet
|
3 baths 4 beds |
show details | |

|
#2
SW 145th St
Miami, FL 33176
|
4,070 sq. feet
|
4 baths 4 beds |
show details | |

|
#3
NE 3rd Ct
Homestead, FL 33033
|
1,628 sq. feet
|
3 baths 4 beds |
show details | |

|
#4
SW 128th St
Miami, FL 33176
|
1,956 sq. feet
|
1 baths 3 beds |
show details | |

|
#5
SE 37th Pl
Homestead, FL 33033
|
2,732 sq. feet
|
3 baths 5 beds |
show details | |

|
#6
SW 194th Ave
Homestead, FL 33030
|
1,790 sq. feet
|
2 baths 3 beds |
show details | |

|
#7
SW 144th Ct
Miami, FL 33186
|
2,084 sq. feet
|
2 baths 4 beds |
show details | |

|
#8
SW 161st Ave
Miami, FL 33196
|
1,972 sq. feet
|
2 baths 3 beds |
show details | |

|
#9
SW 117th Ct
Miami, FL 33175
|
2,047 sq. feet
|
3 baths 4 beds |
show details | |

|
#10
SW 79th St # 7
Miami, FL 33143
|
768 sq. feet
|
1 baths 1 beds |
show details |
| Photo | Address | Area | Beds / Baths | Price | Details |
|---|---|---|---|---|---|

|
#11
SW 26th St
Miami, FL 33165
|
2,150 sq. feet
|
3 baths 3 beds |
show details | |

|
#12
SW 31st St
Miami, FL 33155
|
2,110 sq. feet
|
3 baths 3 beds |
show details | |

|
#13
SW 3rd Ave
Miami, FL 33145
|
1,666 sq. feet
|
3 baths 3 beds |
show details | |

|
#14
NW 10th Ave
Miami, FL 33128
|
2,973 sq. feet
|
1 baths 2 beds |
show details | |

|
#15
Harding Ln
Homestead, FL 33033
|
1,037 sq. feet
|
1 baths 2 beds |
show details | |

|
#16
SW 148th Pl
Miami, FL 33196
|
1,763 sq. feet
|
2 baths 3 beds |
show details | |

|
#17
SW 9th St
Miami, FL 33184
|
1,877 sq. feet
|
3 baths 4 beds |
show details | |

|
#18
SW 87th Pl Dr
Miami, FL 33165
|
1,545 sq. feet
|
2 baths 3 beds |
show details | |

|
#19
SW 154th Ct
Homestead, FL 33033
|
915 sq. feet
|
1 baths 2 beds |
show details | |

|
#20
SW 104th Ct
Miami, FL 33176
|
4,445 sq. feet
|
3 baths 4 beds |
show details |
| Photo | Address | Area | Beds / Baths | Price | Details |
|---|---|---|---|---|---|

|
#21
NW 42nd Ave Apt 407
Miami, FL 33126
|
958 sq. feet
|
2 baths 2 beds |
show details | |

|
#22
NW 136th Ct
Miami, FL 33182
|
2,605 sq. feet
|
2 baths 4 beds |
show details | |

|
#23
Marine Dr
Miami, FL 33189
|
2,198 sq. feet
|
3 baths 4 beds |
show details | |

|
#24
SW 153rd Ter
Miami, FL 33177
|
1,842 sq. feet
|
2 baths 4 beds |
show details | |

|
#25
SW 9th Ln
Miami, FL 33194
|
1,775 sq. feet
|
3 baths 3 beds |
show details | |

|
#26
- 830 NW 23rd Ct
Miami, FL 33125
|
- sq. feet
|
4 baths 6 beds |
show details | |

|
#27
SW 38th Ln
Miami, FL 33165
|
1,233 sq. feet
|
2 baths 2 beds |
show details | |

|
#28
-2922 SW 37 Ct
Miami, FL 33134
|
2,369 sq. feet
|
3 baths 5 beds |
show details | |

|
#29
SW 19th St
Miami, FL 33145
|
2,689 sq. feet
|
3 baths 5 beds |
show details | |

|
#30
SW 107th Pl
Miami, FL 33157
|
2,196 sq. feet
|
2 baths 3 beds |
show details |
| Photo | Address | Area | Beds / Baths | Price | Details |
|---|---|---|---|---|---|

|
#31
SW 148th Path
Miami, FL 33196
|
1,371 sq. feet
|
2 baths 3 beds |
show details | |

|
#32
SW 139th Ct
Miami, FL 33175
|
1,477 sq. feet
|
2 baths 3 beds |
show details | |

|
#33
NW 16th St
Homestead, FL 33030
|
1,496 sq. feet
|
2 baths 4 beds |
show details | |

|
#34
SW 58th Ave
Miami, FL 33155
|
1,563 sq. feet
|
2 baths 3 beds |
show details | |

|
#35
SW 251st St
Homestead, FL 33032
|
1,495 sq. feet
|
2 baths 4 beds |
show details | |

|
#36
SW 15th St
Miami, FL 33144
|
1,299 sq. feet
|
1 baths 1 beds |
show details | |

|
#37
SW 98th St
Miami, FL 33156
|
2,235 sq. feet
|
1 baths 3 beds |
show details | |

|
#38
SW 60th Ct
Miami, FL 33155
|
950 sq. feet
|
1 baths 2 beds |
show details | |

|
#39
SW 188th Ave
Homestead, FL 33034
|
693 sq. feet
|
1 baths 2 beds |
show details | |

|
#40
SW 115th Ave
Miami, FL 33165
|
864 sq. feet
|
1 baths 3 beds |
show details |
| Photo | Address | Area | Beds / Baths | Price | Details |
|---|---|---|---|---|---|

|
#41
NW 121st Ct
Miami, FL 33182
|
3,964 sq. feet
|
3 baths 4 beds |
show details | |

|
#42
SW 190th Ter
Miami, FL 33177
|
1,128 sq. feet
|
1 baths 3 beds |
show details | |

|
#43
SW 44th St
Miami, FL 33165
|
1,157 sq. feet
|
1 baths 2 beds |
show details | |

|
#44
Harrison St
Miami, FL 33176
|
1,706 sq. feet
|
1 baths 3 beds |
show details | |

|
#45
SW 17th St
Miami, FL 33155
|
1,041 sq. feet
|
1 baths 2 beds |
show details | |

|
#46
SW 64th Ave
Miami, FL 33144
|
1,247 sq. feet
|
1 baths 3 beds |
show details | |

|
#47
NW 6th Ln
Miami, FL 33182
|
1,562 sq. feet
|
2 baths 3 beds |
show details | |

|
#48
SW 154th Ave
Miami, FL 33185
|
110 sq. feet
|
2 baths 3 beds |
show details | |

|
#49
SW 99th Ct
Miami, FL 33165
|
1,518 sq. feet
|
1 baths 2 beds |
show details | |

|
Check over 1 million property listings on Foreclosure.com!
|
browse all offers | |||


Median year apartment built: 1983
Household type by relationship:
Households: 35,513- Male householders: 5,409 (1,035 living alone), Female householders: 5,934 (1,040 living alone)
5,577 spouses (5,546 opposite-sex spouses), 1,239 unmarried partners, (1,239 opposite-sex unmarried partners), 11,073 children (10,613 natural, 91 adopted, 368 stepchildren), 1,330 grandchildren, 463 brothers or sisters, 1,187 parents, 0 foster children, 1,724 other relatives, 1,219 non-relatives
- In group quarters: 353
Size of family households: 2,701 2-persons, 2,344 3-persons, 1,982 4-persons, 1,090 5-persons, 471 6-persons, 154 7-or-more-persons.
Size of nonfamily households: 2,224 1-person, 671 2-persons, 24 4-persons, 16 5-persons, 50 7-or-more-persons.
3,063 married couples with children.
2,560 single-parent households (773 men, 1,787 women).
27.1% of residents of South Miami Heights speak English at home.
70.7% of residents speak Spanish at home (41% speak English very well, 17% speak English well, 24% speak English not well, 18% don't speak English at all).
1.7% of residents speak other Indo-European language at home (88% speak English very well, 8% speak English well, 3% don't speak English at all).
0.7% of residents speak Asian or Pacific Island language at home (43% speak English very well, 47% speak English well, 10% speak English not well).
0.1% of residents speak other language at home (100% speak English very well).
Foreign born population: 19,480 (54.9%)
(59.2% of them are naturalized citizens)
| Here: | 5.6 |
| State: | 5.9 |
| Here: | 4.1 |
| State: | 4.2 |
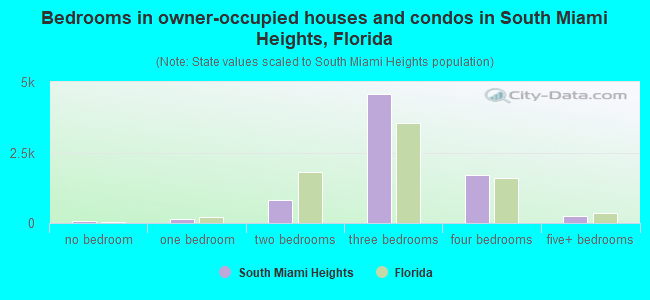
- Bedrooms in owner-occupied houses and condos in South Miami Heights, Florida
- 87no bedroom
- 1251 bedroom
- 8052 bedrooms
- 4,5743 bedrooms
- 1,7054 bedrooms
- 2615+ bedrooms
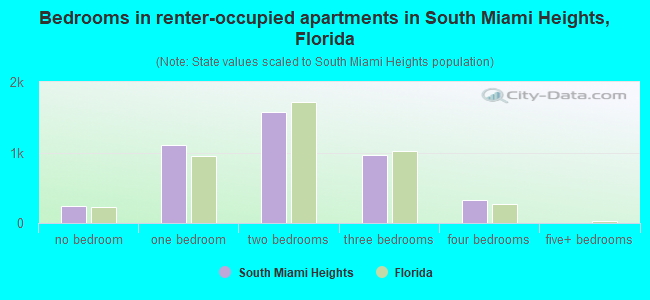
- Bedrooms in renter-occupied apartments in South Miami Heights, Florida
- 236no bedroom
- 1,1091 bedroom
- 1,5802 bedrooms
- 9653 bedrooms
- 3264 bedrooms
- 05+ bedrooms
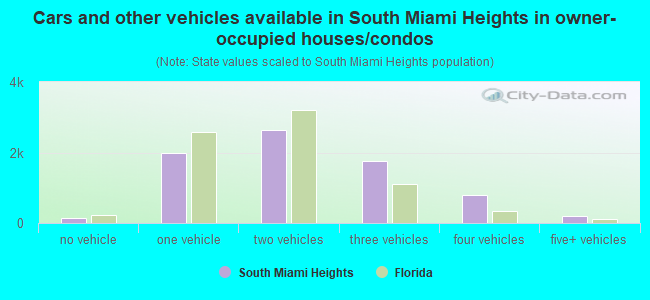
- Cars and other vehicles available in South Miami Heights in owner-occupied houses/condos
- 143no vehicle
- 1,9821 vehicle
- 2,6512 vehicles
- 1,7723 vehicles
- 7994 vehicles
- 2115+ vehicles
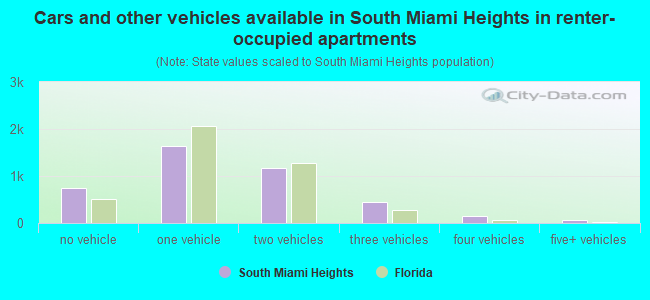
- Cars and other vehicles available in South Miami Heights in renter-occupied apartments
- 755no vehicle
- 1,6291 vehicle
- 1,1632 vehicles
- 4533 vehicles
- 1564 vehicles
- 605+ vehicles
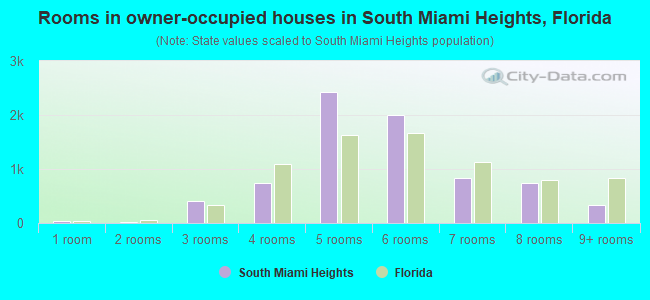
- Rooms in owner-occupied houses in South Miami Heights, Florida
- 391 room
- 202 rooms
- 4163 rooms
- 7384 rooms
- 2,4325 rooms
- 1,9956 rooms
- 8367 rooms
- 7468 rooms
- 3369+ rooms
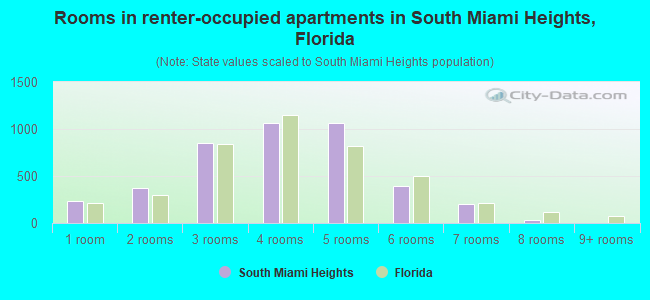
- Rooms in renter-occupied apartments in South Miami Heights, Florida
- 2361 room
- 3732 rooms
- 8513 rooms
- 1,0684 rooms
- 1,0685 rooms
- 3936 rooms
- 1977 rooms
- 298 rooms
- 09+ rooms
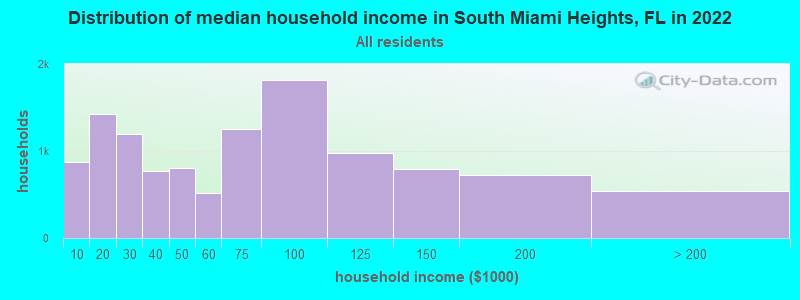
South Miami Heights, FL household income distribution

- 871Less than $10,000
- 1,428$10,000 to $19,999
- 1,191$20,000 to $29,999
- 769$30,000 to $39,999
- 805$40,000 to $49,999
- 514$50,000 to $59,999
- 1,248$60,000 to $74,999
- 1,821$75,000 to $99,999
- 980$100,000 to $124,999
- 793$125,000 to $149,999
- 722$150,000 to $199,999
- 538$200,000 or more
Home value of owner - occupied houses in 2022 in South Miami Heights, FL
-
- 137Less than $10,000
- 14$25,000 to $29,999
- 19$35,000 to $39,999
- 11$40,000 to $49,999
- 8$70,000 to $79,999
- 4$90,000 to $99,999
- 16$100,000 to $124,999
- 73$125,000 to $149,999
- 84$150,000 to $174,999
- 308$175,000 to $199,999
- 491$200,000 to $249,999
- 753$250,000 to $299,999
- 2,684$300,000 to $399,999
- 1,010$400,000 to $499,999
- 501$500,000 to $749,999
- 203$750,000 to $999,999
- 16$1,500,000 to $1,999,999
- 72$2,000,000 or more

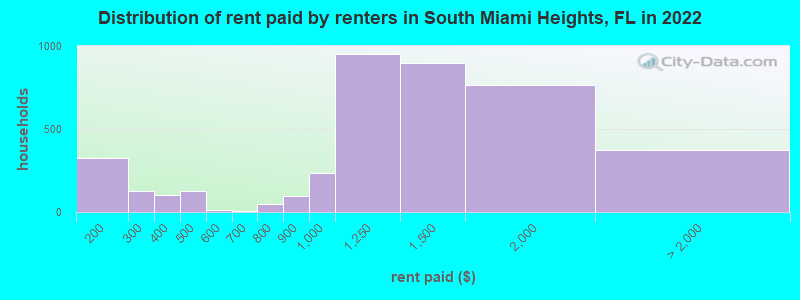
Rent paid by renters in 2022 in South Miami Heights, FL
-
- 34$100 to $149
- 292$150 to $199
- 102$200 to $249
- 22$250 to $299
- 72$300 to $349
- 30$350 to $399
- 113$400 to $449
- 13$450 to $499
- 12$550 to $599
- 8$650 to $699
- 50$700 to $749
- 96$800 to $899
- 235$900 to $999
- 951$1,000 to $1,249
- 898$1,250 to $1,499
- 764$1,500 to $1,999
- 248$2,000 to $2,499
- 125No cash rent
Percentage of workers working in this county: 97.3%
Number of people working at home: 1,420 (8.2% of all workers)
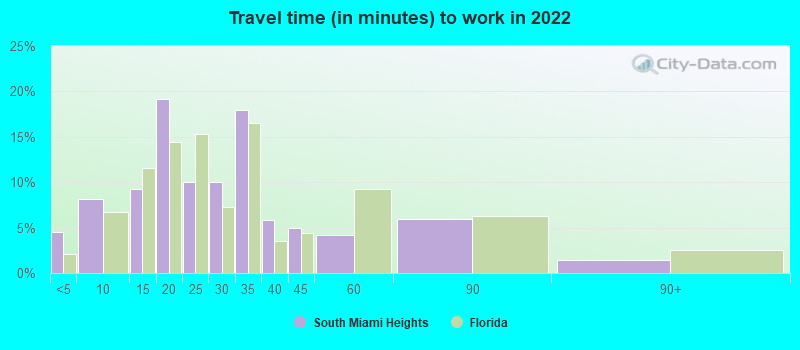
Travel time to work (commute)
- Less than 5 minutes: 252
- 5 to 9 minutes: 602
- 10 to 14 minutes: 841
- 15 to 19 minutes: 1,721
- 20 to 24 minutes: 1,984
- 25 to 29 minutes: 980
- 30 to 34 minutes: 2,215
- 35 to 39 minutes: 707
- 40 to 44 minutes: 1,336
- 45 to 59 minutes: 1,913
- 60 to 89 minutes: 1,953
- 90 or more minutes: 810
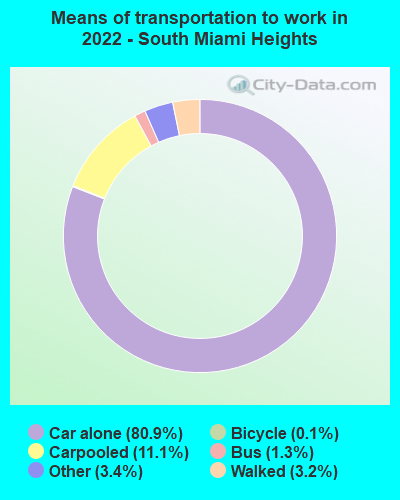
Means of transportation to work:
- Drove a car alone: 3,254 (61.2%)
- Carpooled: 501 (9.4%)
- Bus: 51 (1.0%)
- Taxi: 172 (3.2%)
- Bicycle: 5 (0.1%)
- Walked: 146 (2.7%)
- Worked at home: 1,420 (26.7%)
- Unemployment by race in 2022
- Unemployment rate for White non-Hispanic residents
- 0.8%Males
- 5.7%Females
- Unemployment rate for Black residents
- 5.1%Males
- 6.9%Females
- Unemployment rate for American Indian and Alaska Native residents
- 12.1%Males
- 30.8%Females
- Unemployment rate for Asian residents
- 11.1%Females
- Unemployment rate for other race residents
- 8.2%Males
- 1.8%Females
- Unemployment rate for two or more race residents
- 3.0%Males
- 3.5%Females
- Unemployment rate for Hispanic or Latino residents
- 4.8%Males
- 3.9%Females
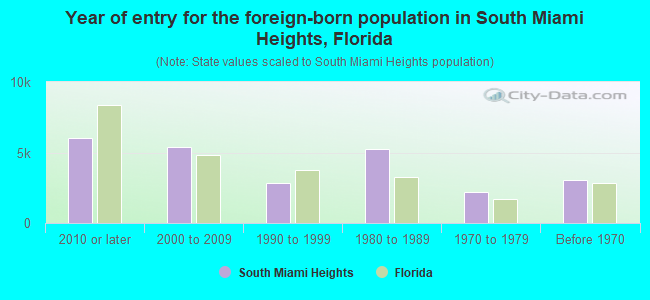
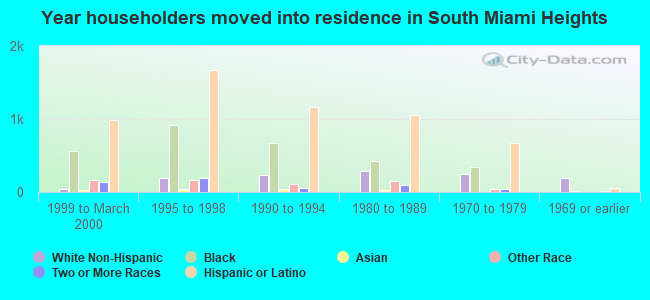
- Year of entry for the foreign-born population in South Miami Heights, Florida
- 6,0592010 or later
- 5,3672000 to 2009
- 2,8231990 to 1999
- 5,2461980 to 1989
- 2,1651970 to 1979
- 3,056Before 1970
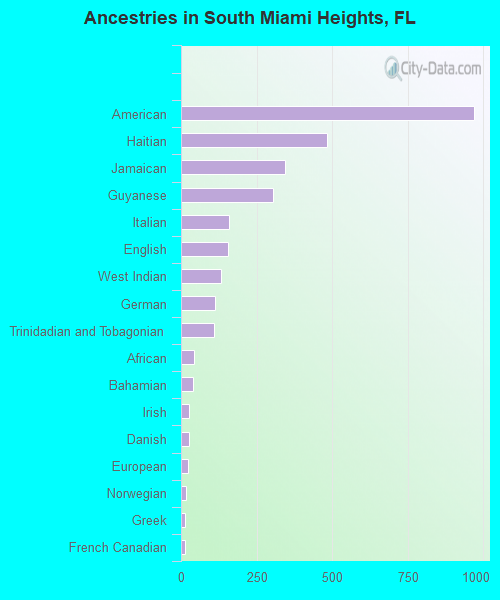
First ancestries reported:
- American: 970 (3.9%)
- Haitian: 484 (1.9%)
- Jamaican: 344 (1.4%)
- Guyanese: 303 (1.2%)
- Italian: 159 (0.6%)
- English: 157 (0.6%)
- West Indian: 132 (0.5%)
- German: 112 (0.4%)
- Trinidadian and Tobagonian: 110 (0.4%)
- African: 44 (0.2%)
- Bahamian: 40 (0.2%)
- Irish: 27 (0.1%)
- Danish: 26 (0.1%)
- European: 23 (0.09%)
- Norwegian: 15 (0.06%)
- Greek: 13 (0.05%)
- French Canadian: 12 (0.05%)
- Lebanese: 8 (0.03%)
- Dutch: 8 (0.03%)
- Portuguese: 8 (0.03%)
- Armenian: 7 (0.03%)
- Lithuanian: 6 (0.02%)
- Scotch-Irish: 6 (0.02%)
- Belizean: 6 (0.02%)
- Turkish: 3 (0.01%)
- Russian: 2 (0.01%)
Most common places of birth for foreign-born residents (%):
| South Miami Heights: | 59.3% (11,558) |
| Florida: | 22.0% (1,006,576) |
| South Miami Heights: | 6.6% (1,290) |
| Florida: | 6.5% (298,669) |
| South Miami Heights: | 3.8% (744) |
| Florida: | 0.7% (33,556) |
| South Miami Heights: | 3.4% (662) |
| Florida: | 2.3% (105,066) |
| South Miami Heights: | 3.4% (655) |
| Florida: | 5.6% (257,152) |
| South Miami Heights: | 3.0% (583) |
| Florida: | 2.3% (107,160) |
| South Miami Heights: | 2.7% (533) |
| Florida: | 1.1% (49,838) |
| South Miami Heights: | 2.4% (461) |
| Florida: | 3.0% (137,727) |
| South Miami Heights: | 2.0% (389) |
| Florida: | 5.0% (227,319) |
Place of birth for U.S.-born residents:
- This state: 11,729
- Other state: 2,907
- Northeast: 1,541
- Midwest: 277
- South: 894
- West: 170
91.2% of South Miami Heights residents lived in the same house 1 years ago.
Out of people who lived in different houses, 45.1% lived in this county.
Out of people who lived in different counties, 18.8% lived in Florida.
| South Miami Heights: | 91.2% |
| State average: | 86.3% |
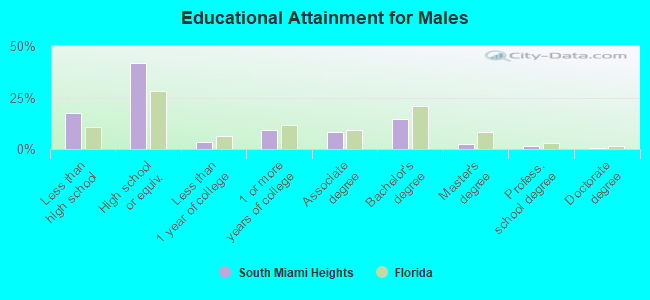
Education attainment for males 25 years and older:
- No schooling: 353
- Nursery to 4th grade: 104
- 5th and 6th grade: 309
- 7th and 8th grade: 319
- 9th grade: 326
- 10th grade: 193
- 11th grade: 163
- 12th grade, no diploma: 469
- High school graduate (or equivalency): 5,310
- Less than 1 year of college: 455
- Some college more than 1 year, no degree: 1,151
- Associate degree: 1,050
- Bachelor's degree: 1,873
- Master's degree: 314
- Professional school degree: 213
- Doctorate degree: 72
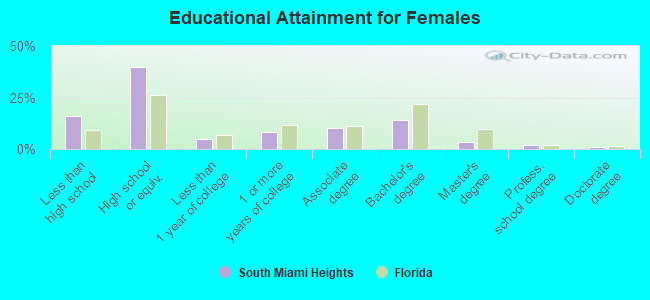
Education attainment for females 25 years and older:
- No schooling: 281
- Nursery to 4th grade: 205
- 5th and 6th grade: 274
- 7th and 8th grade: 322
- 9th grade: 403
- 10th grade: 99
- 11th grade: 83
- 12th grade, no diploma: 426
- High school graduate (or equivalency): 5,165
- Less than 1 year of college: 660
- Some college more than 1 year, no degree: 1,077
- Associate degree: 1,337
- Bachelor's degree: 1,849
- Master's degree: 412
- Professional school degree: 274
- Doctorate degree: 103
Housing units in structures:
- One, detached: 8,495
- One, attached: 428
- Two: 158
- 3 or 4: 78
- 5 to 9: 112
- 10 to 19: 195
- 20 to 49: 646
- 50 or more: 1,944
- Mobile homes: 40
Housing units lacking complete kitchen facilities in 2022: 0.5%
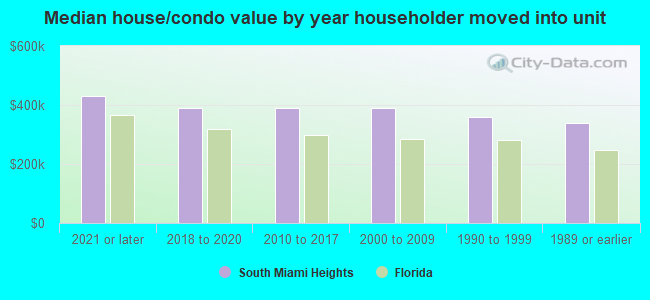
House/condo owner moved in on average 16 years ago
Renter moved in on average 3 years ago
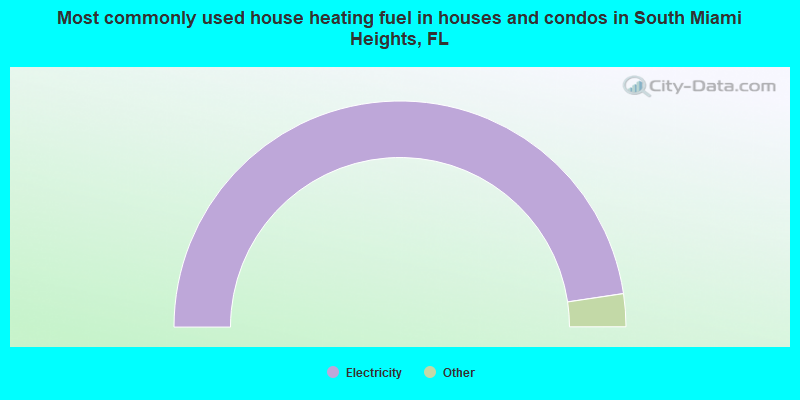
- 95.3%Electricity
- 2.7%Utility gas
- 1.4%No fuel used
- 0.3%Solar energy
- 0.2%Other fuel
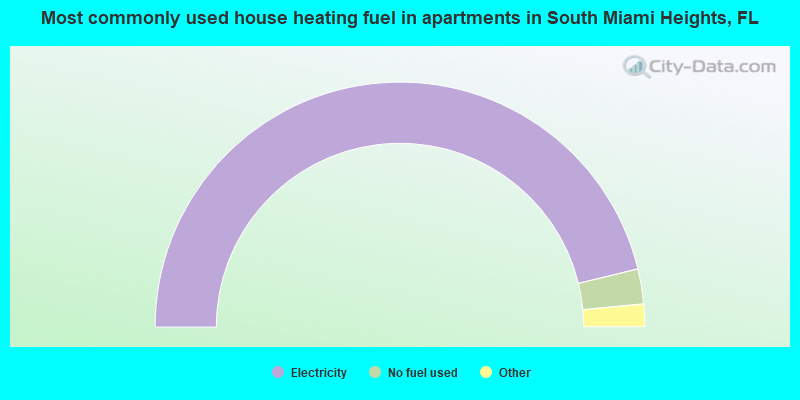
- 92.4%Electricity
- 4.6%No fuel used
- 2.1%Utility gas
- 0.7%Other fuel
- 0.2%Bottled, tank, or LP gas
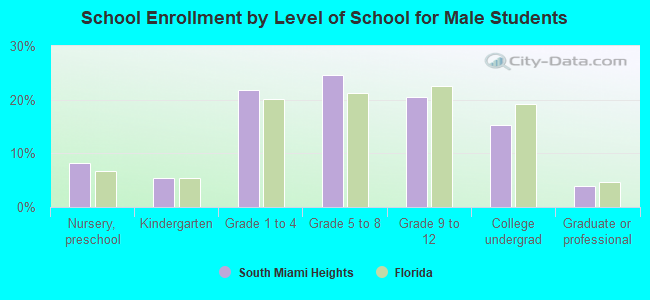
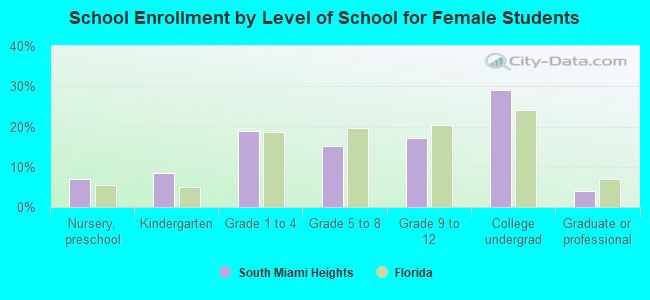
Private vs. public school enrollment:
| Here: | 9.9% |
| Florida: | 15.8% |
| Here: | 12.1% |
| Florida: | 12.9% |
| Here: | 30.0% |
| Florida: | 23.6% |