Housing density: 1,988 houses/condos per square mile
Median price asked for vacant for-sale houses and condos in 2022 in this county: $231,294.
Median contract rent in 2022: $1,656 (lower quartile is $1,375, upper quartile is over $2,000)
Median rent asked for vacant for-rent units in 2022: $1,537
Median gross rent in South Orange, NJ in 2022: $1,791
Housing units in South Orange with a mortgage: 2,786 (354 second mortgage, 438 home equity loan, 8 both second mortgage and home equity loan) Houses without a mortgage: 811
In family households: 645,040 (104,343 male householders, 84,996 female householders)
113,673 spouses, 245,726 children (232,723 natural, 5,793 adopted, 7,210 stepchildren), 20,627 grandchildren, 15,422 brothers or sisters, 11,923 parents, foster children, 19,910 other relatives, 22,762 non-relatives
In nonfamily households: 115,157 (42,135 male householders (33,262 living alone)), 52,238 female householders (45,266 living alone)), 20,784 nonrelatives
In group quarters: 23,772 (12,126 institutionalized population)
108,634 married couples with children.
65,899 single-parent households (10,059 men, 55,840 women).
80.5% of residents of South Orange speak English at home.
5.4% of residents speak Spanish at home (74% speak English very well, 11% speak English well, 10% speak English not well, 5% don't speak English at all).
9.1% of residents speak other Indo-European language at home (69% speak English very well, 18% speak English well, 12% speak English not well).
2.3% of residents speak Asian or Pacific Island language at home (64% speak English very well, 24% speak English well, 10% speak English not well, 2% don't speak English at all).
2.6% of residents speak other language at home (94% speak English very well, 6% speak English well).
Foreign born population: 4,248 (23.4%)
(58.7% of them are naturalized citizens)
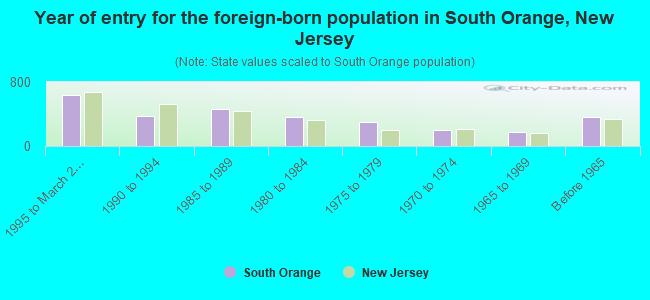
Year of entry for the foreign-born population in South Orange, New Jersey
6351995 to March 2000
3811990 to 1994
4621985 to 1989
3581980 to 1984
3041975 to 1979
1941970 to 1974
1761965 to 1969
359Before 1965
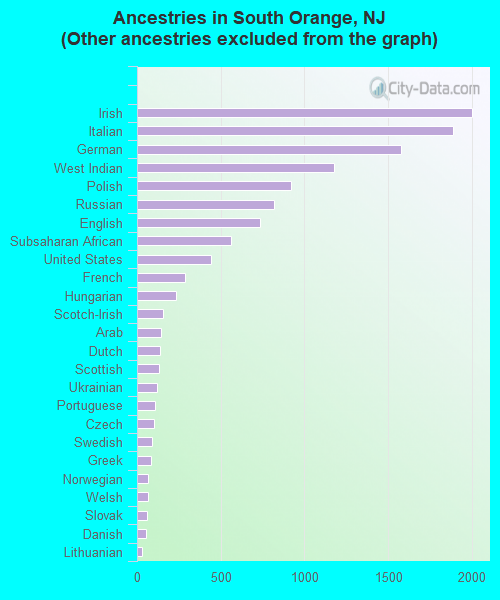
First ancestries reported:
Other: 6,518 (35.1%)
Irish: 2,003 (10.8%)
Italian: 1,887 (10.2%)
German: 1,580 (8.5%)
West Indian: 1,177 (6.3%)
Polish: 921 (5.0%)
Russian: 819 (4.4%)
English: 736 (4.0%)
Subsaharan African: 560 (3.0%)
United States: 442 (2.4%)
French: 285 (1.5%)
Hungarian: 235 (1.3%)
Scotch-Irish: 154 (0.8%)
Arab: 145 (0.8%)
Dutch: 140 (0.8%)
Scottish: 132 (0.7%)
Ukrainian: 120 (0.6%)
Portuguese: 110 (0.6%)
Czech: 100 (0.5%)
Swedish: 92 (0.5%)
Greek: 81 (0.4%)
Norwegian: 67 (0.4%)
Welsh: 63 (0.3%)
Slovak: 58 (0.3%)
Danish: 53 (0.3%)
Lithuanian: 27 (0.1%)
Swiss: 21 (0.1%)
French Canadian: 19 (0.1%)
Most common places of birth for foreign-born residents (%):
Haiti
South Orange:
13.7% (394)
New Jersey:
2.2% (31,963)
Jamaica
South Orange:
9.7% (277)
New Jersey:
2.5% (36,443)
Nigeria
South Orange:
5.8% (165)
New Jersey:
0.6% (8,389)
Guyana
South Orange:
4.9% (140)
New Jersey:
1.2% (17,746)
Mexico
South Orange:
4.0% (116)
New Jersey:
4.6% (67,667)
Germany
South Orange:
4.0% (115)
New Jersey:
2.3% (33,531)
United Kingdom
South Orange:
3.7% (106)
New Jersey:
2.1% (30,355)
Italy
South Orange:
3.6% (103)
New Jersey:
4.0% (58,395)
Trinidad and Tobago
South Orange:
3.1% (88)
New Jersey:
0.9% (13,289)
Canada
South Orange:
2.8% (79)
New Jersey:
1.1% (16,333)
Philippines
South Orange:
2.6% (76)
New Jersey:
4.7% (69,773)
Taiwan
South Orange:
2.5% (71)
New Jersey:
1.2% (18,066)
India
South Orange:
2.3% (67)
New Jersey:
8.1% (119,497)
Brazil
South Orange:
1.7% (48)
New Jersey:
1.5% (22,097)
China, excluding Hong Kong and Taiwan
South Orange:
1.6% (45)
New Jersey:
2.7% (40,092)
Place of birth for U.S.-born residents:
This state: 7,639
Other state: 6,286
Northeast: 4,184
Midwest: 680
South: 1,123
West: 299
60% of South Orange residents lived in the same house 5 years ago. Out of people who lived in different houses, 46% lived in this county. Out of people who lived in different counties, 41% lived in New Jersey.
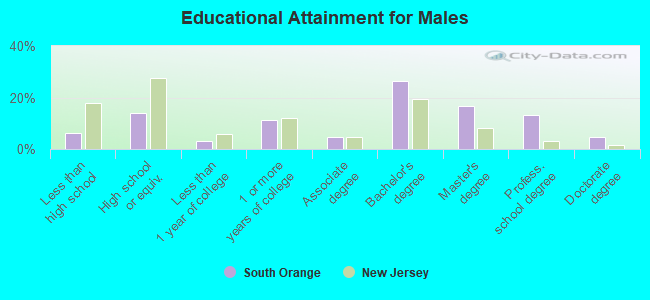
Education attainment for males 25 years and older:
No schooling: 18
Nursery to 4th grade: 19
5th and 6th grade: 14
7th and 8th grade: 57
9th grade: 43
10th grade: 47
11th grade: 36
12th grade, no diploma: 70
High school graduate (or equivalency): 680
Less than 1 year of college: 143
Some college more than 1 year, no degree: 552
Associate degree: 225
Bachelor's degree: 1,294
Master's degree: 813
Professional school degree: 641
Doctorate degree: 226
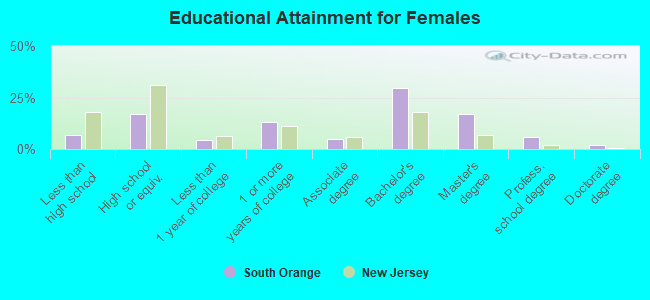
Education attainment for females 25 years and older:
No schooling: 27
Nursery to 4th grade: 11
5th and 6th grade: 39
7th and 8th grade: 63
9th grade: 25
10th grade: 85
11th grade: 42
12th grade, no diploma: 83
High school graduate (or equivalency): 930
Less than 1 year of college: 231
Some college more than 1 year, no degree: 719
Associate degree: 254
Bachelor's degree: 1,621
Master's degree: 918
Professional school degree: 320
Doctorate degree: 105
Housing units in structures:
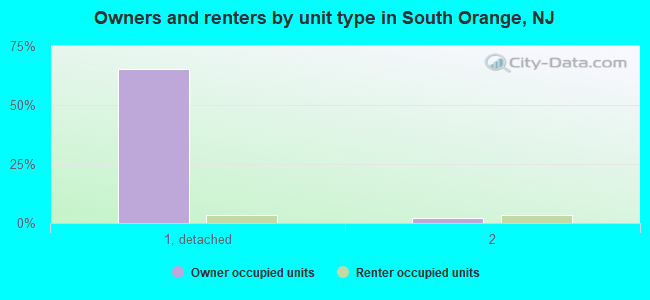
One, detached: 3,841
One, attached: 104
Two: 292
3 or 4: 131
5 to 9: 91
10 to 19: 253
20 to 49: 635
50 or more: 311
Mobile homes: 13
Housing units lacking complete plumbing facilities: 0.2%
Housing units lacking complete kitchen facilities: 0.4%