South St. Paul, MN (Minnesota) Houses and Residents
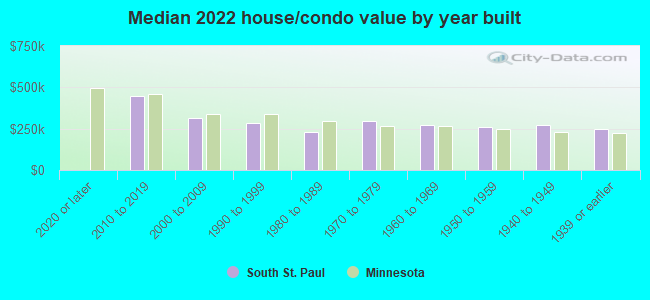
Estimated median house or condo value in 2022: $266,937 (it was $110,700 in 2000 )
South St. Paul:
$266,937Minnesota:
$314,600
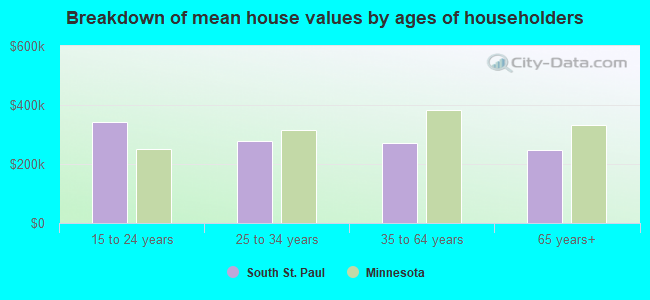
Lower value quartile - upper value quartile: $218,060 - $315,250Mean price in 2022: Detached houses: $278,073 Here:
$278,073State:
$374,552
Townhouses or other attached units: $311,113 Here:
$311,113State:
$312,049
In 2-unit structures: $268,574 Here:
$268,574State:
$323,045
In 5-or-more-unit structures: $273,635 Here:
$273,635State:
$258,516
Mobile homes: $12,818 Here:
$12,818State:
$94,605
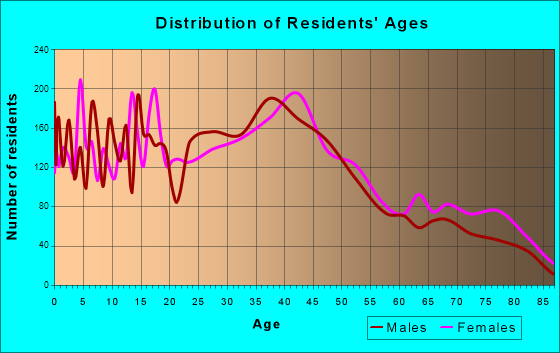
Total population: 20,487 (Urban population: 20,192, Rural population: 0)
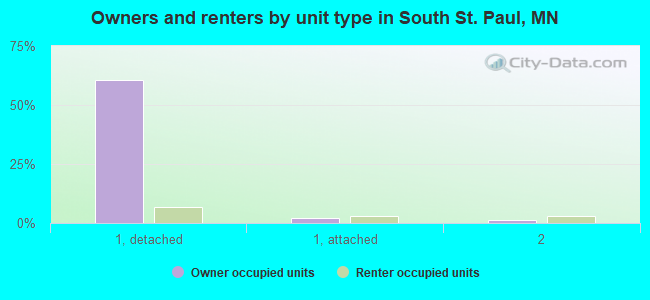
Houses: 8,666 (8,508 occupied: 6,075 owner occupied, 2,466 renter occupied )
% of renters here:
29%State:
28%
Housing density: 1,511 houses/condos per square mile
Median price asked for vacant for-sale houses and condos in 2022 in this county: $334,999.
Median contract rent in 2022: $999 (lower quartile is $728, upper quartile is $1,226)
Median rent asked for vacant for-rent units in 2022: $3,221
Median gross rent in South St. Paul, MN in 2022: $1,131
Housing units in South St. Paul with a mortgage: 4,085 (431 second mortgage, 10 home equity loan, 302 both second mortgage and home equity loan )Houses without a mortgage: 81
Median household income for houses/condos with a mortgage: $100,643
Median household income for apartments without a mortgage: $83,779
Median monthly housing costs: $1,275
Data:
Median house or condo value ($)
Median house or condo value ($ change since 2000)
Median house or condo value ($) - White
Median house or condo value ($) - Black or African American
Median house or condo value ($) - Asian
Median house or condo value ($) - Hispanic or Latino
Median house or condo value ($) - American Indian and Alaska Native
Median house or condo value ($) - Multirace
Median house or condo value ($) - Other Race
Median price asked for mobile homes ($)
Household density (households per square mile)
Mean house or condo value by units in structure - 1, detached ($)
Mean house or condo value by units in structure - 1, attached ($)
Mean house or condo value by units in structure - 2 ($)
Mean house or condo value by units in structure by units in structure - 3 or 4 ($)
Mean house or condo value by units in structure - 5 or more ($)
Mean house or condo value by units in structure - Boat, RV, van, etc. ($)
Mean house or condo value by units in structure - Mobile home ($)
Median contract rent ($)
Median contract rent - Lower quartile ($)
Median contract rent - Upper quartile ($)
Median gross rent ($)
Urban houses (%)
Rural houses (%)
Houses occupied (%)
Houses occupied (% change since 2000)
Houses owner occupied (%)
Houses owner occupied (% change since 2000)
Houses renter occupied (%)
Houses renter occupied (% change since 2000)
Vacant housing units - For rent (%)
Vacant housing units - For rent (% change since 2000)
Vacant housing units - For sale only (%)
Vacant housing units - For sale only (% change since 2000)
Vacant housing units - Rented or sold, not occupied (%)
Vacant housing units - Rented or sold, not occupied (% change since 2000)
Vacant housing units - For seasonal, recreational, or occasional use (%)
Vacant housing units - For seasonal, recreational, or occasional use (% change since 2000)
Vacant housing units - For migrant workers (%)
Vacant housing units - For migrant workers (% change since 2000)
Vacant housing units - Other vacant (%)
Vacant housing units - Other vacant (% change since 2000)
Median monthly housing costs ($)
Median household income for houses/condos with a mortgage ($)
Median household income for houses/condos without a mortgage ($)
Median household income ($)
Median household income ($) - White
Median household income ($) - Black or African American
Median household income ($) - Asian
Median household income ($) - Hispanic or Latino
Median household income ($) - American Indian and Alaska Native
Median household income ($) - Multirace
Median household income ($) - Other Race
Mortgage status - with mortgage (%)
Mortgage status - with second mortgage (%)
Mortgage status - with home equity loan (%)
Mortgage status - with both second mortgage and home equity loan (%)
Mortgage status - without a mortgage (%)
Median year house/condo built
Median year apartment built
Household type by relationship - Male householder living alone (%)
Household type by relationship - Male householder not living alone (%)
Household type by relationship - Female householder living alone (%)
Household type by relationship - Female householder not living alone (%)
Household type by relationship - Opposite-Sex spouse (%)
Household type by relationship - Same-Sex spouse (%)
Household type by relationship - Opposite-Sex unmarried partner (%)
Household type by relationship - Same-Sex unmarried partner (%)
Household type by relationship - In group quarters (%)
Size of family households - 2-person household (%)
Size of family households - 3-person household (%)
Size of family households - 4-person household (%)
Size of family households - 5-person household (%)
Size of family households - 6-person household (%)
Size of family households - 7-or-more-person household (%)
Size of nonfamily households - 1-person household (%)
Size of nonfamily households - 2-person household (%)
Size of nonfamily households - 3-person household (%)
Size of nonfamily households - 4-person household (%)
Size of nonfamily households - 5-person household (%)
Size of nonfamily households - 6-person household (%)
Size of nonfamily households - 7-or-moreperson household (%)
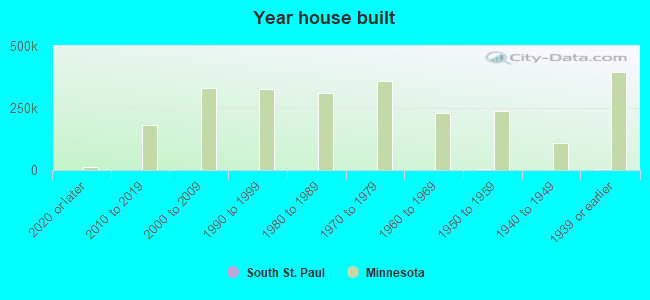
Year house built - Built 2010 or later (%)
Year house built - Built 2000 to 2009 (%)
Year house built - Built 1990 to 1999 (%)
Year house built - Built 1980 to 1989 (%)
Year house built - Built 1970 to 1979 (%)
Year house built - Built 1960 to 1969 (%)
Year house built - Built 1950 to 1959 (%)
Year house built - Built 1940 to 1949 (%)
Year house built - Built 1939 or earlier (%)
Median number of rooms in houses and condos
Median number of rooms in apartments
Median number of bedrooms in owner occupied houses
Mean number of bedrooms in owner occupied houses
Median number of bedrooms in renter occupied houses
Mean number of bedrooms in renter occupied houses
Median number of vehichles in owner occupied houses
Mean number of vehichles in owner occupied houses
Median number of vehichles in renter occupied houses
Mean number of vehichles in renter occupied houses
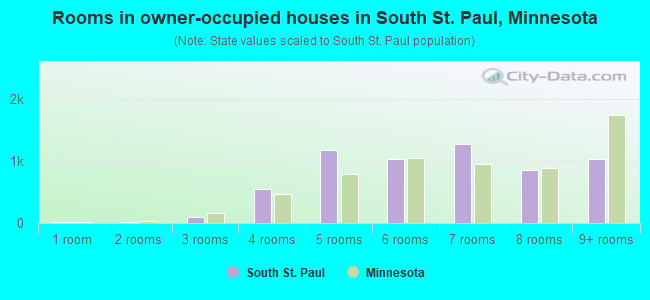
Rooms in owner-occupied houses - 1 room (%)
Rooms in owner-occupied houses - 2 rooms (%)
Rooms in owner-occupied houses - 3 rooms (%)
Rooms in owner-occupied houses - 4 rooms (%)
Rooms in owner-occupied houses - 5 rooms (%)
Rooms in owner-occupied houses - 6 rooms (%)
Rooms in owner-occupied houses - 7 rooms (%)
Rooms in owner-occupied houses - 8 rooms (%)
Rooms in owner-occupied houses - 9+ rooms (%)
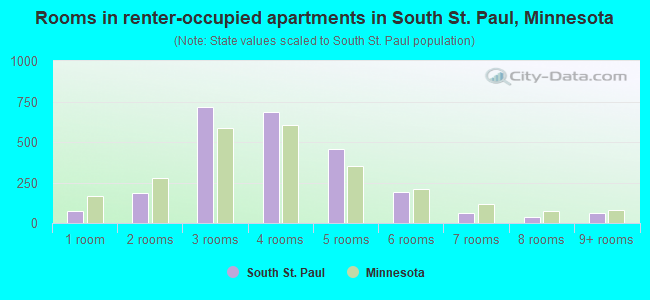
Rooms in renter-occupied houses - 1 room (%)
Rooms in renter-occupied houses - 2 rooms (%)
Rooms in renter-occupied houses - 3 rooms (%)
Rooms in renter-occupied houses - 4 rooms (%)
Rooms in renter-occupied houses - 5 rooms (%)
Rooms in renter-occupied houses - 6 rooms (%)
Rooms in renter-occupied houses - 7 rooms (%)
Rooms in renter-occupied houses - 8 rooms (%)
Rooms in renter-occupied houses - 9+ rooms (%)
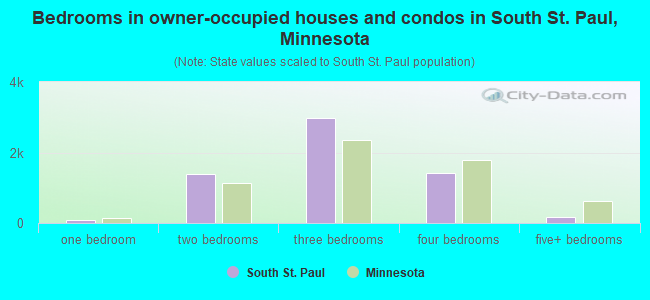
Bedrooms in owner-occupied houses - no bedrooms (%)
Bedrooms in owner-occupied houses - 1 bedroom (%)
Bedrooms in owner-occupied houses - 2 bedrooms (%)
Bedrooms in owner-occupied houses - 3 bedrooms (%)
Bedrooms in owner-occupied houses - 4 bedrooms (%)
Bedrooms in owner-occupied houses - 5+ bedrooms (%)
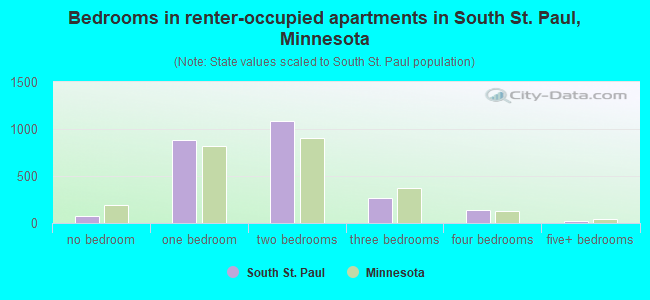
Bedrooms in renter-occupied houses - no bedrooms (%)
Bedrooms in renter-occupied houses - 1 bedroom (%)
Bedrooms in renter-occupied houses - 2 bedrooms (%)
Bedrooms in renter-occupied houses - 3 bedrooms (%)
Bedrooms in renter-occupied houses - 4 bedrooms (%)
Bedrooms in renter-occupied houses - 5+ bedrooms (%)
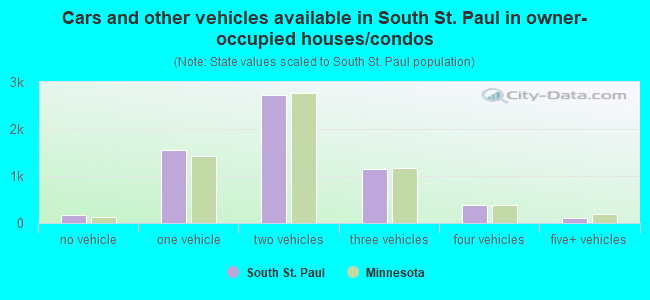
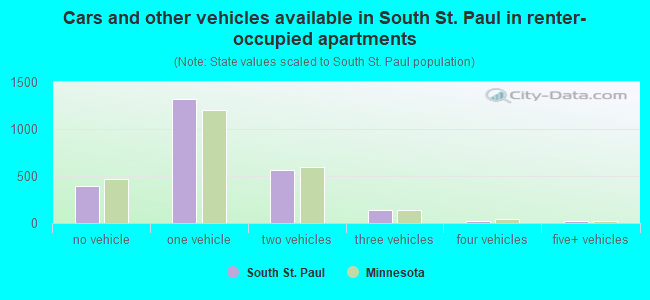
Vehicles available in owner-occupied houses - no vehicle available (%)
Vehicles available in owner-occupied houses - 1 vehicle available(%)
Vehicles available in owner-occupied houses - 2 Vehicles available (%)
Vehicles available in owner-occupied houses - 3 Vehicles available (%)
Vehicles available in owner-occupied houses - 4 Vehicles available (%)
Vehicles available in owner-occupied houses - 5+ Vehicles available (%)
Vehicles available in renter-occupied houses - no vehicle available (%)
Vehicles available in renter-occupied houses - 1 vehicle available (%)
Vehicles available in renter-occupied houses - 2 Vehicles available (%)
Vehicles available in renter-occupied houses - 3 Vehicles available (%)
Vehicles available in renter-occupied houses - 4 Vehicles available (%)
Vehicles available in renter-occupied houses - 5+ Vehicles available (%)
Housing units in structures - 1, detached (%)
Housing units in structures - 1, attached (%)
Housing units in structures - 2 (%)
Housing units in structures - 3 or 4 (%)
Housing units in structures - 5 to 9 (%)
Housing units in structures - 10 to 19 (%)
Housing units in structures - 20 to 49 (%)
Housing units in structures - 50 or more (%)
Housing units in structures - Mobile home (%)
Housing units in structures - Boat, RV, van, etc. (%)
Housing units in structures - Owners - 1, detached (%)
Housing units in structures - Owners - 1, attached (%)
Housing units in structures - Owners - 2 (%)
Housing units in structures - Owners - 3 or 4 (%)
Housing units in structures - Owners - 5 to 9 (%)
Housing units in structures - Owners - 10 to 19 (%)
Housing units in structures - Owners - 20 to 49 (%)
Housing units in structures - Owners - 50 or more (%)
Housing units in structures - Owners - Mobile home (%)
Housing units in structures - Owners - Boat, RV, van, etc. (%)
Housing units in structures - Renters - 1, detached (%)
Housing units in structures - Renters - 1, attached (%)
Housing units in structures - Renters - 2 (%)
Housing units in structures - Renters - 3 or 4 (%)
Housing units in structures - Renters - 5 to 9 (%)
Housing units in structures - Renters - 10 to 19 (%)
Housing units in structures - Renters - 20 to 49 (%)
Housing units in structures - Renters - 50 or more (%)
Housing units in structures - Renters - Mobile home (%)
Housing units in structures - Renters - Boat, RV, van, etc. (%)
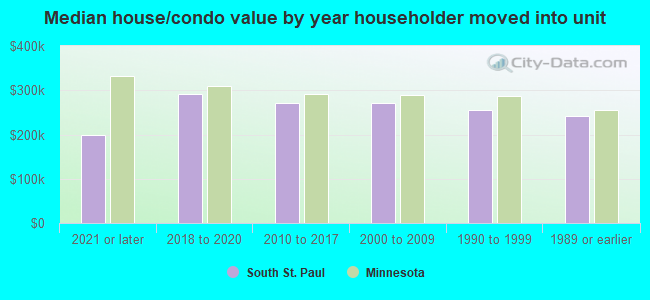
House/condo owner moved in on average (years ago)
Renter moved in on average (years ago)
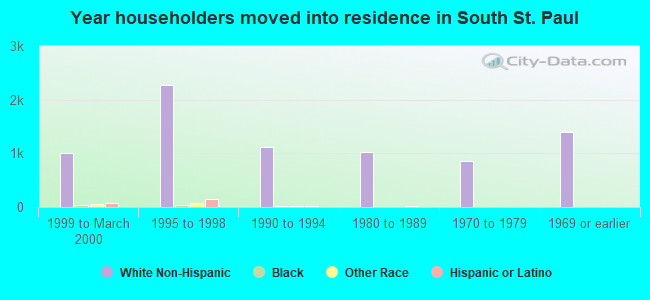
Year householder moved into unit - Moved in 1999 to March 2000 (%)
Year householder moved into unit - Moved in 1999 to March 2000 (%) - White
Year householder moved into unit - Moved in 1999 to March 2000 (%) - Black or African American
Year householder moved into unit - Moved in 1999 to March 2000 (%) - Asian
Year householder moved into unit - Moved in 1999 to March 2000 (%) - Hispanic or Latino
Year householder moved into unit - Moved in 1999 to March 2000 (%) - American Indian and Alaska Native
Year householder moved into unit - Moved in 1999 to March 2000 (%) - Multirace
Year householder moved into unit - Moved in 1999 to March 2000 (%) - Other Race
Year householder moved into unit - Moved in 1995 to 1998 (%)
Year householder moved into unit - Moved in 1995 to 1998 (%) - White
Year householder moved into unit - Moved in 1995 to 1998 (%) - Black or African American
Year householder moved into unit - Moved in 1995 to 1998 (%) - Asian
Year householder moved into unit - Moved in 1995 to 1998 (%) - Hispanic or Latino
Year householder moved into unit - Moved in 1995 to 1998 (%) - American Indian and Alaska Native
Year householder moved into unit - Moved in 1995 to 1998 (%) - Multirace
Year householder moved into unit - Moved in 1995 to 1998 (%) - Other Race
Year householder moved into unit - Moved in 1990 to 1994 (%)
Year householder moved into unit - Moved in 1990 to 1994 (%) - White
Year householder moved into unit - Moved in 1990 to 1994 (%) - Black or African American
Year householder moved into unit - Moved in 1990 to 1994 (%) - Asian
Year householder moved into unit - Moved in 1990 to 1994 (%) - Hispanic or Latino
Year householder moved into unit - Moved in 1990 to 1994 (%) - American Indian and Alaska Native
Year householder moved into unit - Moved in 1990 to 1994 (%) - Multirace
Year householder moved into unit - Moved in 1990 to 1994 (%) - Other Race
Year householder moved into unit - Moved in 1980 to 1989 (%)
Year householder moved into unit - Moved in 1980 to 1989 (%) - White
Year householder moved into unit - Moved in 1980 to 1989 (%) - Black or African American
Year householder moved into unit - Moved in 1980 to 1989 (%) - Asian
Year householder moved into unit - Moved in 1980 to 1989 (%) - Hispanic or Latino
Year householder moved into unit - Moved in 1980 to 1989 (%) - American Indian and Alaska Native
Year householder moved into unit - Moved in 1980 to 1989 (%) - Multirace
Year householder moved into unit - Moved in 1980 to 1989 (%) - Other Race
Year householder moved into unit - Moved in 1970 to 1979 (%)
Year householder moved into unit - Moved in 1970 to 1979 (%) - White
Year householder moved into unit - Moved in 1970 to 1979 (%) - Black or African American
Year householder moved into unit - Moved in 1970 to 1979 (%) - Asian
Year householder moved into unit - Moved in 1970 to 1979 (%) - Hispanic or Latino
Year householder moved into unit - Moved in 1970 to 1979 (%) - American Indian and Alaska Native
Year householder moved into unit - Moved in 1970 to 1979 (%) - Multirace
Year householder moved into unit - Moved in 1970 to 1979 (%) - Other Race
Year householder moved into unit - Moved in 1969 or earlier (%)
Year householder moved into unit - Moved in 1969 or earlier (%) - White
Year householder moved into unit - Moved in 1969 or earlier (%) - Black or African American
Year householder moved into unit - Moved in 1969 or earlier (%) - Asian
Year householder moved into unit - Moved in 1969 or earlier (%) - Hispanic or Latino
Year householder moved into unit - Moved in 1969 or earlier (%) - American Indian and Alaska Native
Year householder moved into unit - Moved in 1969 or earlier (%) - Multirace
Year householder moved into unit - Moved in 1969 or earlier (%) - Other Race
Housing units lacking complete plumbing facilities (%)
Housing units lacking complete kitchen facilities (%)
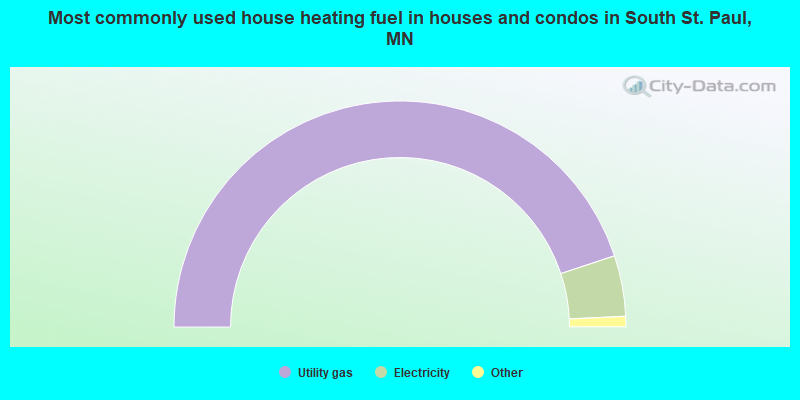
House heating fuel used in houses and condos - Utility gas (%)
House heating fuel used in houses and condos - Bottled, tank, or LP gas (%)
House heating fuel used in houses and condos - Electricity (%)
House heating fuel used in houses and condos - Fuel oil, kerosene, etc. (%)
House heating fuel used in houses and condos - Coal or coke (%)
House heating fuel used in houses and condos - Wood (%)
House heating fuel used in houses and condos - Solar energy (%)
House heating fuel used in houses and condos - Other fuel (%)
House heating fuel used in houses and condos - No fuel used (%)
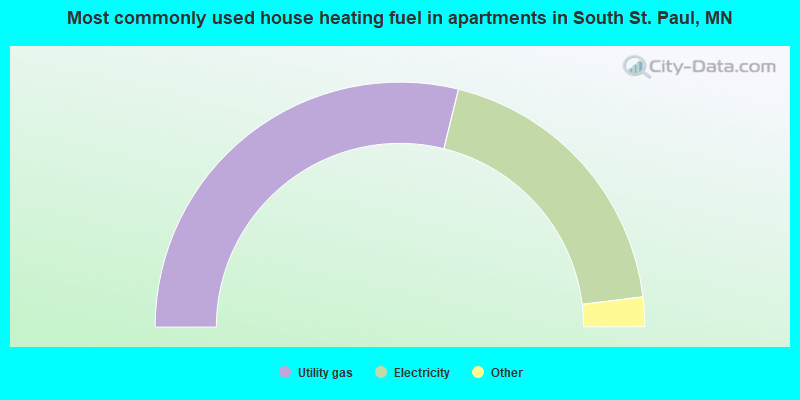
House heating fuel used in apartments - Utility gas (%)
House heating fuel used in apartments - Bottled, tank, or LP gas (%)
House heating fuel used in apartments - Electricity (%)
House heating fuel used in apartments - Fuel oil, kerosene, etc. (%)
House heating fuel used in apartments - Coal or coke (%)
House heating fuel used in apartments - Wood (%)
House heating fuel used in apartments - Solar energy (%)
House heating fuel used in apartments - Other fuel (%)
House heating fuel used in apartments - No fuel used (%)
Median year house/condo built: 1955Median year apartment built: 1970Household type by relationship:
Households: 20,793
Male householders: 3,854 (1,117 living alone ), Female householders: 4,487 (1,426 living alone )3,511 spouses (3,387 opposite-sex spouses ), 820 unmarried partners , (802 opposite-sex unmarried partners ), 5,996 children (5,683 natural , 79 adopted , 233 stepchildren ), 404 grandchildren , 250 brothers or sisters , 244 parents , 12 foster children , 369 other relatives , 693 non-relatives In group quarters: 148
Size of family households: 2,344 2-persons , 1,182 3-persons , 887 4-persons , 380 5-persons , 328 6-persons , 77 7-or-more-persons .
Size of nonfamily households: 2,555 1-person , 732 2-persons , 95 3-persons , 14 4-persons .
2,452 married couples with children. single-parent households (305 men , 1,055 women ).
85.1% of residents of South St. Paul speak English at home. of residents speak Spanish at home (45% speak English very well , 27% speak English well , 24% speak English not well , 3% don't speak English at all ).of residents speak other Indo-European language at home (98% speak English very well , 2% speak English well ).of residents speak Asian or Pacific Island language at home (67% speak English very well , 24% speak English well , 6% speak English not well , 3% don't speak English at all ).of residents speak other language at home (78% speak English very well , 10% speak English well , 12% speak English not well ).
Foreign born population: 1,579 (7.6%)of them are naturalized citizens )
Median number of rooms in houses and condos:
Median number of rooms in apartments
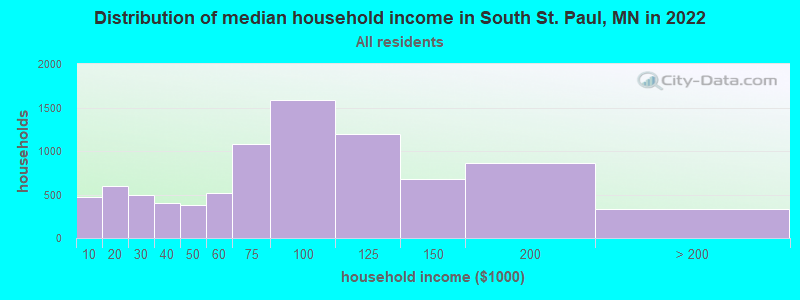
South St. Paul, MN household income distribution 472 Less than $10,000592 $10,000 to $19,999495 $20,000 to $29,999408 $30,000 to $39,999377 $40,000 to $49,999513 $50,000 to $59,9991,075 $60,000 to $74,9991,585 $75,000 to $99,9991,196 $100,000 to $124,999673 $125,000 to $149,999863 $150,000 to $199,999338 $200,000 or more
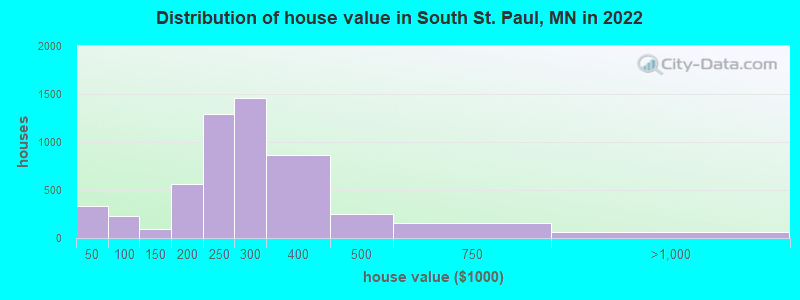
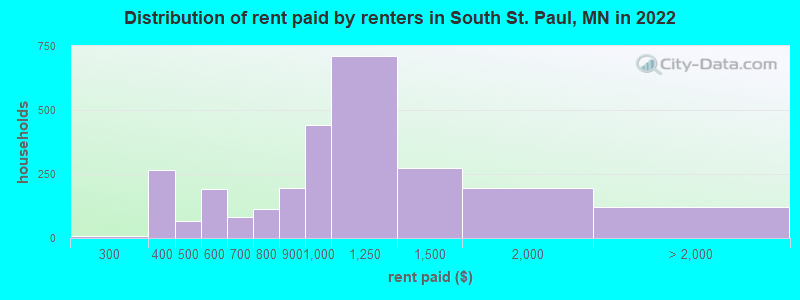
Home value of owner - occupied houses in 2022 in South St. Paul, MN 53 Less than $10,00021 $10,000 to $14,99920 $15,000 to $19,999109 $20,000 to $24,99914 $25,000 to $29,99911 $30,000 to $34,999100 $40,000 to $49,99915 $50,000 to $59,99916 $70,000 to $79,99946 $80,000 to $89,99949 $90,000 to $99,99954 $100,000 to $124,99941 $125,000 to $149,999157 $150,000 to $174,999408 $175,000 to $199,9991,294 $200,000 to $249,9991,458 $250,000 to $299,999859 $300,000 to $399,999251 $400,000 to $499,999153 $500,000 to $749,99962 $750,000 to $999,999Rent paid by renters in 2022 in South St. Paul, MN 5 Less than $1009 $250 to $299136 $300 to $349127 $350 to $39949 $400 to $44915 $450 to $499139 $500 to $54953 $550 to $59922 $600 to $64958 $650 to $69955 $700 to $74957 $750 to $799195 $800 to $899441 $900 to $999709 $1,000 to $1,249274 $1,250 to $1,499197 $1,500 to $1,99954 $2,000 to $2,49967 No cash rent
Percentage of workers working in this county: 54.6%Number of people working at home: 1,524 (13.5% of all workers )
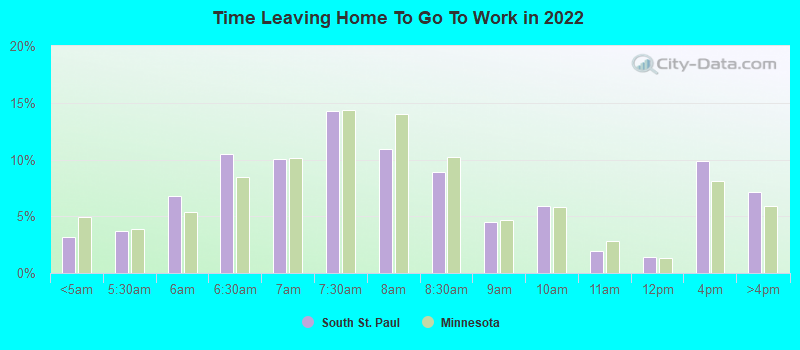
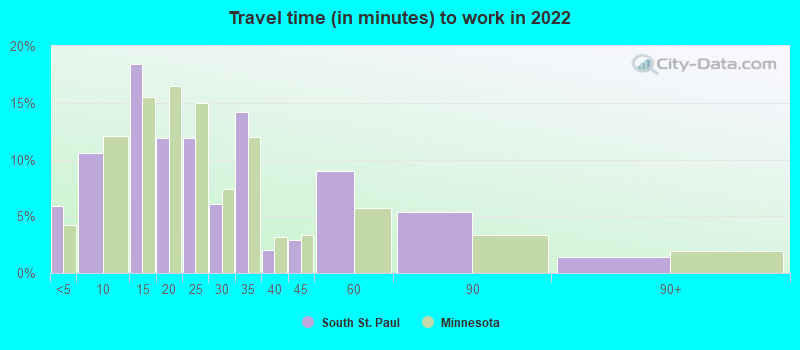
Travel time to work (commute)
Less than 5 minutes: 3545 to 9 minutes: 1,03610 to 14 minutes: 1,55315 to 19 minutes: 1,95320 to 24 minutes: 1,78325 to 29 minutes: 88130 to 34 minutes: 1,15935 to 39 minutes: 18640 to 44 minutes: 22845 to 59 minutes: 35960 to 89 minutes: 7690 or more minutes: 70
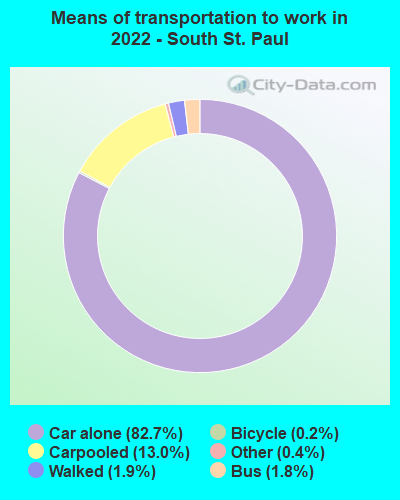
Means of transportation to work:
Drove a car alone: 4,600 (63.2%)Carpooled: 840 (11.5%)Bus : 92 (1.3%)Taxi: 41 (0.6%)Bicycle: 7 (0.1%)Walked: 98 (1.3%)Worked at home: 1,524 (20.9%)
Unemployment by race in 2022
Unemployment rate for White non-Hispanic residents 7.7% Males2.6% FemalesUnemployment rate for Black residents 9.4% MalesUnemployment rate for Asian residents 19.3% FemalesUnemployment rate for other race residents 5.6% Males2.4% FemalesUnemployment rate for two or more race residents 8.7% MalesUnemployment rate for Hispanic or Latino residents 9.0% Males1.9% Females
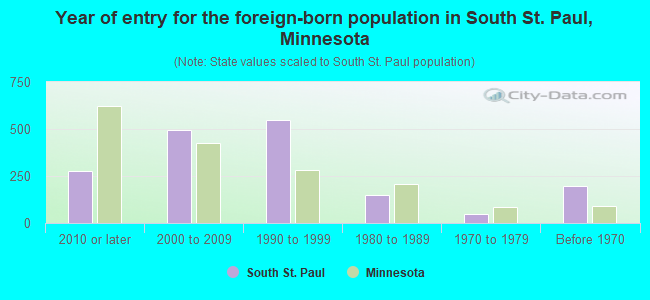
Year of entry for the foreign-born population in South St. Paul, Minnesota
278 2010 or later 494 2000 to 2009 548 1990 to 1999 147 1980 to 1989 48 1970 to 1979 197 Before 1970
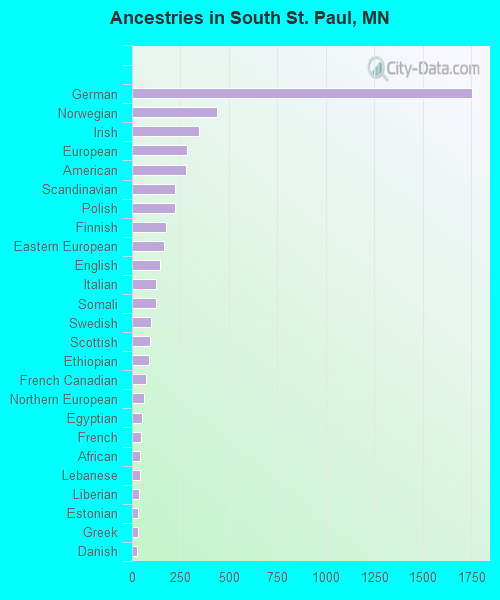
First ancestries reported:
German: 1,753 (22.1%)
Norwegian: 437 (5.5%)
Irish: 348 (4.4%)
European: 283 (3.6%)
American: 279 (3.5%)
Scandinavian: 223 (2.8%)
Polish: 221 (2.8%)
Finnish: 175 (2.2%)
Eastern European: 163 (2.1%)
English: 142 (1.8%)
Italian: 126 (1.6%)
Somali: 125 (1.6%)
Swedish: 99 (1.2%)
Scottish: 92 (1.2%)
Ethiopian: 89 (1.1%)
French Canadian: 71 (0.9%)
Northern European: 63 (0.8%)
Egyptian: 50 (0.6%)
French: 45 (0.6%)
African: 41 (0.5%)
Lebanese: 39 (0.5%)
Liberian: 35 (0.4%)
Estonian: 31 (0.4%)
Greek: 31 (0.4%)
Danish: 28 (0.4%)
Croatian: 23 (0.3%)
Czech: 18 (0.2%)
Swiss: 15 (0.2%)
Dutch: 13 (0.2%)
Scotch-Irish: 13 (0.2%)
Portuguese: 12 (0.2%)
Sierra Leonean: 10 (0.1%)
Austrian: 9 (0.1%)
Romanian: 9 (0.1%)
Serbian: 6 (0.08%)
Welsh: 5 (0.06%)
Czechoslovakian: 3 (0.04%)
Slavic: 3 (0.04%)
Russian: 2 (0.03%) Most common places of birth for foreign-born residents (%): Mexico South St. Paul:
38.5% (592)Minnesota:
12.1% (58,312)
El Salvador South St. Paul:
19.5% (300)Minnesota:
1.4% (6,841)
Cameroon South St. Paul:
7.6% (117)Minnesota:
0.7% (3,598)
Egypt South St. Paul:
6.8% (105)Minnesota:
0.6% (2,929)
Eritrea South St. Paul:
3.8% (59)Minnesota:
0.6% (2,993)
Cambodia South St. Paul:
3.1% (47)Minnesota:
0.9% (4,264)
Ecuador South St. Paul:
2.6% (40)Minnesota:
1.8% (8,438)
Philippines South St. Paul:
2.5% (39)Minnesota:
2.0% (9,850)
Liberia South St. Paul:
2.5% (38)Minnesota:
2.8% (13,695)
Laos South St. Paul:
1.8% (27)Minnesota:
5.1% (24,591)
Somalia South St. Paul:
1.8% (27)Minnesota:
8.0% (38,461)
Honduras South St. Paul:
1.6% (24)Minnesota:
0.8% (4,085)
Place of birth for U.S.-born residents:
This state: 15,049Other state: 4,072Northeast: 318Midwest: 2,298South: 1,008West: 504 88.7% of South St. Paul residents lived in the same house 1 years ago.
Out of people who lived in different houses, 28.1% lived in this county.
Out of people who lived in different counties, 84.9% lived in Minnesota.
South St. Paul:
88.7%State average:
87.4%
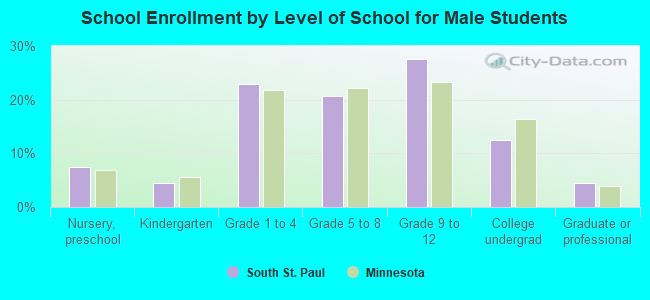
Education attainment for males 25 years and older:
No schooling: 142Nursery to 4th grade: 285th and 6th grade: 617th and 8th grade: 349th grade: 9810th grade: 7011th grade: 4012th grade, no diploma: 95High school graduate (or equivalency): 1,996Less than 1 year of college: 441Some college more than 1 year, no degree: 964Associate degree: 770Bachelor's degree: 1,568Master's degree: 478Professional school degree: 48Doctorate degree: 21
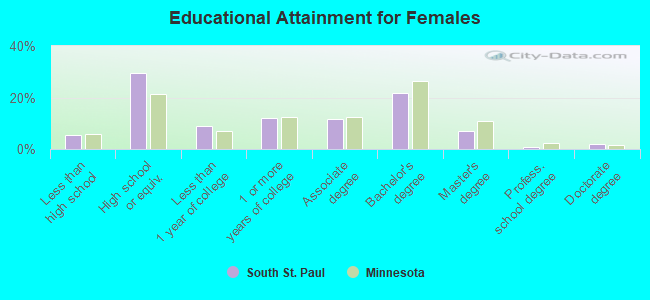
Education attainment for females 25 years and older:
No schooling: 59Nursery to 4th grade: 35th and 6th grade: 87th and 8th grade: 509th grade: 6110th grade: 2811th grade: 12112th grade, no diploma: 69High school graduate (or equivalency): 2,105Less than 1 year of college: 634Some college more than 1 year, no degree: 864Associate degree: 816Bachelor's degree: 1,556Master's degree: 509Professional school degree: 61Doctorate degree: 147
Housing units in structures:
One, detached: 5,834One, attached: 471Two: 5613 or 4: 3005 to 9: 16910 to 19: 29820 to 49: 31250 or more: 596Mobile homes: 121Median worth of mobile homes: $52,374
Housing units lacking complete plumbing facilities in 2022: 0.3%Housing units lacking complete kitchen facilities in 2022: 0.7%House/condo owner moved in on average 13 years ago
Renter moved in on average 2 years ago
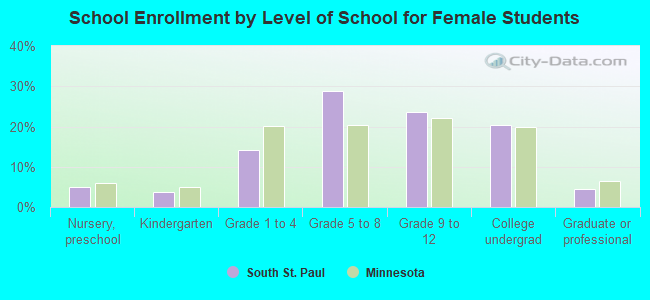
Private vs. public school enrollment:
Students in private schools in grades 1 to 8 (elementary and middle school): 227 Here:
10.7%Minnesota:
12.9%
Students in private schools in grades 9 to 12 (high school): 81 Students in private undergraduate colleges: 239 Here:
29.5%Minnesota:
26.2%