Housing density: 1,089 houses/condos per square mile
Median price asked for vacant for-sale houses and condos in 2022 in this county: $182,682.
Median contract rent in 2022: $1,003 (lower quartile is $820, upper quartile is $1,308)
Median rent asked for vacant for-rent units in 2022: $1,098
Median gross rent in Southbridge, MA in 2022: $1,238
Housing units in Southbridge with a mortgage: 816 (33 second mortgage, 71 home equity loan, 0 both second mortgage and home equity loan) Houses without a mortgage: 441
Compare current foreclosures near Southbridge, MA:
In family households: 644,137 (138,415 male householders, 64,187 female householders)
151,406 spouses, 234,038 children (220,335 natural, 5,096 adopted, 8,607 stepchildren), 11,080 grandchildren, 6,742 brothers or sisters, 7,870 parents, foster children, 7,297 other relatives, 18,119 non-relatives
In nonfamily households: 127,370 (47,312 male householders (35,337 living alone)), 53,166 female householders (44,100 living alone)), 26,892 nonrelatives
In group quarters: 27,045 (11,315 institutionalized population)
135,695 married couples with children.
42,745 single-parent households (8,218 men, 34,527 women).
69.4% of residents of Southbridge speak English at home.
19.8% of residents speak Spanish at home (47% speak English very well, 26% speak English well, 19% speak English not well, 8% don't speak English at all).
9.0% of residents speak other Indo-European language at home (72% speak English very well, 22% speak English well, 5% speak English not well, 1% don't speak English at all).
1.6% of residents speak Asian or Pacific Island language at home (59% speak English very well, 21% speak English well, 20% speak English not well).
0.1% of residents speak other language at home (100% speak English very well).
Foreign born population: 1,382 (9.3%)
(65.3% of them are naturalized citizens)
Year of entry for the foreign-born population in Southbridge, Massachusetts
991995 to March 2000
1041990 to 1994
571985 to 1989
751980 to 1984
621975 to 1979
411970 to 1974
631965 to 1969
178Before 1965
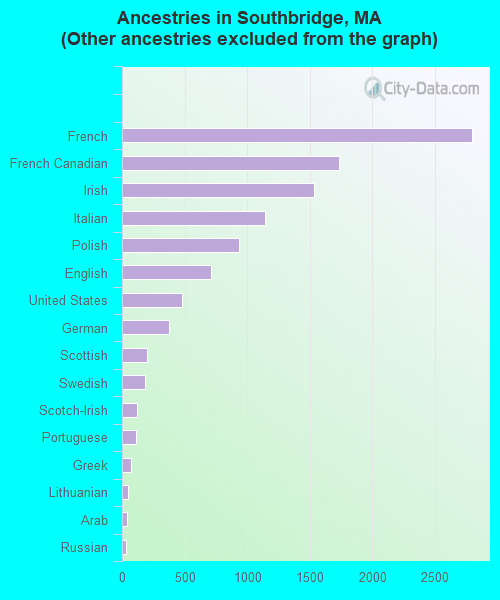
First ancestries reported:
Other: 3,872 (26.7%)
French: 2,796 (19.3%)
French Canadian: 1,733 (12.0%)
Irish: 1,533 (10.6%)
Italian: 1,141 (7.9%)
Polish: 933 (6.4%)
English: 711 (4.9%)
United States: 482 (3.3%)
German: 377 (2.6%)
Scottish: 198 (1.4%)
Swedish: 186 (1.3%)
Scotch-Irish: 122 (0.8%)
Portuguese: 108 (0.7%)
Greek: 75 (0.5%)
Lithuanian: 47 (0.3%)
Arab: 37 (0.3%)
Russian: 35 (0.2%)
Slovak: 21 (0.1%)
Danish: 17 (0.1%)
Norwegian: 11 (0.08%)
Subsaharan African: 11 (0.08%)
Hungarian: 8 (0.06%)
West Indian: 8 (0.06%)
Ukrainian: 7 (0.05%)
Czech: 6 (0.04%)
Dutch: 5 (0.03%)
Welsh: 4 (0.03%)
Most common places of birth for foreign-born residents (%):
Canada
Southbridge:
20.9% (142)
Massachusetts:
5.2% (40,247)
Laos
Southbridge:
17.4% (118)
Massachusetts:
0.4% (3,048)
Poland
Southbridge:
7.7% (52)
Massachusetts:
1.8% (13,543)
Vietnam
Southbridge:
6.3% (43)
Massachusetts:
3.9% (30,457)
Italy
Southbridge:
5.2% (35)
Massachusetts:
3.7% (28,319)
Pakistan
Southbridge:
5.0% (34)
Massachusetts:
0.5% (3,660)
Honduras
Southbridge:
4.9% (33)
Massachusetts:
0.8% (6,023)
Dominican Republic
Southbridge:
4.4% (30)
Massachusetts:
6.0% (46,744)
Mexico
Southbridge:
4.3% (29)
Massachusetts:
1.0% (7,867)
Greece
Southbridge:
4.1% (28)
Massachusetts:
1.7% (12,975)
Other Eastern Europe
Southbridge:
3.2% (22)
Massachusetts:
1.6% (12,350)
Portugal
Southbridge:
2.4% (16)
Massachusetts:
8.6% (66,627)
Colombia
Southbridge:
1.9% (13)
Massachusetts:
2.0% (15,286)
United Kingdom
Southbridge:
1.8% (12)
Massachusetts:
3.3% (25,403)
Ecuador
Southbridge:
1.8% (12)
Massachusetts:
0.4% (3,066)
Place of birth for U.S.-born residents:
This state: 8,867
Other state: 1,766
Northeast: 1,189
Midwest: 114
South: 318
West: 145
52% of Southbridge residents lived in the same house 5 years ago. Out of people who lived in different houses, 78% lived in this county. Out of people who lived in different counties, 31% lived in Massachusetts.
Education attainment for males 25 years and older:
No schooling: 84
Nursery to 4th grade: 29
5th and 6th grade: 100
7th and 8th grade: 195
9th grade: 152
10th grade: 196
11th grade: 190
12th grade, no diploma: 214
High school graduate (or equivalency): 1,332
Less than 1 year of college: 278
Some college more than 1 year, no degree: 325
Associate degree: 244
Bachelor's degree: 310
Master's degree: 100
Professional school degree: 23
Doctorate degree: 24
Education attainment for females 25 years and older:
No schooling: 152
Nursery to 4th grade: 50
5th and 6th grade: 132
7th and 8th grade: 354
9th grade: 195
10th grade: 200
11th grade: 197
12th grade, no diploma: 206
High school graduate (or equivalency): 1,593
Less than 1 year of college: 350
Some college more than 1 year, no degree: 479
Associate degree: 207
Bachelor's degree: 280
Master's degree: 105
Professional school degree: 31
Doctorate degree: 9
Housing units in structures:
One, detached: 1,519
One, attached: 40
Two: 1,263
3 or 4: 1,548
5 to 9: 820
10 to 19: 208
20 to 49: 158
50 or more: 158
Mobile homes: 6
Housing units lacking complete plumbing facilities: 0.4%
Housing units lacking complete kitchen facilities: 1.0%