Southside, AL (Alabama) Houses and Residents
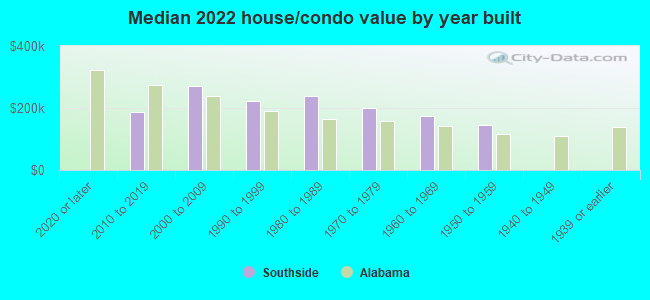
| Southside: | $211,280 |
| Alabama: | $200,900 |
Mean price in 2022:
Detached houses: $250,047
Here: $250,047 State: $273,076 Mobile homes: $62,023
Here: $62,023 State: $77,780
Total population: 8,552 (Urban population: 2,597, Rural population: 4,460 (65 farm, 4,395 nonfarm))
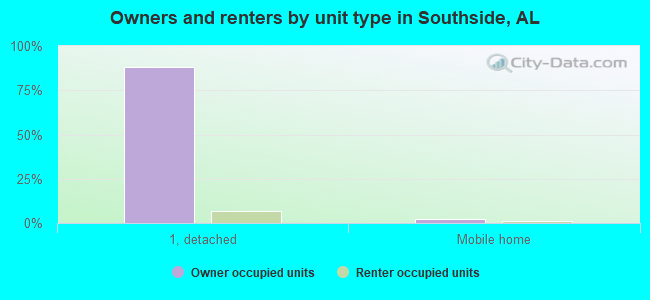
Houses: 3,424 (3,084 occupied: 2,866 owner occupied, 295 renter occupied)
| % of renters here: | 9% |
| State: | 30% |
Housing density: 181 houses/condos per square mile
Median price asked for vacant for-sale houses and condos in 2022: $107,554.
Median contract rent in 2022: $886 (lower quartile is $763, upper quartile is $1,019)
Median rent asked for vacant for-rent units in 2022: $716
Median gross rent in Southside, AL in 2022: $1,129
Housing units in Southside with a mortgage: 1,690 (31 second mortgage, 0 home equity loan, 15 both second mortgage and home equity loan)
Houses without a mortgage: 45
Median household income for houses/condos with a mortgage: $89,945
Median household income for apartments without a mortgage: $65,623
Median monthly housing costs: $995
Compare current foreclosures near Southside, AL:
| Photo | Address | Area | Beds / Baths | Price | Details |
|---|---|---|---|---|---|

|
#1
Edgar Rd
Gadsden, AL 35905
|
1,765 sq. feet
|
2 baths 3 beds |
$99,900
|
show details |

|
#2
Ponderosa Rd
Attalla, AL 35954
|
1,396 sq. feet
|
2 baths 3 beds |
$219,900
|
show details |

|
#3
Goss Ave
Gadsden, AL 35903
|
1,164 sq. feet
|
2 baths 3 beds |
show details | |

|
#4
Greensport Rd
Ashville, AL 35953
|
1,851 sq. feet
|
1 baths 2 beds |
show details | |

|
#5
Windsor St
Gadsden, AL 35903
|
2,228 sq. feet
|
3 baths 3 beds |
show details | |

|
#6
Us Highway 278 E
Gadsden, AL 35903
|
1,171 sq. feet
|
1 baths 3 beds |
show details | |

|
#7
Beale St NW
Attalla, AL 35954
|
2,109 sq. feet
|
2 baths 3 beds |
show details | |

|
#8
Mountain Dr
Gadsden, AL 35904
|
1,837 sq. feet
|
2 baths 3 beds |
show details | |

|
#9
Dogwood Ln
Piedmont, AL 36272
|
2,010 sq. feet
|
2 baths 3 beds |
show details | |

|
#10
Lookout St
Gadsden, AL 35904
|
1,772 sq. feet
|
2 baths 3 beds |
show details |
| Photo | Address | Area | Beds / Baths | Price | Details |
|---|---|---|---|---|---|

|
#11
Laura Ln
Gadsden, AL 35907
|
2,531 sq. feet
|
2 baths 3 beds |
show details | |

|
#12
Gray Ln
Jacksonville, AL 36265
|
2,156 sq. feet
|
3 baths 4 beds |
show details | |

|
#13
Mintwood Way
Gadsden, AL 35905
|
1,928 sq. feet
|
1 baths 4 beds |
show details | |

|
#14
Shoal Creek Rd
Ashville, AL 35953
|
2,806 sq. feet
|
2 baths 3 beds |
show details | |

|
#15
Bluff Haven Ln
Gadsden, AL 35903
|
2,994 sq. feet
|
3 baths 5 beds |
show details | |

|
#16
Loy St
Anniston, AL 36206
|
1,994 sq. feet
|
3 baths 3 beds |
show details | |

|
#17
Clairmont Dr
Weaver, AL 36277
|
1,324 sq. feet
|
2 baths 3 beds |
show details | |

|
#18
2nd Ave NW
Attalla, AL 35954
|
1,286 sq. feet
|
1 baths - beds |
show details | |

|
#19
B St SW
Jacksonville, AL 36265
|
2,069 sq. feet
|
1 baths - beds |
show details | |

|
#20
Woodmar Dr
Rainbow City, AL 35906
|
- sq. feet
|
2 baths 3 beds |
show details |
| Photo | Address | Area | Beds / Baths | Price | Details |
|---|---|---|---|---|---|

|
#21
Piedmont Ave
Gadsden, AL 35904
|
1,434 sq. feet
|
1 baths - beds |
show details | |

|
#22
Raegan Ln
Weaver, AL 36277
|
1,696 sq. feet
|
2 baths 4 beds |
show details | |

|
#23
Medders St
Anniston, AL 36206
|
2,105 sq. feet
|
1 baths - beds |
show details | |

|
#24
Beasley Rd
Attalla, AL 35954
|
1,733 sq. feet
|
2 baths - beds |
show details | |

|
#25
Waterford Way
Jacksonville, AL 36265
|
1,612 sq. feet
|
2 baths 3 beds |
show details | |

|
#26
Old Sulphur Springs Rd
Jacksonville, AL 36265
|
1,443 sq. feet
|
2 baths 3 beds |
show details | |

|
#27
Permita Ct
Anniston, AL 36206
|
1,375 sq. feet
|
1 baths - beds |
show details | |

|
#28
Country Hills Rd
Gallant, AL 35972
|
3,138 sq. feet
|
2 baths - beds |
show details | |

|
#29
Hill Ave
Gadsden, AL 35904
|
1,272 sq. feet
|
1 baths - beds |
show details | |

|
#30
Rockview Cir
Weaver, AL 36277
|
1,315 sq. feet
|
2 baths - beds |
show details |
| Photo | Address | Area | Beds / Baths | Price | Details |
|---|---|---|---|---|---|

|
#31
J St
Ohatchee, AL 36271
|
1,392 sq. feet
|
1 baths - beds |
show details | |

|
#32
Tuckahoe Cir
Gadsden, AL 35904
|
1,888 sq. feet
|
1 baths - beds |
show details | |

|
#33
Sunset Dr
Weaver, AL 36277
|
1,370 sq. feet
|
1 baths - beds |
show details | |

|
#34
Al Highway 204
Jacksonville, AL 36265
|
1,500 sq. feet
|
2 baths - beds |
show details | |

|
#35
Tomahawk Trl
Anniston, AL 36206
|
3,458 sq. feet
|
1 baths - beds |
show details | |

|
#36
Starview Dr
Jacksonville, AL 36265
|
1,344 sq. feet
|
1 baths - beds |
show details | |

|
#37
Randolph St SE
Attalla, AL 35954
|
1,885 sq. feet
|
1 baths - beds |
show details | |

|
#38
Rock Ridge Rd
Weaver, AL 36277
|
1,254 sq. feet
|
1 baths - beds |
show details | |

|
#39
Johnson Rd
Gadsden, AL 35901
|
1,712 sq. feet
|
1 baths - beds |
show details | |

|
#40
Alexandria Rd
Weaver, AL 36277
|
1,331 sq. feet
|
2 baths - beds |
show details |
| Photo | Address | Area | Beds / Baths | Price | Details |
|---|---|---|---|---|---|

|
#41
Hilltop Rd
Weaver, AL 36277
|
1,394 sq. feet
|
1 baths - beds |
show details | |

|
#42
Ledford St
Weaver, AL 36277
|
1,051 sq. feet
|
- baths - beds |
show details | |

|
#43
Pelham Rd N
Jacksonville, AL 36265
|
2,190 sq. feet
|
1 baths - beds |
show details | |

|
#44
Gallant Rd
Gallant, AL 35972
|
1,416 sq. feet
|
1 baths - beds |
show details | |

|
#45
W Point Rd
Jacksonville, AL 36265
|
1,582 sq. feet
|
1 baths - beds |
show details | |

|
#46
Cannon Gap Rd
Gadsden, AL 35905
|
3,709 sq. feet
|
1 baths - beds |
show details | |

|
#47
Dellwood Pl
Gadsden, AL 35901
|
2,160 sq. feet
|
1 baths - beds |
show details | |

|
#48
Laura Ln
Attalla, AL 35954
|
1,152 sq. feet
|
1 baths - beds |
show details | |

|
#49
Riverwood Dr
Gadsden, AL 35903
|
1,719 sq. feet
|
1 baths - beds |
show details | |

|
Check over 1 million property listings on Foreclosure.com!
|
browse all offers | |||

Latest news about housing in Southside, AL collected exclusively by city-data.com from local newspapers, TV, and radio stations

 | Birmingham: rental apartments in Southside (4 replies) |
| Over 2,500 Apartment/Condos planned for Downtown BIRMINGHAM. (15 replies) |
| Real estate home prices (5 replies) |
| Senior Living on Southside -- Yes? No? (43 replies) |
| UPDATED: New and Upcoming Projects. (3757 replies) |
| Red Mountain Cut development! (23 replies) |
Median year apartment built: 1981
Household type by relationship:
Households: 9,334- Male householders: 1,773 (184 living alone), Female householders: 1,288 (345 living alone)
1,806 spouses (1,806 opposite-sex spouses), 174 unmarried partners, (174 opposite-sex unmarried partners), 2,621 children (2,299 natural, 68 adopted, 253 stepchildren), 172 grandchildren, 52 brothers or sisters, 388 parents, 22 foster children, 483 other relatives, 419 non-relatives
- In group quarters: 129
Size of family households: 1,215 2-persons, 635 3-persons, 230 4-persons, 159 5-persons, 167 6-persons, 22 7-or-more-persons.
Size of nonfamily households: 507 1-person, 176 2-persons, 18 3-persons, 41 4-persons.
1,454 married couples with children.
319 single-parent households (14 men, 305 women).
97.5% of residents of Southside speak English at home.
1.8% of residents speak Spanish at home (90% speak English very well, 10% speak English not well).
0.9% of residents speak other language at home (100% speak English very well).
Foreign born population: 89 (1.0%)
(33.7% of them are naturalized citizens)
| Here: | 6.6 |
| State: | 6.5 |
| Here: | 5.9 |
| State: | 4.7 |
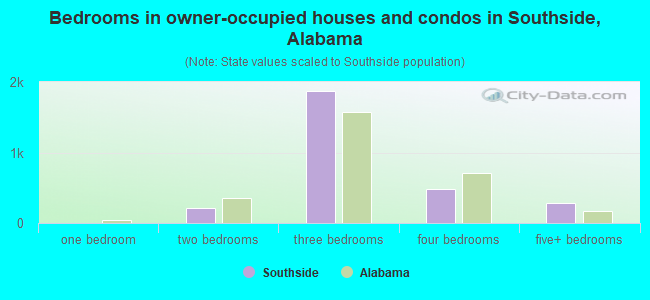
- Bedrooms in owner-occupied houses and condos in Southside, Alabama
- 0no bedroom
- 51 bedroom
- 2072 bedrooms
- 1,8763 bedrooms
- 4894 bedrooms
- 2895+ bedrooms
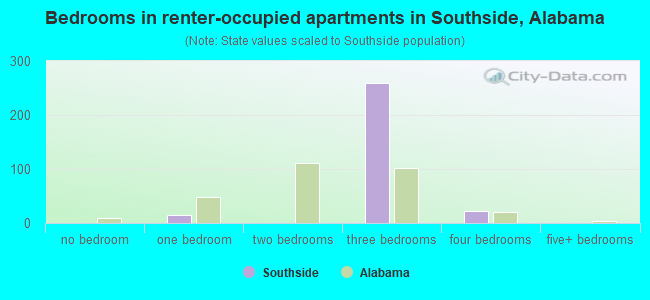
- Bedrooms in renter-occupied apartments in Southside, Alabama
- 0no bedroom
- 141 bedroom
- 02 bedrooms
- 2603 bedrooms
- 224 bedrooms
- 05+ bedrooms
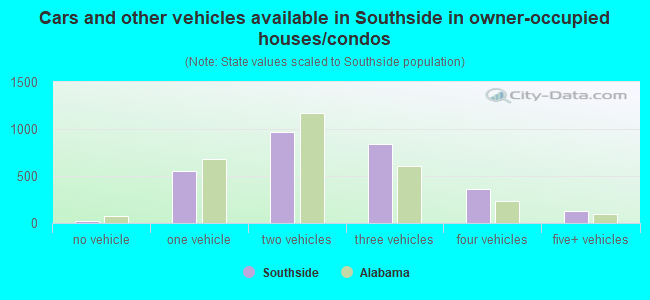
- Cars and other vehicles available in Southside in owner-occupied houses/condos
- 22no vehicle
- 5491 vehicle
- 9672 vehicles
- 8443 vehicles
- 3634 vehicles
- 1235+ vehicles
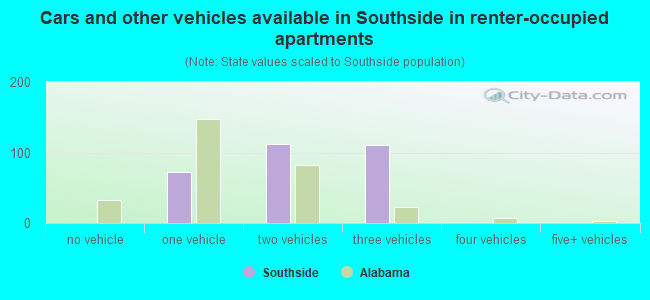
- Cars and other vehicles available in Southside in renter-occupied apartments
- 0no vehicle
- 731 vehicle
- 1122 vehicles
- 1103 vehicles
- 04 vehicles
- 05+ vehicles
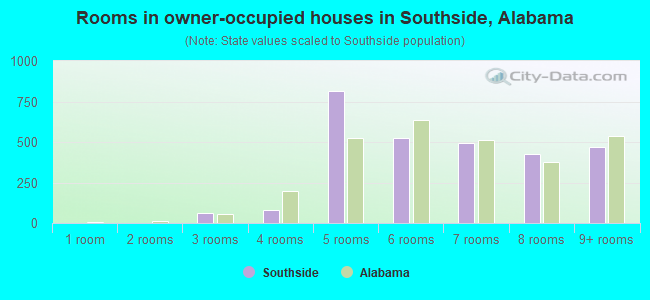
- Rooms in owner-occupied houses in Southside, Alabama
- 01 room
- 02 rooms
- 603 rooms
- 784 rooms
- 8165 rooms
- 5246 rooms
- 4947 rooms
- 4238 rooms
- 4719+ rooms
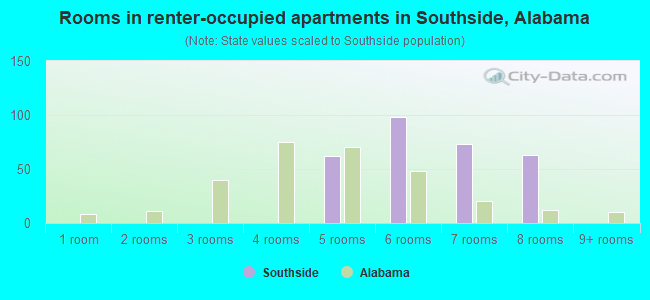
- Rooms in renter-occupied apartments in Southside, Alabama
- 01 room
- 02 rooms
- 03 rooms
- 04 rooms
- 625 rooms
- 986 rooms
- 737 rooms
- 638 rooms
- 09+ rooms
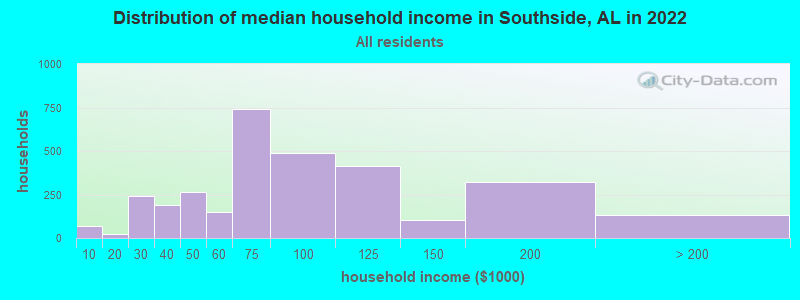
Southside, AL household income distribution

- 67Less than $10,000
- 25$10,000 to $19,999
- 242$20,000 to $29,999
- 191$30,000 to $39,999
- 267$40,000 to $49,999
- 150$50,000 to $59,999
- 740$60,000 to $74,999
- 490$75,000 to $99,999
- 415$100,000 to $124,999
- 104$125,000 to $149,999
- 324$150,000 to $199,999
- 132$200,000 or more
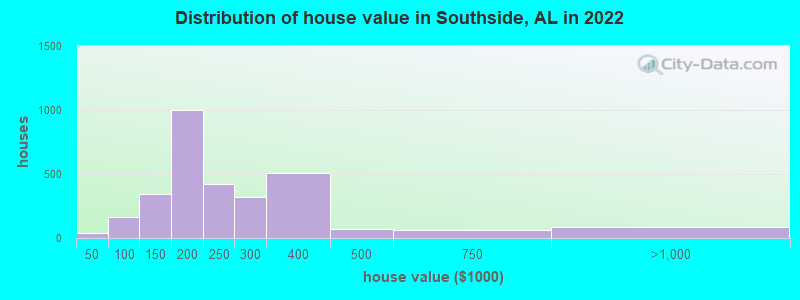
Home value of owner - occupied houses in 2022 in Southside, AL
-
- 9Less than $10,000
- 12$35,000 to $39,999
- 18$40,000 to $49,999
- 8$60,000 to $69,999
- 37$70,000 to $79,999
- 90$80,000 to $89,999
- 7$90,000 to $99,999
- 207$100,000 to $124,999
- 137$125,000 to $149,999
- 503$150,000 to $174,999
- 494$175,000 to $199,999
- 422$200,000 to $249,999
- 324$250,000 to $299,999
- 507$300,000 to $399,999
- 69$400,000 to $499,999
- 59$500,000 to $749,999
- 68$750,000 to $999,999
- 15$1,000,000 to $1,499,999
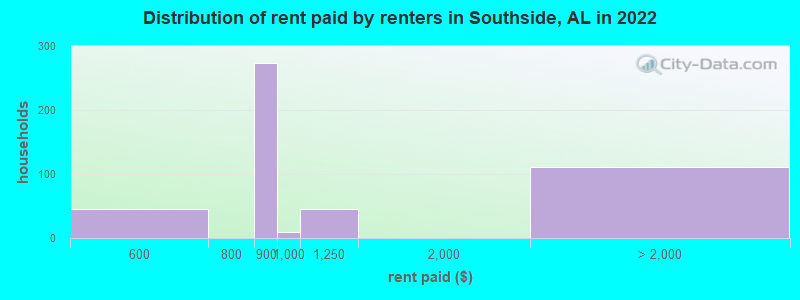
Rent paid by renters in 2022 in Southside, AL
-
- 8$500 to $549
- 37$550 to $599
- 272$800 to $899
- 10$900 to $999
- 44$1,000 to $1,249
- 111No cash rent
Percentage of workers working in this county: 69.2%
Number of people working at home: 97 (2.3% of all workers)
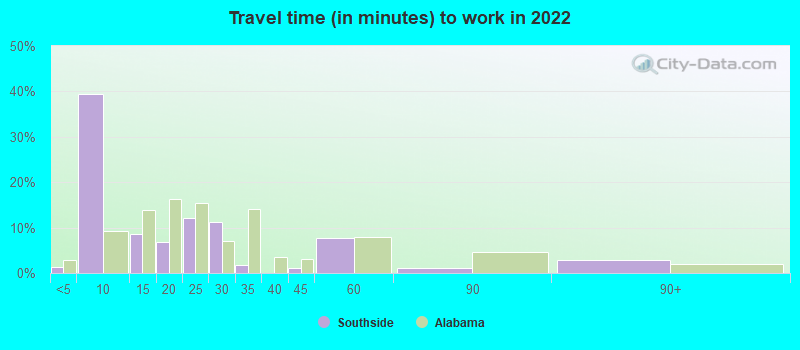
Travel time to work (commute)
- Less than 5 minutes: 12
- 5 to 9 minutes: 126
- 10 to 14 minutes: 607
- 15 to 19 minutes: 426
- 20 to 24 minutes: 854
- 25 to 29 minutes: 189
- 30 to 34 minutes: 376
- 35 to 39 minutes: 72
- 40 to 44 minutes: 194
- 45 to 59 minutes: 335
- 60 to 89 minutes: 436
- 90 or more minutes: 52
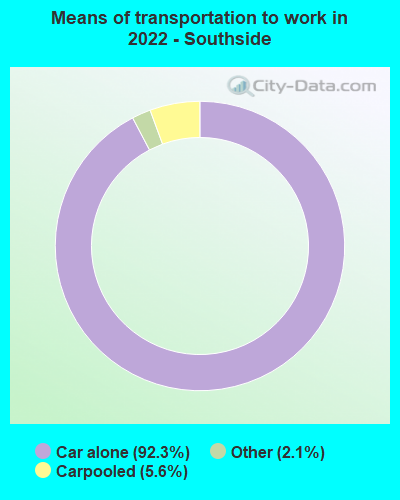
Means of transportation to work:
- Drove a car alone: 793 (66.2%)
- Carpooled: 47 (3.9%)
- Taxi: 19 (1.6%)
- Worked at home: 609 (50.9%)
- Unemployment by race in 2022
- Unemployment rate for White non-Hispanic residents
- 2.8%Males
- 4.2%Females
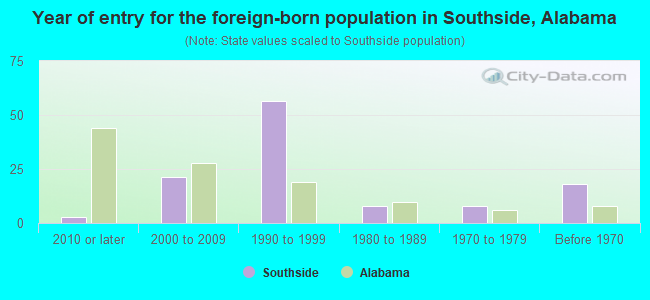
- Year of entry for the foreign-born population in Southside, Alabama
- 32010 or later
- 212000 to 2009
- 571990 to 1999
- 81980 to 1989
- 81970 to 1979
- 18Before 1970
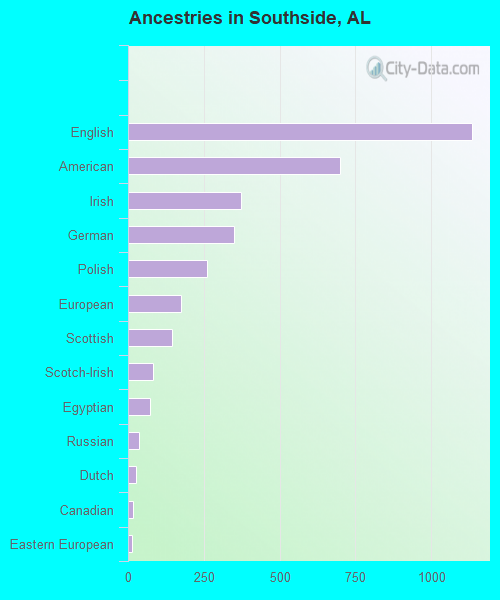
First ancestries reported:
- English: 1,134 (26.6%)
- American: 698 (16.4%)
- Irish: 373 (8.7%)
- German: 349 (8.2%)
- Polish: 259 (6.1%)
- European: 175 (4.1%)
- Scottish: 145 (3.4%)
- Scotch-Irish: 84 (2.0%)
- Egyptian: 71 (1.7%)
- Russian: 37 (0.9%)
- Dutch: 26 (0.6%)
- Canadian: 15 (0.4%)
- Eastern European: 12 (0.3%)
- Czech: 10 (0.2%)
- Scandinavian: 8 (0.2%)
- Ethiopian: 8 (0.2%)
- Italian: 7 (0.2%)
Most common places of birth for foreign-born residents (%):
| Southside: | 61.8% (55) |
| Alabama: | 0.3% (547) |
| Southside: | 23.6% (21) |
| Alabama: | 2.3% (4,000) |
| Southside: | 10.1% (9) |
| Alabama: | 3.9% (6,831) |
Place of birth for U.S.-born residents:
- This state: 6,451
- Other state: 2,514
- Northeast: 269
- Midwest: 454
- South: 1,581
- West: 186
91.6% of Southside residents lived in the same house 1 years ago.
Out of people who lived in different houses, 39.0% lived in this county.
Out of people who lived in different counties, 67.4% lived in Alabama.
| Southside: | 91.6% |
| State average: | 87.6% |
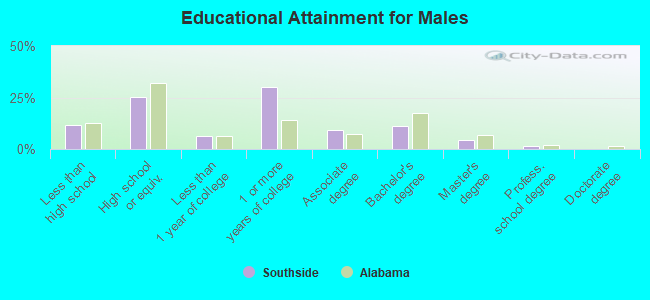
Education attainment for males 25 years and older:
- No schooling: 0
- Nursery to 4th grade: 18
- 5th and 6th grade: 0
- 7th and 8th grade: 211
- 9th grade: 89
- 10th grade: 9
- 11th grade: 0
- 12th grade, no diploma: 58
- High school graduate (or equivalency): 836
- Less than 1 year of college: 213
- Some college more than 1 year, no degree: 987
- Associate degree: 310
- Bachelor's degree: 363
- Master's degree: 142
- Professional school degree: 47
- Doctorate degree: 0
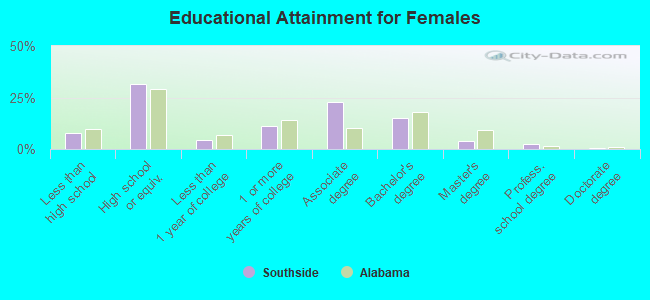
Education attainment for females 25 years and older:
- No schooling: 0
- Nursery to 4th grade: 0
- 5th and 6th grade: 0
- 7th and 8th grade: 20
- 9th grade: 96
- 10th grade: 34
- 11th grade: 0
- 12th grade, no diploma: 115
- High school graduate (or equivalency): 1,063
- Less than 1 year of college: 143
- Some college more than 1 year, no degree: 385
- Associate degree: 771
- Bachelor's degree: 518
- Master's degree: 137
- Professional school degree: 86
- Doctorate degree: 22
Housing units in structures:
- One, detached: 3,186
- Mobile homes: 238
Housing units lacking complete kitchen facilities in 2022: 0.7%
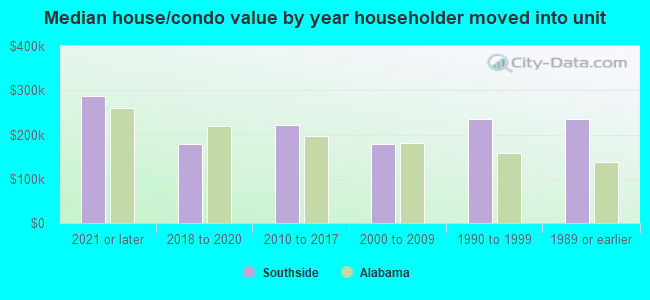
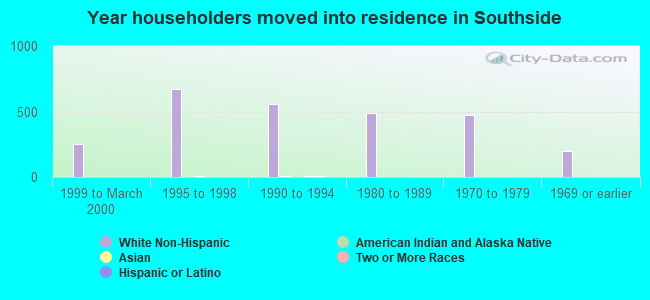
House/condo owner moved in on average 8 years ago
Renter moved in on average 5 years ago
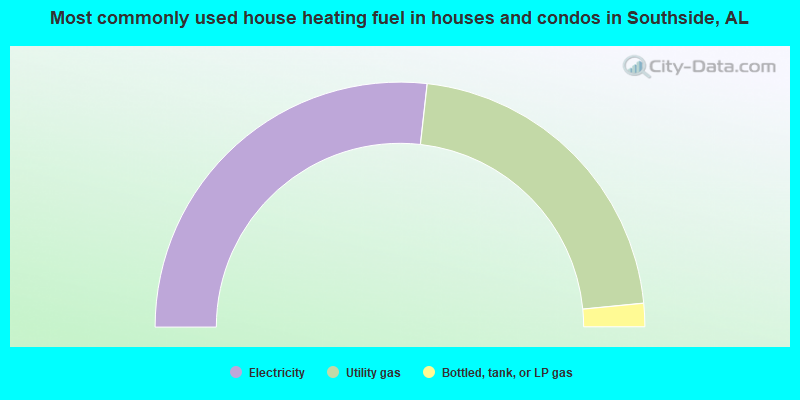
- 53.6%Electricity
- 43.4%Utility gas
- 3.1%Bottled, tank, or LP gas
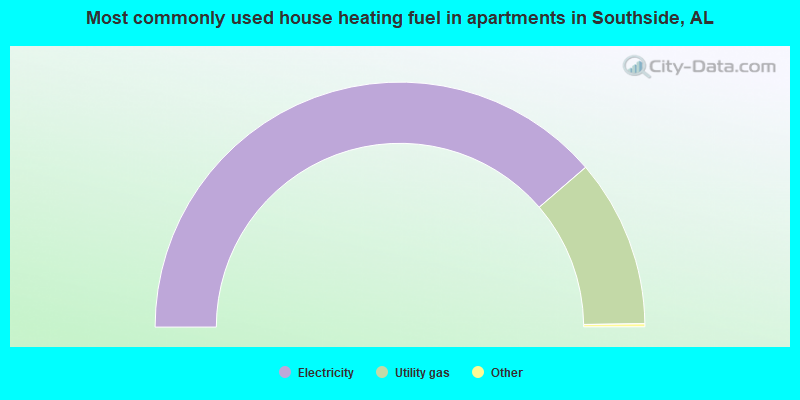
- 77.7%Electricity
- 22.3%Utility gas
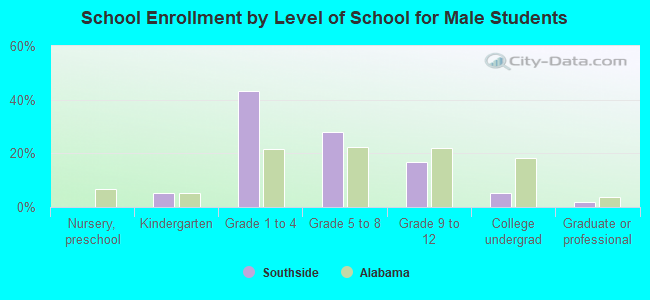
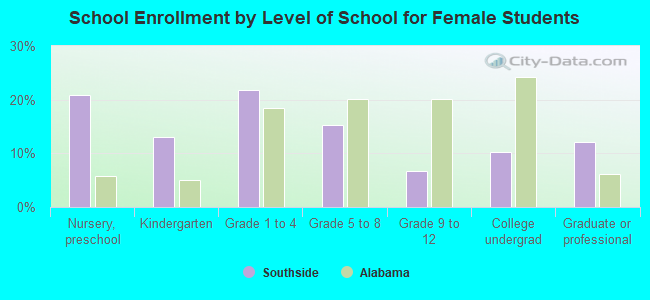
Private vs. public school enrollment:
| Here: | 10.3% |
| Alabama: | 14.7% |
| Here: | 19.2% |
| Alabama: | 16.3% |
| Here: | 2.5% |
| Alabama: | 14.6% |