Southwick, MA (Massachusetts) Houses and Residents
| Southwick: | $355,788 |
| Massachusetts: | $534,700 |
Total population: 9,502 (Urban population: 4,900, Rural population: 3,935 (8 farm, 3,927 nonfarm))
Houses: 3,533 (3,318 occupied: 2,702 owner occupied, 616 renter occupied)
| % of renters here: | 19% |
| State: | 38% |
Housing density: 114 houses/condos per square mile
Median price asked for vacant for-sale houses and condos in 2022 in this county: $294,896.
Median contract rent in 2022: $989 (lower quartile is $727, upper quartile is $1,273)
Median rent asked for vacant for-rent units in 2022: $3,659
Median gross rent in Southwick, MA in 2022: $1,176
Housing units in Southwick with a mortgage: 1,805 (212 second mortgage, 257 home equity loan, 0 both second mortgage and home equity loan)
Houses without a mortgage: 557
Compare current foreclosures near Southwick, MA:
| Photo | Address | Area | Beds / Baths | Price | Details |
|---|---|---|---|---|---|

|
#1
Ed Holcomb Rd
Southwick, MA 01077
|
1,088 sq. feet
|
2 baths 3 beds |
show details | |

|
#2
Birchwood Rd
Southwick, MA 01077
|
1,080 sq. feet
|
1 baths 3 beds |
show details | |

|
#3
College Hwy
Southwick, MA 01077
|
780 sq. feet
|
1 baths 2 beds |
show details | |

|
#4
Charles Johnson Rd
Southwick, MA 01077
|
2,082 sq. feet
|
2 baths 3 beds |
show details | |

|
#5
Lakemont St
Southwick, MA 01077
|
903 sq. feet
|
1 baths 1 beds |
show details | |

|
#6
Granville Rd
Southwick, MA 01077
|
- sq. feet
|
- baths - beds |
show details | |

|
#7
Walnut Street
Springfield, MA 01105
|
2,850 sq. feet
|
2 baths 6 beds |
$99,900
|
show details |

|
#8
Sanford Ave
Enfield, CT 06082
|
21 sq. feet
|
1 baths 4 beds |
$225,000
|
show details |

|
#9
Mountain Rd
Windsor, CT 06095
|
1,144 sq. feet
|
2 baths 3 beds |
$230,000
|
show details |

|
#10
Cold Spring Rd
Southampton, MA 01073
|
2,736 sq. feet
|
1 baths 3 beds |
$284,900
|
show details |
| Photo | Address | Area | Beds / Baths | Price | Details |
|---|---|---|---|---|---|

|
#11
W Franklin St
Holyoke, MA 01040
|
1,558 sq. feet
|
1 baths 2 beds |
$234,900
|
show details |

|
#12
Jondot Dr
Enfield, CT 06082
|
1,385 sq. feet
|
1 baths 3 beds |
$299,900
|
show details |

|
#13
Newman St
Springfield, MA 01105
|
1,676 sq. feet
|
2 baths 3 beds |
$45,900
|
show details |

|
#14
Glendale Cir
Windsor Locks, CT 06096
|
1,277 sq. feet
|
1 baths 2 beds |
show details | |

|
#15
Parents Way
Bloomfield, CT 06002
|
1,230 sq. feet
|
3 baths 4 beds |
show details | |

|
#16
Worthy Ave
West Springfield, MA 01089
|
1,501 sq. feet
|
1 baths 3 beds |
show details | |

|
#17
Marmon St
Springfield, MA 01129
|
980 sq. feet
|
1 baths 2 beds |
show details | |

|
#18
Grove St
West Springfield, MA 01089
|
1,566 sq. feet
|
1 baths 3 beds |
show details | |

|
#19
Dunn Rd
Longmeadow, MA 01106
|
2,400 sq. feet
|
3 baths 3 beds |
show details | |

|
#20
Royal St
Chicopee, MA 01020
|
3,296 sq. feet
|
4 baths 7 beds |
show details |
| Photo | Address | Area | Beds / Baths | Price | Details |
|---|---|---|---|---|---|

|
#21
Acrebrook Rd
Springfield, MA 01129
|
2,246 sq. feet
|
2 baths 4 beds |
show details | |

|
#22
Connecticut Ave
West Springfield, MA 01089
|
- sq. feet
|
2 baths 4 beds |
show details | |

|
#23
Notre Dame St
Springfield, MA 01104
|
1,310 sq. feet
|
2 baths 4 beds |
show details | |

|
#24
Mathewson Ave
Enfield, CT 06082
|
1,666 sq. feet
|
2 baths 4 beds |
show details | |

|
#25
Wilfred St
Chicopee, MA 01020
|
1,360 sq. feet
|
1 baths 4 beds |
show details | |

|
#26
Central Park Dr
Holyoke, MA 01040
|
2,844 sq. feet
|
2 baths 4 beds |
show details | |

|
#27
Columbia Rd
Enfield, CT 06082
|
996 sq. feet
|
1 baths 3 beds |
show details | |

|
#28
Russell Stage Rd
Blandford, MA 01008
|
1,650 sq. feet
|
2 baths 3 beds |
show details | |

|
#29
Wilbraham Rd
Springfield, MA 01109
|
2,058 sq. feet
|
1 baths 4 beds |
show details | |

|
#30
Westford Ave
Springfield, MA 01109
|
3,358 sq. feet
|
2 baths 6 beds |
show details |
| Photo | Address | Area | Beds / Baths | Price | Details |
|---|---|---|---|---|---|

|
#31
Wellington St
Springfield, MA 01109
|
3,075 sq. feet
|
3 baths 6 beds |
show details | |

|
#32
Artisan St
Chicopee, MA 01013
|
1,125 sq. feet
|
1 baths 3 beds |
show details | |

|
#33
Belmont Ave
Springfield, MA 01108
|
3,546 sq. feet
|
2 baths 7 beds |
show details | |

|
#34
Brown Ave
Holyoke, MA 01040
|
2,388 sq. feet
|
2 baths 6 beds |
show details | |

|
#35
Commonwealth Ave
Springfield, MA 01108
|
1,008 sq. feet
|
1 baths 3 beds |
show details | |

|
#36
Harvest Ln
Windsor, CT 06095
|
1,322 sq. feet
|
2 baths 3 beds |
show details | |

|
#37
Fairmount St
Springfield, MA 01108
|
1,620 sq. feet
|
1 baths 5 beds |
show details | |

|
#38
Ontario St
Springfield, MA 01104
|
1,405 sq. feet
|
1 baths 3 beds |
show details | |

|
#39
Cloran St
Springfield, MA 01109
|
1,213 sq. feet
|
1 baths 2 beds |
show details | |

|
#40
Park Ave
Windsor, CT 06095
|
969 sq. feet
|
2 baths 3 beds |
show details |
| Photo | Address | Area | Beds / Baths | Price | Details |
|---|---|---|---|---|---|

|
#41
Malden St
Springfield, MA 01108
|
1,154 sq. feet
|
1 baths 2 beds |
show details | |

|
#42
Litchfield Dr
Enfield, CT 06082
|
1,404 sq. feet
|
1 baths 4 beds |
show details | |

|
#43
Cherokee Dr
Springfield, MA 01109
|
966 sq. feet
|
1 baths 3 beds |
show details | |

|
#44
Rosewell St
Springfield, MA 01109
|
1,008 sq. feet
|
1 baths 3 beds |
show details | |

|
#45
Holland Dr
East Longmeadow, MA 01028
|
1,424 sq. feet
|
1 baths 2 beds |
show details | |

|
#46
Pleasant St
Holyoke, MA 01040
|
4,057 sq. feet
|
3 baths 6 beds |
show details | |

|
#47
Montgomery St
Westfield, MA 01085
|
1,714 sq. feet
|
2 baths 4 beds |
show details | |

|
#48
E Hill Rd Apt 4d
Canton, CT 06019
|
1,116 sq. feet
|
2 baths 2 beds |
show details | |

|
#49
Hancock St
Westfield, MA 01085
|
1,448 sq. feet
|
1 baths 2 beds |
show details | |

|
Check over 1 million property listings on Foreclosure.com!
|
browse all offers | |||
Latest news about housing in Southwick, MA collected exclusively by city-data.com from local newspapers, TV, and radio stations

 | Pet (dog) friendly apartments or homes to rent near Springfield MA? (3 replies) |
| How Much Massachusetts Households Make Per Year: Census Data (37 replies) |
| Oklahoma to (likely Western) Massachusetts - Beginning Research (274 replies) |
| What is living in Sutton, MA like? (18 replies) |
| Springfield #41 deadliest city. (123 replies) |
| Which "affordable" towns are clearly up and coming? (125 replies) |

Household type by relationship:
Households: 448,699- In family households: 370,558 (69,901 male householders, 46,060 female householders)
75,335 spouses, 139,777 children (131,178 natural, 3,169 adopted, 5,430 stepchildren), 9,761 grandchildren, 4,611 brothers or sisters, 4,384 parents, foster children, 5,451 other relatives, 12,672 non-relatives
- In nonfamily households: 78,141 (28,658 male householders (22,507 living alone)), 35,308 female householders (30,105 living alone)), 14,175 nonrelatives
- In group quarters: 14,791 (5,845 institutionalized population)
67,791 married couples with children.
39,215 single-parent households (5,649 men, 33,566 women).
92.9% of residents of Southwick speak English at home.
2.4% of residents speak Spanish at home (68% speak English very well, 14% speak English well, 14% speak English not well, 4% don't speak English at all).
4.5% of residents speak other Indo-European language at home (94% speak English very well, 6% speak English well).
0.2% of residents speak Asian or Pacific Island language at home (100% speak English very well).
Foreign born population: 301 (3.4%)
(74.1% of them are naturalized citizens)
| Here: | 6.1 |
| State: | 6.5 |
| Here: | 4.2 |
| State: | 4.0 |

- Bedrooms in owner-occupied houses and condos in Southwick, Massachusetts
- 9no bedroom
- 1381 bedroom
- 5942 bedrooms
- 1,3693 bedrooms
- 5094 bedrooms
- 835+ bedrooms

- Bedrooms in renter-occupied apartments in Southwick, Massachusetts
- 32no bedroom
- 1721 bedroom
- 2752 bedrooms
- 873 bedrooms
- 224 bedrooms
- 285+ bedrooms

- Cars and other vehicles available in Southwick in owner-occupied houses/condos
- 57no vehicle
- 7191 vehicle
- 1,2422 vehicles
- 4933 vehicles
- 1464 vehicles
- 455+ vehicles

- Cars and other vehicles available in Southwick in renter-occupied apartments
- 32no vehicle
- 3371 vehicle
- 1982 vehicles
- 273 vehicles
- 224 vehicles
- 05+ vehicles

- Rooms in owner-occupied houses in Southwick, Massachusetts
- 91 room
- 182 rooms
- 703 rooms
- 2634 rooms
- 6595 rooms
- 5506 rooms
- 5857 rooms
- 3548 rooms
- 1949+ rooms

- Rooms in renter-occupied apartments in Southwick, Massachusetts
- 321 room
- 492 rooms
- 1383 rooms
- 1484 rooms
- 1365 rooms
- 476 rooms
- 397 rooms
- 148 rooms
- 139+ rooms


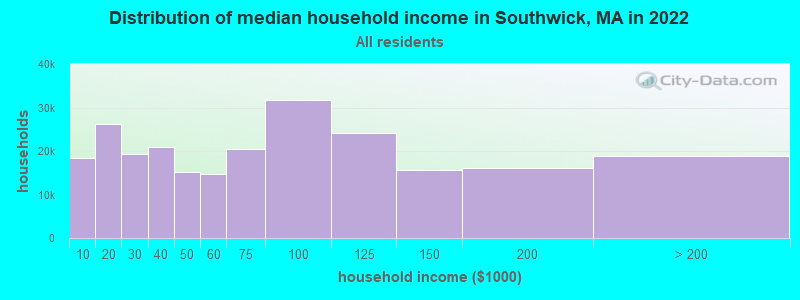
Southwick, MA household income distribution

- 18,449Less than $10,000
- 26,238$10,000 to $19,999
- 19,409$20,000 to $29,999
- 20,826$30,000 to $39,999
- 15,259$40,000 to $49,999
- 14,603$50,000 to $59,999
- 20,572$60,000 to $74,999
- 31,678$75,000 to $99,999
- 24,193$100,000 to $124,999
- 15,536$125,000 to $149,999
- 15,982$150,000 to $199,999
- 18,789$200,000 or more
Percentage of workers working in this county: 62.1%
Number of people working at home: 453 (9.8% of all workers)
Travel time to work (commute)
- Less than 5 minutes: 148
- 5 to 9 minutes: 456
- 10 to 14 minutes: 406
- 15 to 19 minutes: 592
- 20 to 24 minutes: 685
- 25 to 29 minutes: 379
- 30 to 34 minutes: 802
- 35 to 39 minutes: 160
- 40 to 44 minutes: 215
- 45 to 59 minutes: 357
- 60 to 89 minutes: 128
- 90 or more minutes: 107
Means of transportation to work:
- Drove a car alone: 3,929 (87.0%)
- Carpooled: 379 (8.4%)
- Motorcycle: 9 (0.2%)
- Walked: 111 (2.5%)
- Other means: 7 (0.2%)
- Worked at home: 79 (1.8%)


- Year of entry for the foreign-born population in Southwick, Massachusetts
- 151995 to March 2000
- 201990 to 1994
- 121985 to 1989
- 221980 to 1984
- 181975 to 1979
- 01970 to 1974
- 411965 to 1969
- 99Before 1965

First ancestries reported:
- French: 1,840 (16.0%)
- Irish: 1,734 (15.1%)
- Italian: 1,587 (13.8%)
- Polish: 1,314 (11.4%)
- English: 1,168 (10.1%)
- German: 850 (7.4%)
- French Canadian: 791 (6.9%)
- Other: 637 (5.5%)
- Swedish: 282 (2.4%)
- United States: 282 (2.4%)
- Scottish: 259 (2.2%)
- Scotch-Irish: 161 (1.4%)
- Greek: 135 (1.2%)
- Lithuanian: 97 (0.8%)
- Dutch: 73 (0.6%)
- Czech: 59 (0.5%)
- Russian: 51 (0.4%)
- Portuguese: 40 (0.3%)
- Ukrainian: 34 (0.3%)
- Hungarian: 30 (0.3%)
- Welsh: 21 (0.2%)
- Arab: 18 (0.2%)
- Danish: 17 (0.1%)
- Norwegian: 16 (0.1%)
- Swiss: 16 (0.1%)
- Slovak: 8 (0.07%)
Most common places of birth for foreign-born residents (%):
| Southwick: | 27.8% (63) |
| Massachusetts: | 5.2% (40,247) |
| Southwick: | 12.8% (29) |
| Massachusetts: | 3.3% (25,403) |
| Southwick: | 7.5% (17) |
| Massachusetts: | 1.9% (14,883) |
| Southwick: | 7.0% (16) |
| Massachusetts: | 2.3% (17,987) |
| Southwick: | 7.0% (16) |
| Massachusetts: | 3.7% (28,319) |
| Southwick: | 6.6% (15) |
| Massachusetts: | 2.3% (17,449) |
| Southwick: | 6.2% (14) |
| Massachusetts: | 0.5% (3,660) |
| Southwick: | 4.4% (10) |
| Massachusetts: | 5.1% (39,255) |
| Southwick: | 4.0% (9) |
| Massachusetts: | 0.9% (7,258) |
| Southwick: | 3.5% (8) |
| Massachusetts: | 1.7% (12,975) |
| Southwick: | 3.5% (8) |
| Massachusetts: | 1.8% (13,543) |
| Southwick: | 3.5% (8) |
| Massachusetts: | 0.5% (3,868) |
| Southwick: | 3.1% (7) |
| Massachusetts: | 0.3% (2,135) |
| Southwick: | 3.1% (7) |
| Massachusetts: | 0.3% (2,633) |
Place of birth for U.S.-born residents:
- This state: 5,845
- Other state: 2,641
- Northeast: 2,179
- Midwest: 167
- South: 193
- West: 102
62% of Southwick residents lived in the same house 5 years ago.
Out of people who lived in different houses, 64% lived in this county.
Out of people who lived in different counties, 29% lived in Massachusetts.
Education attainment for males 25 years and older:
- No schooling: 8
- Nursery to 4th grade: 10
- 5th and 6th grade: 23
- 7th and 8th grade: 98
- 9th grade: 65
- 10th grade: 60
- 11th grade: 20
- 12th grade, no diploma: 183
- High school graduate (or equivalency): 1,119
- Less than 1 year of college: 200
- Some college more than 1 year, no degree: 287
- Associate degree: 218
- Bachelor's degree: 464
- Master's degree: 146
- Professional school degree: 22
- Doctorate degree: 16

Education attainment for females 25 years and older:
- No schooling: 10
- Nursery to 4th grade: 9
- 5th and 6th grade: 14
- 7th and 8th grade: 62
- 9th grade: 58
- 10th grade: 70
- 11th grade: 58
- 12th grade, no diploma: 162
- High school graduate (or equivalency): 1,147
- Less than 1 year of college: 156
- Some college more than 1 year, no degree: 292
- Associate degree: 346
- Bachelor's degree: 395
- Master's degree: 177
- Professional school degree: 48
- Doctorate degree: 7


Housing units in structures:
- One, detached: 2,730
- One, attached: 188
- Two: 122
- 3 or 4: 92
- 5 to 9: 59
- 10 to 19: 135
- 20 to 49: 94
- 50 or more: 104
- Mobile homes: 9
Median worth of mobile homes: $126,395
Housing units lacking complete kitchen facilities: 0.5%

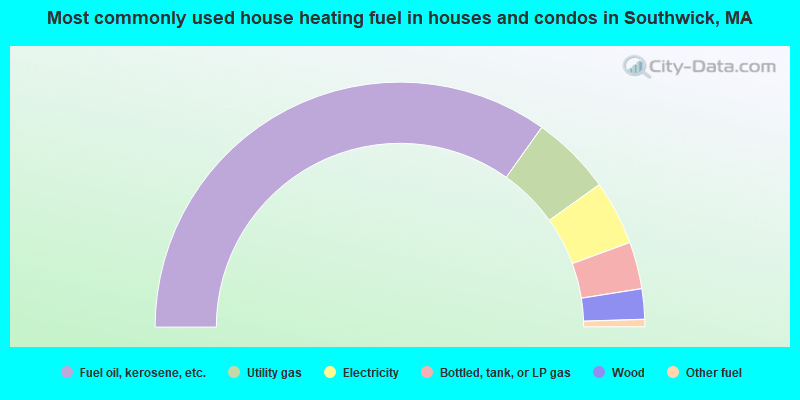
- 69.6%Fuel oil, kerosene, etc.
- 10.6%Utility gas
- 8.5%Electricity
- 6.2%Bottled, tank, or LP gas
- 4.0%Wood
- 1.0%Other fuel
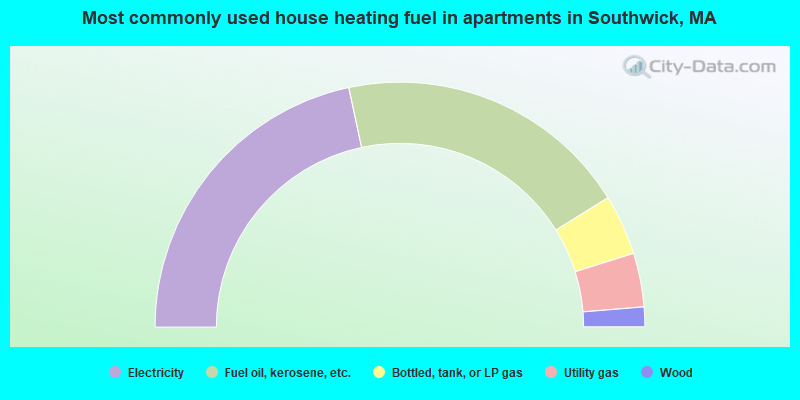
- 43.3%Electricity
- 39.0%Fuel oil, kerosene, etc.
- 8.0%Bottled, tank, or LP gas
- 7.1%Utility gas
- 2.6%Wood
Private vs. public school enrollment:
| Here: | 4.3% |
| Massachusetts: | 10.8% |
| Here: | 5.0% |
| Massachusetts: | 12.2% |
| Here: | 11.6% |
| Massachusetts: | 48.2% |


