Spanish Fork, UT (Utah) Houses and Residents
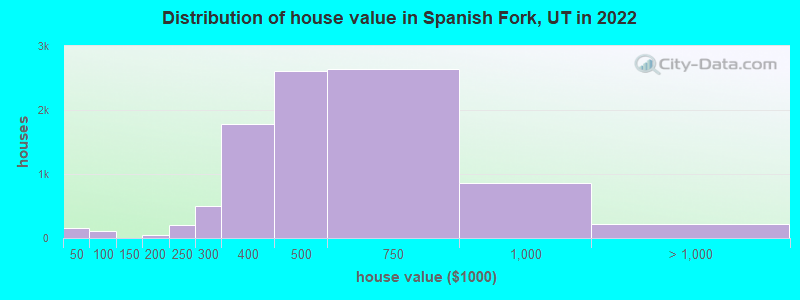
Estimated median house or condo value in 2022: $498,115 (it was $137,900 in 2000 )
Spanish Fork:
$498,115Utah:
$499,500
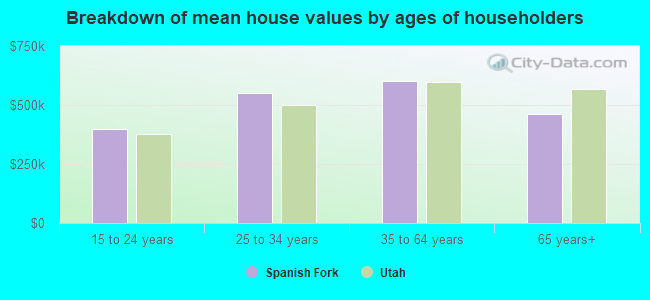
Lower value quartile - upper value quartile: $398,986 - $578,274Mean price in 2022: Detached houses: $506,214 Here:
$506,214State:
$607,750
Townhouses or other attached units: $337,002 Here:
$337,002State:
$444,505
In 2-unit structures: $351,418 Here:
$351,418State:
$433,540
In 3-to-4-unit structures: $257,199 Here:
$257,199State:
$362,850
In 5-or-more-unit structures: $764,002 Here:
$764,002State:
$412,810
Mobile homes: $196,732 Here:
$196,732State:
$113,475
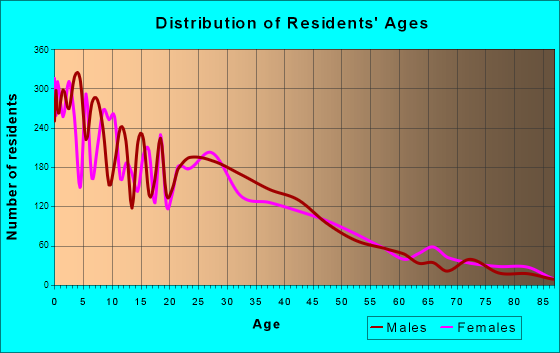
Total population: 37,527 (Urban population: 19,984 (all inside urban clusters), Rural population: 287 (64 farm, 223 nonfarm ))
Houses: 12,964 (12,696 occupied: 10,163 owner occupied, 2,559 renter occupied )
% of renters here:
20%State:
29%
Housing density: 979 houses/condos per square mile
Median price asked for vacant for-sale houses and condos in 2022: $586,719.
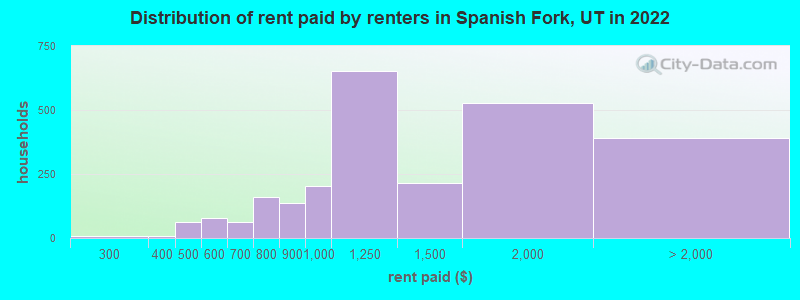
Median contract rent in 2022: $1,150 (lower quartile is $882, upper quartile is $1,550)
Median rent asked for vacant for-rent units in 2022: $1,022
Median gross rent in Spanish Fork, UT in 2022: $1,359
Housing units in Spanish Fork with a mortgage: 7,747 (1,209 second mortgage, 62 home equity loan, 913 both second mortgage and home equity loan )Houses without a mortgage: 144
Median household income for houses/condos with a mortgage: $120,142
Median household income for apartments without a mortgage: $89,708
Median monthly housing costs: $1,563
Data:
Median house or condo value ($)
Median house or condo value ($ change since 2000)
Median house or condo value ($) - White
Median house or condo value ($) - Black or African American
Median house or condo value ($) - Asian
Median house or condo value ($) - Hispanic or Latino
Median house or condo value ($) - American Indian and Alaska Native
Median house or condo value ($) - Multirace
Median house or condo value ($) - Other Race
Median price asked for mobile homes ($)
Household density (households per square mile)
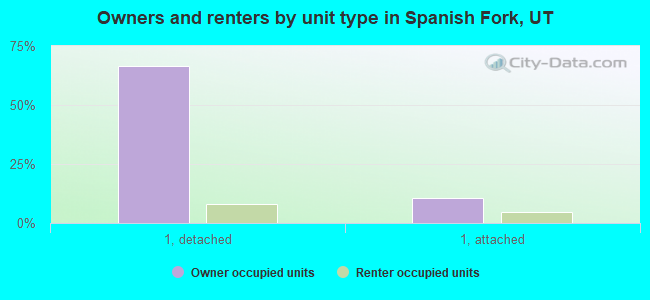
Mean house or condo value by units in structure - 1, detached ($)
Mean house or condo value by units in structure - 1, attached ($)
Mean house or condo value by units in structure - 2 ($)
Mean house or condo value by units in structure by units in structure - 3 or 4 ($)
Mean house or condo value by units in structure - 5 or more ($)
Mean house or condo value by units in structure - Boat, RV, van, etc. ($)
Mean house or condo value by units in structure - Mobile home ($)
Median contract rent ($)
Median contract rent - Lower quartile ($)
Median contract rent - Upper quartile ($)
Median gross rent ($)
Urban houses (%)
Rural houses (%)
Houses occupied (%)
Houses occupied (% change since 2000)
Houses owner occupied (%)
Houses owner occupied (% change since 2000)
Houses renter occupied (%)
Houses renter occupied (% change since 2000)
Vacant housing units - For rent (%)
Vacant housing units - For rent (% change since 2000)
Vacant housing units - For sale only (%)
Vacant housing units - For sale only (% change since 2000)
Vacant housing units - Rented or sold, not occupied (%)
Vacant housing units - Rented or sold, not occupied (% change since 2000)
Vacant housing units - For seasonal, recreational, or occasional use (%)
Vacant housing units - For seasonal, recreational, or occasional use (% change since 2000)
Vacant housing units - For migrant workers (%)
Vacant housing units - For migrant workers (% change since 2000)
Vacant housing units - Other vacant (%)
Vacant housing units - Other vacant (% change since 2000)
Median monthly housing costs ($)
Median household income for houses/condos with a mortgage ($)
Median household income for houses/condos without a mortgage ($)
Median household income ($)
Median household income ($) - White
Median household income ($) - Black or African American
Median household income ($) - Asian
Median household income ($) - Hispanic or Latino
Median household income ($) - American Indian and Alaska Native
Median household income ($) - Multirace
Median household income ($) - Other Race
Mortgage status - with mortgage (%)
Mortgage status - with second mortgage (%)
Mortgage status - with home equity loan (%)
Mortgage status - with both second mortgage and home equity loan (%)
Mortgage status - without a mortgage (%)
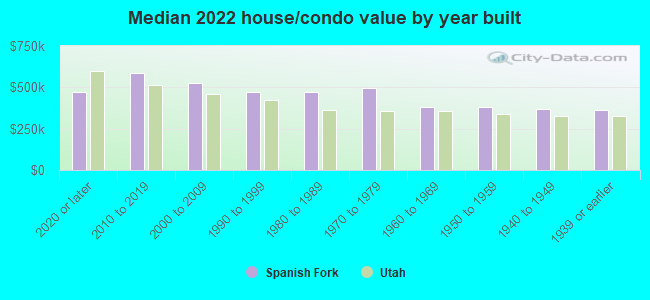
Median year house/condo built
Median year apartment built
Household type by relationship - Male householder living alone (%)
Household type by relationship - Male householder not living alone (%)
Household type by relationship - Female householder living alone (%)
Household type by relationship - Female householder not living alone (%)
Household type by relationship - Opposite-Sex spouse (%)
Household type by relationship - Same-Sex spouse (%)
Household type by relationship - Opposite-Sex unmarried partner (%)
Household type by relationship - Same-Sex unmarried partner (%)
Household type by relationship - In group quarters (%)
Size of family households - 2-person household (%)
Size of family households - 3-person household (%)
Size of family households - 4-person household (%)
Size of family households - 5-person household (%)
Size of family households - 6-person household (%)
Size of family households - 7-or-more-person household (%)
Size of nonfamily households - 1-person household (%)
Size of nonfamily households - 2-person household (%)
Size of nonfamily households - 3-person household (%)
Size of nonfamily households - 4-person household (%)
Size of nonfamily households - 5-person household (%)
Size of nonfamily households - 6-person household (%)
Size of nonfamily households - 7-or-moreperson household (%)
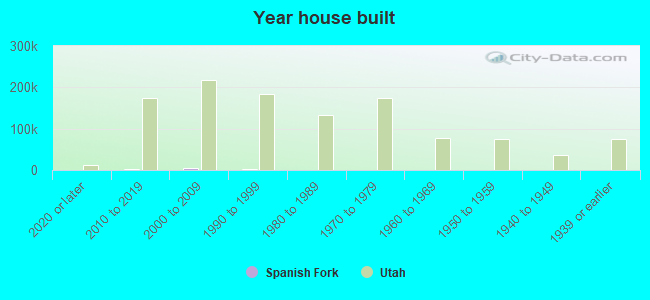
Year house built - Built 2010 or later (%)
Year house built - Built 2000 to 2009 (%)
Year house built - Built 1990 to 1999 (%)
Year house built - Built 1980 to 1989 (%)
Year house built - Built 1970 to 1979 (%)
Year house built - Built 1960 to 1969 (%)
Year house built - Built 1950 to 1959 (%)
Year house built - Built 1940 to 1949 (%)
Year house built - Built 1939 or earlier (%)
Median number of rooms in houses and condos
Median number of rooms in apartments
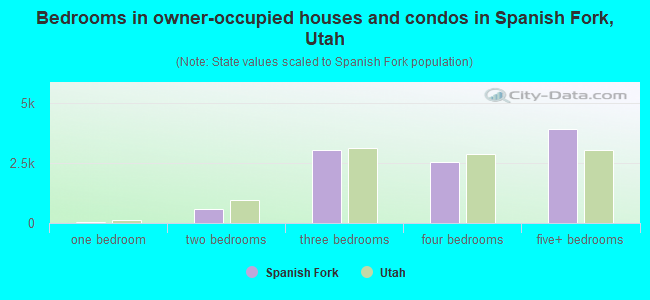
Median number of bedrooms in owner occupied houses
Mean number of bedrooms in owner occupied houses
Median number of bedrooms in renter occupied houses
Mean number of bedrooms in renter occupied houses
Median number of vehichles in owner occupied houses
Mean number of vehichles in owner occupied houses
Median number of vehichles in renter occupied houses
Mean number of vehichles in renter occupied houses
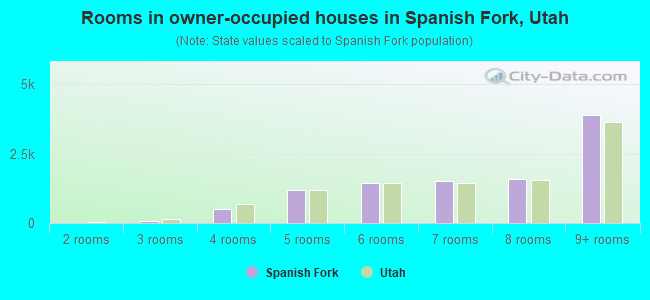
Rooms in owner-occupied houses - 1 room (%)
Rooms in owner-occupied houses - 2 rooms (%)
Rooms in owner-occupied houses - 3 rooms (%)
Rooms in owner-occupied houses - 4 rooms (%)
Rooms in owner-occupied houses - 5 rooms (%)
Rooms in owner-occupied houses - 6 rooms (%)
Rooms in owner-occupied houses - 7 rooms (%)
Rooms in owner-occupied houses - 8 rooms (%)
Rooms in owner-occupied houses - 9+ rooms (%)
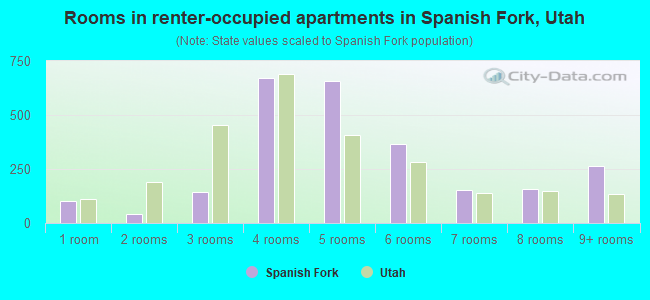
Rooms in renter-occupied houses - 1 room (%)
Rooms in renter-occupied houses - 2 rooms (%)
Rooms in renter-occupied houses - 3 rooms (%)
Rooms in renter-occupied houses - 4 rooms (%)
Rooms in renter-occupied houses - 5 rooms (%)
Rooms in renter-occupied houses - 6 rooms (%)
Rooms in renter-occupied houses - 7 rooms (%)
Rooms in renter-occupied houses - 8 rooms (%)
Rooms in renter-occupied houses - 9+ rooms (%)
Bedrooms in owner-occupied houses - no bedrooms (%)
Bedrooms in owner-occupied houses - 1 bedroom (%)
Bedrooms in owner-occupied houses - 2 bedrooms (%)
Bedrooms in owner-occupied houses - 3 bedrooms (%)
Bedrooms in owner-occupied houses - 4 bedrooms (%)
Bedrooms in owner-occupied houses - 5+ bedrooms (%)
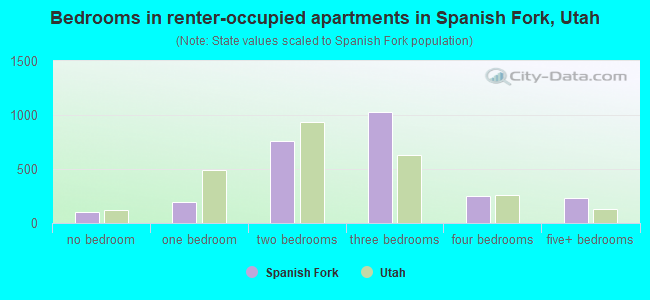
Bedrooms in renter-occupied houses - no bedrooms (%)
Bedrooms in renter-occupied houses - 1 bedroom (%)
Bedrooms in renter-occupied houses - 2 bedrooms (%)
Bedrooms in renter-occupied houses - 3 bedrooms (%)
Bedrooms in renter-occupied houses - 4 bedrooms (%)
Bedrooms in renter-occupied houses - 5+ bedrooms (%)
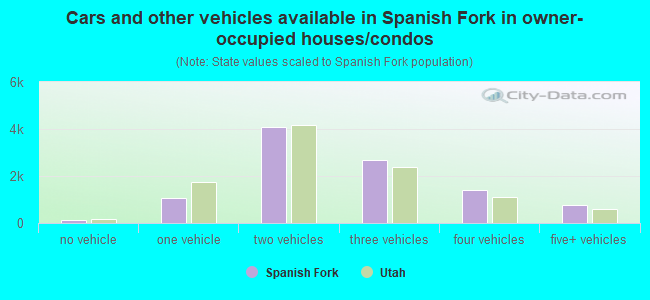
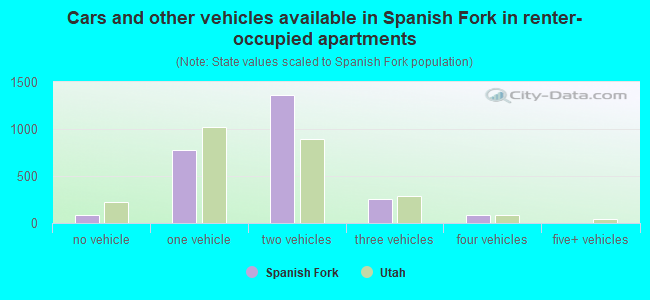
Vehicles available in owner-occupied houses - no vehicle available (%)
Vehicles available in owner-occupied houses - 1 vehicle available(%)
Vehicles available in owner-occupied houses - 2 Vehicles available (%)
Vehicles available in owner-occupied houses - 3 Vehicles available (%)
Vehicles available in owner-occupied houses - 4 Vehicles available (%)
Vehicles available in owner-occupied houses - 5+ Vehicles available (%)
Vehicles available in renter-occupied houses - no vehicle available (%)
Vehicles available in renter-occupied houses - 1 vehicle available (%)
Vehicles available in renter-occupied houses - 2 Vehicles available (%)
Vehicles available in renter-occupied houses - 3 Vehicles available (%)
Vehicles available in renter-occupied houses - 4 Vehicles available (%)
Vehicles available in renter-occupied houses - 5+ Vehicles available (%)
Housing units in structures - 1, detached (%)
Housing units in structures - 1, attached (%)
Housing units in structures - 2 (%)
Housing units in structures - 3 or 4 (%)
Housing units in structures - 5 to 9 (%)
Housing units in structures - 10 to 19 (%)
Housing units in structures - 20 to 49 (%)
Housing units in structures - 50 or more (%)
Housing units in structures - Mobile home (%)
Housing units in structures - Boat, RV, van, etc. (%)
Housing units in structures - Owners - 1, detached (%)
Housing units in structures - Owners - 1, attached (%)
Housing units in structures - Owners - 2 (%)
Housing units in structures - Owners - 3 or 4 (%)
Housing units in structures - Owners - 5 to 9 (%)
Housing units in structures - Owners - 10 to 19 (%)
Housing units in structures - Owners - 20 to 49 (%)
Housing units in structures - Owners - 50 or more (%)
Housing units in structures - Owners - Mobile home (%)
Housing units in structures - Owners - Boat, RV, van, etc. (%)
Housing units in structures - Renters - 1, detached (%)
Housing units in structures - Renters - 1, attached (%)
Housing units in structures - Renters - 2 (%)
Housing units in structures - Renters - 3 or 4 (%)
Housing units in structures - Renters - 5 to 9 (%)
Housing units in structures - Renters - 10 to 19 (%)
Housing units in structures - Renters - 20 to 49 (%)
Housing units in structures - Renters - 50 or more (%)
Housing units in structures - Renters - Mobile home (%)
Housing units in structures - Renters - Boat, RV, van, etc. (%)
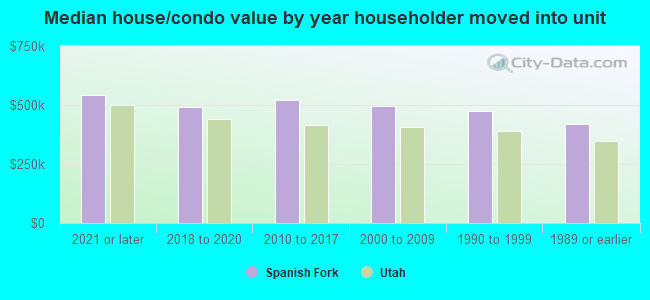
House/condo owner moved in on average (years ago)
Renter moved in on average (years ago)
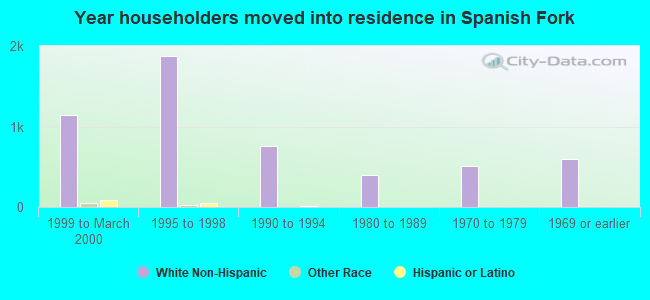
Year householder moved into unit - Moved in 1999 to March 2000 (%)
Year householder moved into unit - Moved in 1999 to March 2000 (%) - White
Year householder moved into unit - Moved in 1999 to March 2000 (%) - Black or African American
Year householder moved into unit - Moved in 1999 to March 2000 (%) - Asian
Year householder moved into unit - Moved in 1999 to March 2000 (%) - Hispanic or Latino
Year householder moved into unit - Moved in 1999 to March 2000 (%) - American Indian and Alaska Native
Year householder moved into unit - Moved in 1999 to March 2000 (%) - Multirace
Year householder moved into unit - Moved in 1999 to March 2000 (%) - Other Race
Year householder moved into unit - Moved in 1995 to 1998 (%)
Year householder moved into unit - Moved in 1995 to 1998 (%) - White
Year householder moved into unit - Moved in 1995 to 1998 (%) - Black or African American
Year householder moved into unit - Moved in 1995 to 1998 (%) - Asian
Year householder moved into unit - Moved in 1995 to 1998 (%) - Hispanic or Latino
Year householder moved into unit - Moved in 1995 to 1998 (%) - American Indian and Alaska Native
Year householder moved into unit - Moved in 1995 to 1998 (%) - Multirace
Year householder moved into unit - Moved in 1995 to 1998 (%) - Other Race
Year householder moved into unit - Moved in 1990 to 1994 (%)
Year householder moved into unit - Moved in 1990 to 1994 (%) - White
Year householder moved into unit - Moved in 1990 to 1994 (%) - Black or African American
Year householder moved into unit - Moved in 1990 to 1994 (%) - Asian
Year householder moved into unit - Moved in 1990 to 1994 (%) - Hispanic or Latino
Year householder moved into unit - Moved in 1990 to 1994 (%) - American Indian and Alaska Native
Year householder moved into unit - Moved in 1990 to 1994 (%) - Multirace
Year householder moved into unit - Moved in 1990 to 1994 (%) - Other Race
Year householder moved into unit - Moved in 1980 to 1989 (%)
Year householder moved into unit - Moved in 1980 to 1989 (%) - White
Year householder moved into unit - Moved in 1980 to 1989 (%) - Black or African American
Year householder moved into unit - Moved in 1980 to 1989 (%) - Asian
Year householder moved into unit - Moved in 1980 to 1989 (%) - Hispanic or Latino
Year householder moved into unit - Moved in 1980 to 1989 (%) - American Indian and Alaska Native
Year householder moved into unit - Moved in 1980 to 1989 (%) - Multirace
Year householder moved into unit - Moved in 1980 to 1989 (%) - Other Race
Year householder moved into unit - Moved in 1970 to 1979 (%)
Year householder moved into unit - Moved in 1970 to 1979 (%) - White
Year householder moved into unit - Moved in 1970 to 1979 (%) - Black or African American
Year householder moved into unit - Moved in 1970 to 1979 (%) - Asian
Year householder moved into unit - Moved in 1970 to 1979 (%) - Hispanic or Latino
Year householder moved into unit - Moved in 1970 to 1979 (%) - American Indian and Alaska Native
Year householder moved into unit - Moved in 1970 to 1979 (%) - Multirace
Year householder moved into unit - Moved in 1970 to 1979 (%) - Other Race
Year householder moved into unit - Moved in 1969 or earlier (%)
Year householder moved into unit - Moved in 1969 or earlier (%) - White
Year householder moved into unit - Moved in 1969 or earlier (%) - Black or African American
Year householder moved into unit - Moved in 1969 or earlier (%) - Asian
Year householder moved into unit - Moved in 1969 or earlier (%) - Hispanic or Latino
Year householder moved into unit - Moved in 1969 or earlier (%) - American Indian and Alaska Native
Year householder moved into unit - Moved in 1969 or earlier (%) - Multirace
Year householder moved into unit - Moved in 1969 or earlier (%) - Other Race
Housing units lacking complete plumbing facilities (%)
Housing units lacking complete kitchen facilities (%)
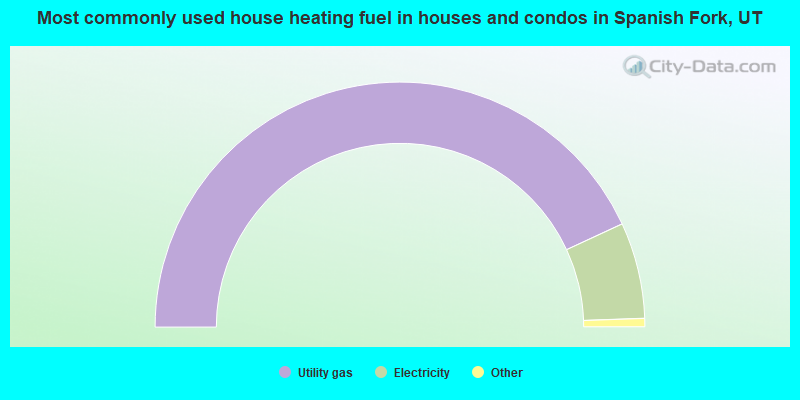
House heating fuel used in houses and condos - Utility gas (%)
House heating fuel used in houses and condos - Bottled, tank, or LP gas (%)
House heating fuel used in houses and condos - Electricity (%)
House heating fuel used in houses and condos - Fuel oil, kerosene, etc. (%)
House heating fuel used in houses and condos - Coal or coke (%)
House heating fuel used in houses and condos - Wood (%)
House heating fuel used in houses and condos - Solar energy (%)
House heating fuel used in houses and condos - Other fuel (%)
House heating fuel used in houses and condos - No fuel used (%)
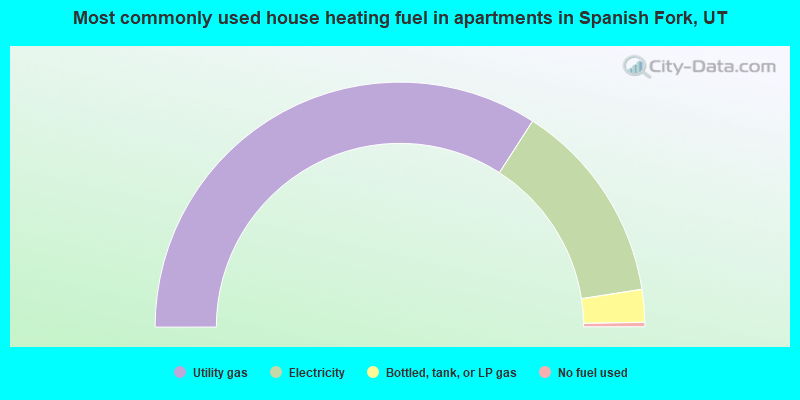
House heating fuel used in apartments - Utility gas (%)
House heating fuel used in apartments - Bottled, tank, or LP gas (%)
House heating fuel used in apartments - Electricity (%)
House heating fuel used in apartments - Fuel oil, kerosene, etc. (%)
House heating fuel used in apartments - Coal or coke (%)
House heating fuel used in apartments - Wood (%)
House heating fuel used in apartments - Solar energy (%)
House heating fuel used in apartments - Other fuel (%)
House heating fuel used in apartments - No fuel used (%)
Median year house/condo built: 2004Median year apartment built: 1984Household type by relationship:
Households: 45,028
Male householders: 6,549 (494 living alone ), Female householders: 5,744 (853 living alone )9,200 spouses (9,176 opposite-sex spouses ), 287 unmarried partners , (287 opposite-sex unmarried partners ), 18,684 children (17,250 natural , 627 adopted , 806 stepchildren ), 1,235 grandchildren , 342 brothers or sisters , 310 parents , 11 foster children , 896 other relatives , 1,112 non-relatives In group quarters: 651
Size of family households: 3,030 2-persons , 2,205 3-persons , 2,286 4-persons , 1,596 5-persons , 921 6-persons , 917 7-or-more-persons .
Size of nonfamily households: 1,448 1-person , 195 2-persons , 34 3-persons , 53 4-persons , 13 5-persons , 6 6-persons , 7 7-or-more-persons .
12,554 married couples with children. single-parent households (549 men , 802 women ).
88.3% of residents of Spanish Fork speak English at home. of residents speak Spanish at home (61% speak English very well , 23% speak English well , 15% speak English not well , 1% don't speak English at all ).of residents speak other Indo-European language at home (93% speak English very well , 7% speak English well ).of residents speak Asian or Pacific Island language at home (88% speak English very well , 12% speak English well ).of residents speak other language at home (100% speak English very well ).
Foreign born population: 2,116 (4.7%)of them are naturalized citizens )
Median number of rooms in houses and condos:
Median number of rooms in apartments
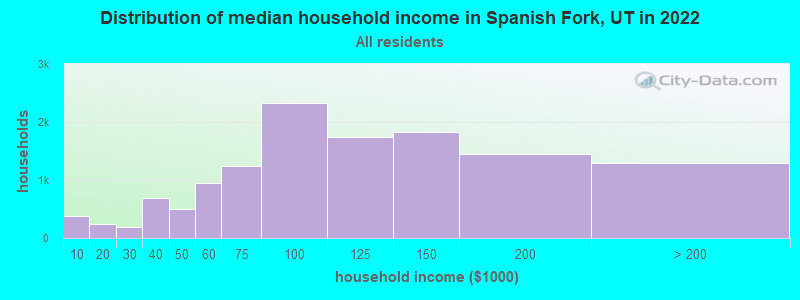
Spanish Fork, UT household income distribution 375 Less than $10,000237 $10,000 to $19,999183 $20,000 to $29,999693 $30,000 to $39,999506 $40,000 to $49,999946 $50,000 to $59,9991,235 $60,000 to $74,9992,322 $75,000 to $99,9991,733 $100,000 to $124,9991,833 $125,000 to $149,9991,449 $150,000 to $199,9991,299 $200,000 or more
Home value of owner - occupied houses in 2022 in Spanish Fork, UT 32 Less than $10,0004 $10,000 to $14,99923 $25,000 to $29,99914 $30,000 to $34,99917 $35,000 to $39,99969 $40,000 to $49,9999 $50,000 to $59,99919 $70,000 to $79,99911 $90,000 to $99,9997 $125,000 to $149,99911 $150,000 to $174,99932 $175,000 to $199,999210 $200,000 to $249,999507 $250,000 to $299,9991,774 $300,000 to $399,9992,607 $400,000 to $499,9992,647 $500,000 to $749,999865 $750,000 to $999,999127 $1,000,000 to $1,499,99996 $2,000,000 or moreRent paid by renters in 2022 in Spanish Fork, UT 2 $150 to $1995 $250 to $2997 $300 to $34944 $400 to $44917 $450 to $49956 $500 to $54923 $550 to $59917 $600 to $64943 $650 to $69948 $700 to $749113 $750 to $799137 $800 to $899203 $900 to $999653 $1,000 to $1,249212 $1,250 to $1,499527 $1,500 to $1,99985 $2,000 to $2,4995 $3,000 to $3,49910 $3,500 or more287 No cash rent
Percentage of workers working in this county: 92.6%Number of people working at home: 3,117 (14.3% of all workers )
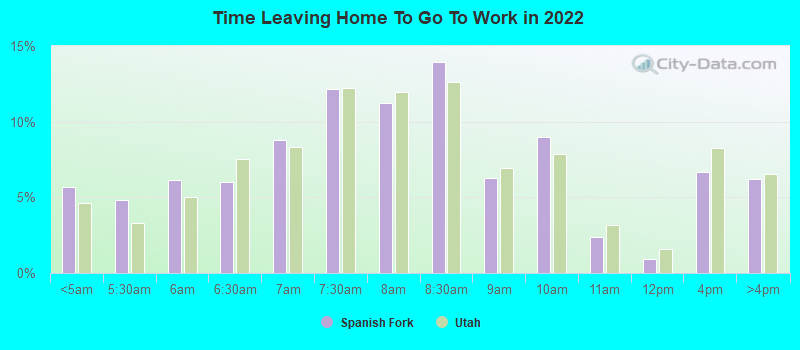
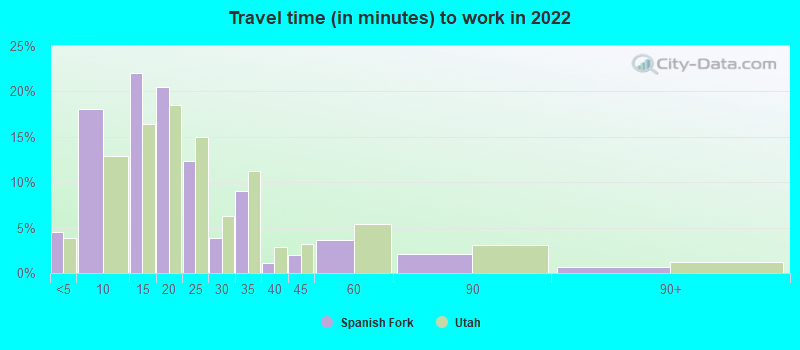
Travel time to work (commute)
Less than 5 minutes: 8185 to 9 minutes: 2,84810 to 14 minutes: 3,32415 to 19 minutes: 3,02620 to 24 minutes: 3,00125 to 29 minutes: 1,48330 to 34 minutes: 1,71535 to 39 minutes: 35240 to 44 minutes: 26045 to 59 minutes: 80060 to 89 minutes: 56390 or more minutes: 102
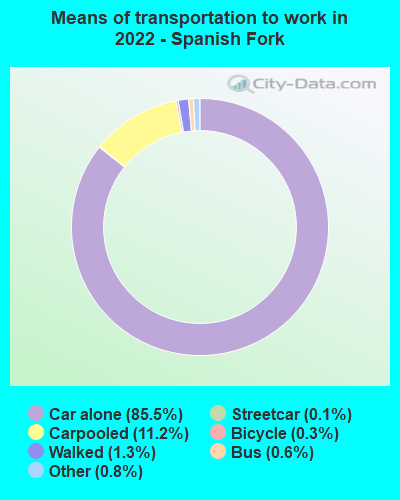
Means of transportation to work:
Drove a car alone: 13,920 (71.6%)Carpooled: 1,804 (9.3%)Bus : 105 (0.5%)Subway or elevated rail : 22 (0.1%)Taxi: 148 (0.8%)Bicycle: 53 (0.3%)Walked: 159 (0.8%)Worked at home: 3,117 (16.0%)
Unemployment by race in 2022
Unemployment rate for White non-Hispanic residents 1.4% Males1.8% FemalesUnemployment rate for Asian residents 20.9% FemalesUnemployment rate for other race residents 2.7% MalesUnemployment rate for two or more race residents 4.9% FemalesUnemployment rate for Hispanic or Latino residents 0.9% Males1.9% Females
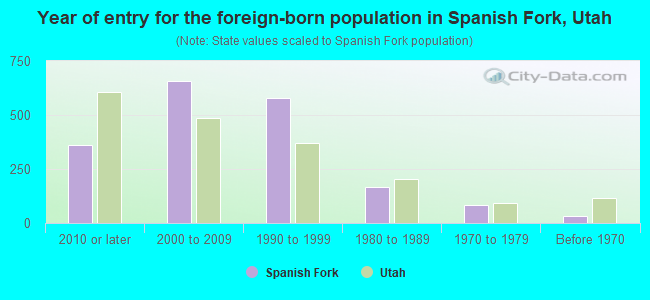
Year of entry for the foreign-born population in Spanish Fork, Utah
360 2010 or later 658 2000 to 2009 580 1990 to 1999 168 1980 to 1989 82 1970 to 1979 31 Before 1970
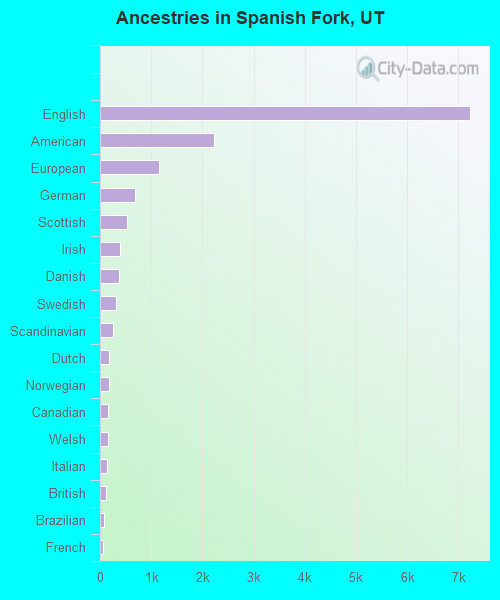
First ancestries reported:
English: 7,236 (36.6%)
American: 2,232 (11.3%)
European: 1,161 (5.9%)
German: 693 (3.5%)
Scottish: 528 (2.7%)
Irish: 391 (2.0%)
Danish: 363 (1.8%)
Swedish: 315 (1.6%)
Scandinavian: 253 (1.3%)
Dutch: 178 (0.9%)
Norwegian: 167 (0.8%)
Canadian: 158 (0.8%)
Welsh: 147 (0.7%)
Italian: 142 (0.7%)
British: 124 (0.6%)
Brazilian: 76 (0.4%)
French: 68 (0.3%)
Swiss: 48 (0.2%)
Scotch-Irish: 33 (0.2%)
Icelander: 29 (0.1%)
French Canadian: 28 (0.1%)
Polish: 27 (0.1%)
Northern European: 26 (0.1%)
Slovene: 21 (0.1%)
Basque: 18 (0.09%)
African: 18 (0.09%)
Greek: 16 (0.08%)
Russian: 15 (0.08%)
Czech: 11 (0.06%)
Arab: 10 (0.05%)
Romanian: 10 (0.05%)
Armenian: 8 (0.04%)
Portuguese: 7 (0.04%) Most common places of birth for foreign-born residents (%): Mexico Spanish Fork:
44.7% (879)Utah:
36.1% (99,740)
Argentina Spanish Fork:
6.8% (134)Utah:
1.3% (3,570)
Italy Spanish Fork:
6.7% (131)Utah:
0.2% (685)
Canada Spanish Fork:
6.1% (119)Utah:
3.0% (8,341)
El Salvador Spanish Fork:
5.1% (101)Utah:
2.6% (7,062)
Venezuela Spanish Fork:
4.8% (94)Utah:
3.2% (8,804)
Peru Spanish Fork:
4.4% (86)Utah:
2.9% (7,901)
Chile Spanish Fork:
4.0% (78)Utah:
1.3% (3,479)
Bolivia Spanish Fork:
2.3% (45)Utah:
0.4% (977)
England Spanish Fork:
1.9% (37)Utah:
1.1% (2,900)
Place of birth for U.S.-born residents:
This state: 31,930Other state: 10,597Northeast: 460Midwest: 1,310South: 1,477West: 7,348 88.7% of Spanish Fork residents lived in the same house 1 years ago.
Out of people who lived in different houses, 38.8% lived in this county.
Out of people who lived in different counties, 48.1% lived in Utah.
Spanish Fork:
88.7%State average:
85.7%
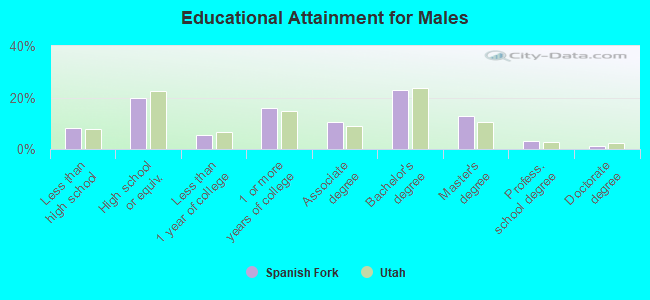
Education attainment for males 25 years and older:
No schooling: 114Nursery to 4th grade: 235th and 6th grade: 77th and 8th grade: 759th grade: 2610th grade: 13511th grade: 20312th grade, no diploma: 410High school graduate (or equivalency): 2,477Less than 1 year of college: 672Some college more than 1 year, no degree: 1,996Associate degree: 1,311Bachelor's degree: 2,830Master's degree: 1,586Professional school degree: 367Doctorate degree: 157
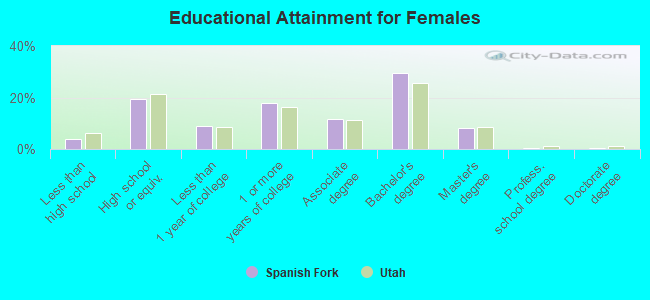
Education attainment for females 25 years and older:
No schooling: 110Nursery to 4th grade: 05th and 6th grade: 267th and 8th grade: 709th grade: 310th grade: 2511th grade: 10012th grade, no diploma: 146High school graduate (or equivalency): 2,290Less than 1 year of college: 1,066Some college more than 1 year, no degree: 2,112Associate degree: 1,363Bachelor's degree: 3,474Master's degree: 966Professional school degree: 61Doctorate degree: 27
Housing units in structures:
One, detached: 10,063One, attached: 1,578Two: 3793 or 4: 2615 to 9: 32210 to 19: 23820 to 49: 114Mobile homes: 7Housing units lacking complete plumbing facilities in 2022: 0.2%Housing units lacking complete kitchen facilities in 2022: 0.2%House/condo owner moved in on average 7 years ago
Renter moved in on average 2 years ago
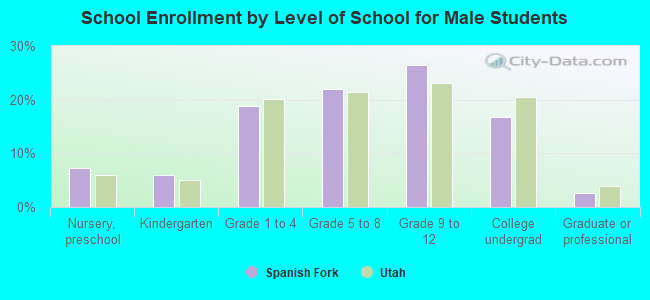
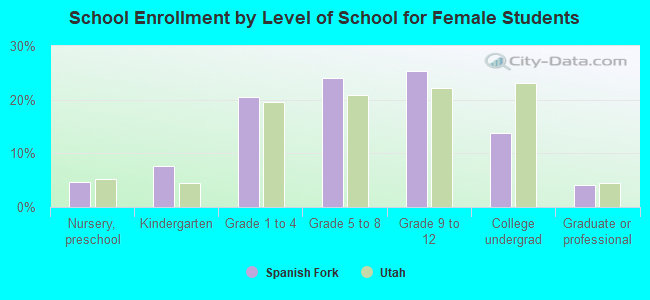
Private vs. public school enrollment:
Students in private schools in grades 1 to 8 (elementary and middle school): 350 Students in private schools in grades 9 to 12 (high school): 163 Students in private undergraduate colleges: 456