Spring City, TN (Tennessee) Houses and Residents
| Spring City: | $165,285 |
| Tennessee: | $284,800 |
Mean price in 2022:
Detached houses: $206,017
Here: $206,017 State: $374,382 Mobile homes: $61,860
Here: $61,860 State: $101,421
Total population: 2,009 (Urban population: 0, Rural population: 2,019 (13 farm, 2,006 nonfarm))
Houses: 1,157 (1,043 occupied: 722 owner occupied, 338 renter occupied)
| % of renters here: | 32% |
| State: | 33% |
Housing density: 474 houses/condos per square mile
Median price asked for vacant for-sale houses and condos in 2022 in this county: $337,634.
Median contract rent in 2022: $511 (lower quartile is $330, upper quartile is $716)
Median rent asked for vacant for-rent units in 2022: $602
Median gross rent in Spring City, TN in 2022: $686
Housing units in Spring City with a mortgage: 365 (36 second mortgage, 0 home equity loan, 16 both second mortgage and home equity loan)
Houses without a mortgage: 1
Median household income for houses/condos with a mortgage: $66,486
Median household income for apartments without a mortgage: $36,721
Median monthly housing costs: $627
Compare current foreclosures in Spring City, TN:
| Photo | Address | Area | Beds / Baths | Price | Details |
|---|---|---|---|---|---|

|
#1
Lavender St
Spring City, TN 37381
|
1,041 sq. feet
|
1 baths 3 beds |
show details | |

|
#2
Hickory Dr
Spring City, TN 37381
|
912 sq. feet
|
1 baths - beds |
show details | |

|
#3
Evans Ave
Spring City, TN 37381
|
912 sq. feet
|
1 baths - beds |
show details | |

|
#4
Clinton Ave
Spring City, TN 37381
|
1,040 sq. feet
|
1 baths - beds |
show details | |

|
#5
Vanns Creek Rd
Spring City, TN 37381
|
1,092 sq. feet
|
1 baths - beds |
show details | |

|
#6
Wolf Creek Rd
Spring City, TN 37381
|
1,250 sq. feet
|
2 baths - beds |
show details | |

|
#7
New Lake Rd
Spring City, TN 37381
|
1,104 sq. feet
|
1 baths - beds |
show details | |

|
#8
Old Rhea Springs Rd
Spring City, TN 37381
|
1,256 sq. feet
|
2 baths - beds |
show details | |

|
#9
Pierce Hill St
Spring City, TN 37381
|
1,353 sq. feet
|
1 baths - beds |
show details | |

|
#10
Ed Davis Ln
Spring City, TN 37381
|
1,848 sq. feet
|
2 baths - beds |
show details |
| Photo | Address | Area | Beds / Baths | Price | Details |
|---|---|---|---|---|---|

|
#11
Porter Lake Rd
Spring City, TN 37381
|
1,260 sq. feet
|
2 baths - beds |
show details | |

|
#12
Rhea Dr
Spring City, TN 37381
|
2,436 sq. feet
|
3 baths - beds |
show details | |

|
#13
Overlook Trl
Spring City, TN 37381
|
600 sq. feet
|
1 baths - beds |
show details | |

|
#14
Oak St
Spring City, TN 37381
|
- sq. feet
|
- baths - beds |
show details | |

|
#15
Pocahontas Ave
Spring City, TN 37381
|
1,000 sq. feet
|
- baths - beds |
show details | |

|
#16
Randall Fugate Rd
Spring City, TN 37381
|
1,612 sq. feet
|
- baths - beds |
show details | |

|
#17
Walnut St
Spring City, TN 37381
|
- sq. feet
|
- baths - beds |
show details | |

|
#18
Macedonia Rd
Spring City, TN 37381
|
- sq. feet
|
- baths - beds |
show details | |

|
#19
W Rhea Ave
Spring City, TN 37381
|
- sq. feet
|
- baths - beds |
show details | |

|
#20
Macedonia Rd
Spring City, TN 37381
|
- sq. feet
|
- baths - beds |
show details |
| Photo | Address | Area | Beds / Baths | Price | Details |
|---|---|---|---|---|---|

|
#21
Bruce Ln
Spring City, TN 37381
|
- sq. feet
|
- baths - beds |
show details | |

|
#22
Presley Ln
Spring City, TN 37381
|
- sq. feet
|
- baths - beds |
show details | |

|
#23
Pierce St
Spring City, TN 37381
|
- sq. feet
|
- baths - beds |
show details | |

|
#24
Shepherd Ln
Spring City, TN 37381
|
- sq. feet
|
- baths - beds |
show details | |

|
#25
Ezell Home Ln
Spring City, TN 37381
|
- sq. feet
|
- baths - beds |
show details | |

|
#26
Toestring Valley Road
Spring City, TN 37381
|
- sq. feet
|
- baths - beds |
show details | |

|
#27
Mars Hill Rd
Spring City, TN 37381
|
- sq. feet
|
- baths - beds |
show details | |

|
#28
Briley Rd
Spring City, TN 37381
|
- sq. feet
|
- baths - beds |
show details | |

|
#29
Murray Ave
Spring City, TN 37381
|
- sq. feet
|
- baths - beds |
show details | |

|
#30
Stump Hollow Rd
Spring City, TN 37381
|
- sq. feet
|
- baths - beds |
show details |
| Photo | Address | Area | Beds / Baths | Price | Details |
|---|---|---|---|---|---|

|
#31
Autumn Ridge Cir Apt 3
Spring City, TN 37381
|
- sq. feet
|
- baths - beds |
show details | |

|
#32
Price Cir Apt 1
Spring City, TN 37381
|
- sq. feet
|
- baths - beds |
show details | |

|
#33
Rhea County Hwy
Spring City, TN 37381
|
- sq. feet
|
- baths - beds |
show details | |

|
#34
Old Stage Rd
Spring City, TN 37381
|
- sq. feet
|
- baths - beds |
show details | |

|
#35
Toestring Valley Rd
Spring City, TN 37381
|
- sq. feet
|
- baths - beds |
show details | |

|
#36
John Ross Rd
Spring City, TN 37381
|
- sq. feet
|
- baths - beds |
show details | |

|
#37
Wolf Creek Rd
Spring City, TN 37381
|
- sq. feet
|
- baths - beds |
show details | |

|
#38
Big Ridge Rd
Spring City, TN 37381
|
- sq. feet
|
- baths - beds |
show details | |

|
#39
Hickory Dr
Spring City, TN 37381
|
- sq. feet
|
- baths - beds |
show details | |

|
#40
Waldo Ln
Spring City, TN 37381
|
- sq. feet
|
- baths - beds |
show details |
| Photo | Address | Area | Beds / Baths | Price | Details |
|---|---|---|---|---|---|

|
#41
Knoll Crst
Spring City, TN 37381
|
- sq. feet
|
- baths - beds |
show details | |

|
Check over 1 million property listings on Foreclosure.com!
|
browse all offers | |||


 | waterfront homes? (15 replies) |
| Oh please no, not another relocation post (6 replies) |
| Potential mother/daughter move to TN (2 replies) |
| What is spring city tn like? Are people nice? good hiking?Weather?Is it a good investment? (4 replies) |
| Information on Spring City (11 replies) |
| Knoxville Vacation Rental Search (3 replies) |

Median year apartment built: 1978
Household type by relationship:
Households: 2,336- Male householders: 502 (185 living alone), Female householders: 528 (246 living alone)
399 spouses (399 opposite-sex spouses), 66 unmarried partners, (47 opposite-sex unmarried partners), 551 children (469 natural, 15 adopted, 67 stepchildren), 100 grandchildren, 27 brothers or sisters, 29 parents, 0 foster children, 21 other relatives, 13 non-relatives
- In group quarters: 95
Size of family households: 227 2-persons, 133 3-persons, 95 4-persons, 66 5-persons, 21 6-persons, 12 7-or-more-persons.
Size of nonfamily households: 439 1-person, 59 2-persons, 4 4-persons.
321 married couples with children.
107 single-parent households (35 men, 72 women).
99.7% of residents of Spring City speak English at home.
0.3% of residents speak other Indo-European language at home (100% speak English very well).
| Here: | 6.1 |
| State: | 6.5 |
| Here: | 3.9 |
| State: | 4.4 |

- Bedrooms in owner-occupied houses and condos in Spring City, Tennessee
- 0no bedroom
- 01 bedroom
- 1462 bedrooms
- 4143 bedrooms
- 924 bedrooms
- 705+ bedrooms

- Bedrooms in renter-occupied apartments in Spring City, Tennessee
- 0no bedroom
- 521 bedroom
- 2082 bedrooms
- 723 bedrooms
- 64 bedrooms
- 05+ bedrooms

- Cars and other vehicles available in Spring City in owner-occupied houses/condos
- 34no vehicle
- 1741 vehicle
- 2082 vehicles
- 1863 vehicles
- 914 vehicles
- 305+ vehicles

- Cars and other vehicles available in Spring City in renter-occupied apartments
- 94no vehicle
- 1201 vehicle
- 1162 vehicles
- 83 vehicles
- 04 vehicles
- 05+ vehicles

- Rooms in owner-occupied houses in Spring City, Tennessee
- 01 room
- 02 rooms
- 33 rooms
- 1054 rooms
- 1515 rooms
- 1756 rooms
- 1477 rooms
- 648 rooms
- 789+ rooms

- Rooms in renter-occupied apartments in Spring City, Tennessee
- 01 room
- 02 rooms
- 1043 rooms
- 1304 rooms
- 295 rooms
- 596 rooms
- 127 rooms
- 58 rooms
- 09+ rooms


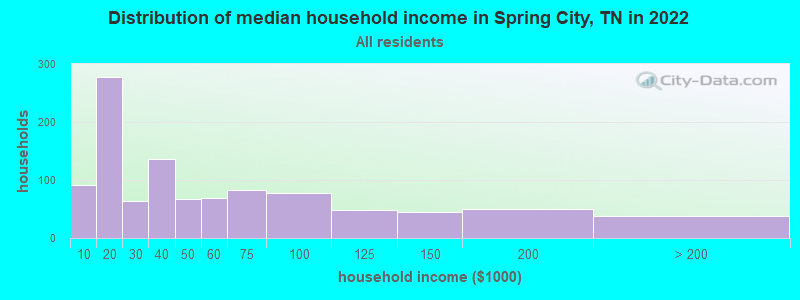
Spring City, TN household income distribution

- 91Less than $10,000
- 277$10,000 to $19,999
- 63$20,000 to $29,999
- 136$30,000 to $39,999
- 67$40,000 to $49,999
- 69$50,000 to $59,999
- 83$60,000 to $74,999
- 78$75,000 to $99,999
- 49$100,000 to $124,999
- 45$125,000 to $149,999
- 50$150,000 to $199,999
- 38$200,000 or more
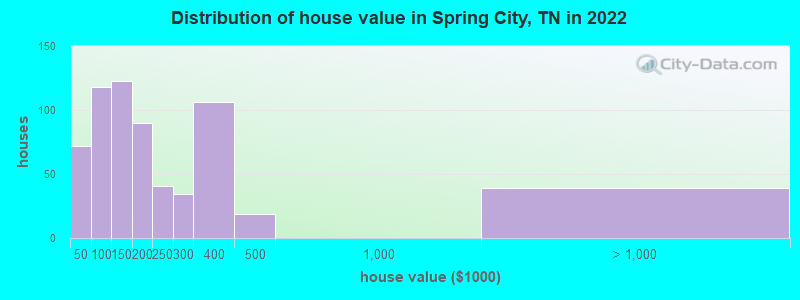
Home value of owner - occupied houses in 2022 in Spring City, TN
-
- 6Less than $10,000
- 5$10,000 to $14,999
- 20$20,000 to $24,999
- 4$25,000 to $29,999
- 26$30,000 to $34,999
- 8$40,000 to $49,999
- 8$50,000 to $59,999
- 8$60,000 to $69,999
- 9$70,000 to $79,999
- 72$80,000 to $89,999
- 9$90,000 to $99,999
- 91$100,000 to $124,999
- 31$125,000 to $149,999
- 52$150,000 to $174,999
- 38$175,000 to $199,999
- 41$200,000 to $249,999
- 33$250,000 to $299,999
- 105$300,000 to $399,999
- 19$400,000 to $499,999
- 21$1,000,000 to $1,499,999
- 17$1,500,000 to $1,999,999
Rent paid by renters in 2022 in Spring City, TN
-
- 32$150 to $199
- 25$200 to $249
- 8$250 to $299
- 10$300 to $349
- 25$350 to $399
- 21$400 to $449
- 25$450 to $499
- 1$500 to $549
- 17$550 to $599
- 6$600 to $649
- 51$650 to $699
- 9$750 to $799
- 3$800 to $899
- 8$900 to $999
- 18$1,000 to $1,249
- 48No cash rent


Percentage of workers working in this county: 71.2%
Number of people working at home: 63 (8.2% of all workers)

Travel time to work (commute)
- Less than 5 minutes: 67
- 5 to 9 minutes: 91
- 10 to 14 minutes: 30
- 15 to 19 minutes: 80
- 20 to 24 minutes: 107
- 25 to 29 minutes: 91
- 30 to 34 minutes: 73
- 35 to 39 minutes: 57
- 40 to 44 minutes: 10
- 45 to 59 minutes: 26
- 60 to 89 minutes: 61
- 90 or more minutes: 0
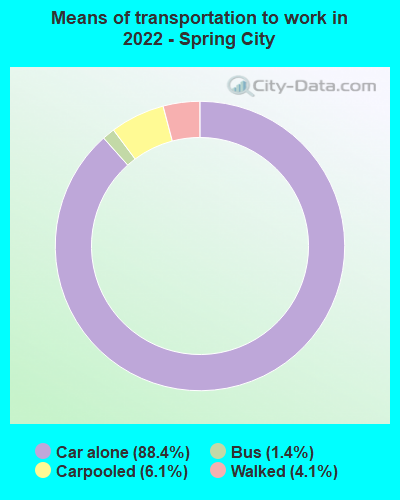
Means of transportation to work:
- Drove a car alone: 1,236 (81.6%)
- Carpooled: 89 (5.9%)
- Bus: 17 (1.1%)
- Walked: 58 (3.8%)
- Worked at home: 63 (4.2%)

- Unemployment by race in 2022
- Unemployment rate for White non-Hispanic residents
- 7.6%Males
- 4.4%Females
- Unemployment rate for Hispanic or Latino residents
- 100.0%Males

- Year of entry for the foreign-born population in Spring City, Tennessee
- 01995 to March 2000
- 01990 to 1994
- 01985 to 1989
- 31980 to 1984
- 01975 to 1979
- 01970 to 1974
- 01965 to 1969
- 4Before 1965

First ancestries reported:
- American: 232 (31.7%)
- English: 102 (14.0%)
- German: 67 (9.2%)
- Polish: 37 (5.1%)
- Scottish: 36 (4.9%)
- Irish: 33 (4.5%)
- Scotch-Irish: 30 (4.1%)
- Welsh: 17 (2.3%)
- European: 4 (0.5%)
- French Canadian: 4 (0.5%)
- Italian: 4 (0.5%)
Most common places of birth for foreign-born residents (%):
| Spring City: | 57.1% (4) |
| Tennessee: | 0.1% (207) |
| Spring City: | 42.9% (3) |
| Tennessee: | 0.3% (546) |
Place of birth for U.S.-born residents:
- This state: 1,414
- Other state: 917
- Northeast: 66
- Midwest: 232
- South: 430
- West: 192
79.2% of Spring City residents lived in the same house 1 years ago.
Out of people who lived in different houses, 28.7% lived in this county.
Out of people who lived in different counties, 40.8% lived in Tennessee.
| Spring City: | 79.2% |
| State average: | 87.0% |
Education attainment for males 25 years and older:
- No schooling: 10
- Nursery to 4th grade: 8
- 5th and 6th grade: 16
- 7th and 8th grade: 30
- 9th grade: 3
- 10th grade: 13
- 11th grade: 11
- 12th grade, no diploma: 26
- High school graduate (or equivalency): 341
- Less than 1 year of college: 93
- Some college more than 1 year, no degree: 163
- Associate degree: 10
- Bachelor's degree: 54
- Master's degree: 22
- Professional school degree: 0
- Doctorate degree: 15

Education attainment for females 25 years and older:
- No schooling: 10
- Nursery to 4th grade: 4
- 5th and 6th grade: 17
- 7th and 8th grade: 22
- 9th grade: 37
- 10th grade: 15
- 11th grade: 22
- 12th grade, no diploma: 3
- High school graduate (or equivalency): 319
- Less than 1 year of college: 75
- Some college more than 1 year, no degree: 156
- Associate degree: 54
- Bachelor's degree: 145
- Master's degree: 0
- Professional school degree: 12
- Doctorate degree: 0


Housing units in structures:
- One, detached: 844
- One, attached: 36
- Two: 36
- 3 or 4: 105
- 5 to 9: 19
- 10 to 19: 12
- 20 to 49: 5
- Mobile homes: 98
Median worth of mobile homes: $30,968
Housing units lacking complete kitchen facilities in 2022: 0.9%
House/condo owner moved in on average 16 years ago
Renter moved in on average 4 years ago

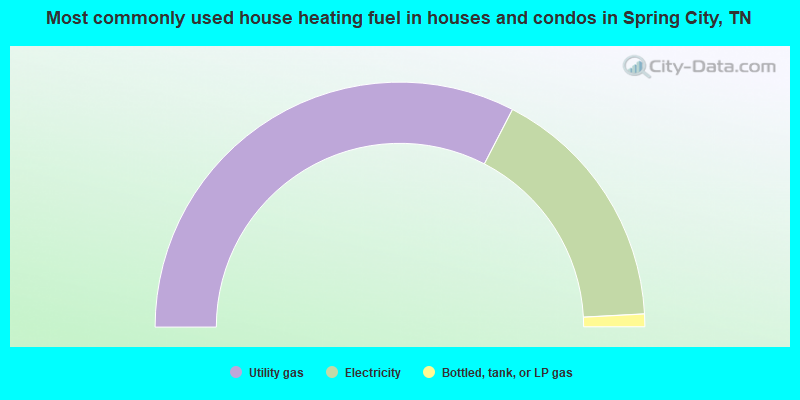
- 65.2%Utility gas
- 33.1%Electricity
- 1.7%Bottled, tank, or LP gas
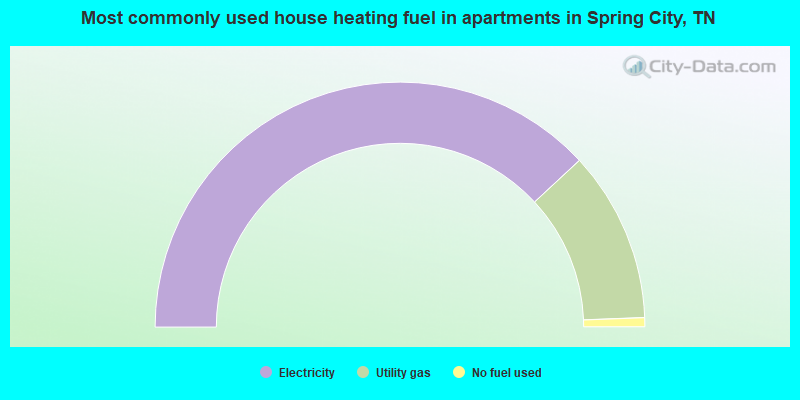
- 76.2%Electricity
- 22.6%Utility gas
- 1.2%No fuel used
Private vs. public school enrollment:
| Here: | 17.9% |
| Tennessee: | 15.0% |
| Here: | 42.3% |
| Tennessee: | 16.2% |
| Here: | 35.7% |
| Tennessee: | 23.5% |


