Spring Hope, NC (North Carolina) Houses and Residents
| Spring Hope: | $128,029 |
| North Carolina: | $280,600 |
Mean price in 2022:
Detached houses: $145,318
Here: $145,318 State: $375,326 Mobile homes: $68,439
Here: $68,439 State: $124,933
Total population: 1,316 (Urban population: 0, Rural population: 1,245 (7 farm, 1,238 nonfarm))
Houses: 824 (728 occupied: 256 owner occupied, 470 renter occupied)
| % of renters here: | 65% |
| State: | 33% |
Housing density: 590 houses/condos per square mile
Median price asked for vacant for-sale houses and condos in 2022 in this county: $119,117.
Median contract rent in 2022: $532 (lower quartile is $285, upper quartile is $678)
Median rent asked for vacant for-rent units in 2022: $1,781
Median gross rent in Spring Hope, NC in 2022: $721
Housing units in Spring Hope with a mortgage: 161 (2 second mortgage, 0 home equity loan, 2 both second mortgage and home equity loan)
Houses without a mortgage: 3
Median household income for houses/condos with a mortgage: $76,527
Median household income for apartments without a mortgage: $32,922
Median monthly housing costs: $750
Compare current foreclosures near Spring Hope, NC:
| Photo | Address | Area | Beds / Baths | Price | Details |
|---|---|---|---|---|---|

|
#1
Strawbush Rd
Spring Hope, NC 27882
|
1,920 sq. feet
|
2 baths 3 beds |
show details | |

|
#2
Richardson Rd
Spring Hope, NC 27882
|
1,512 sq. feet
|
2 baths 4 beds |
show details | |

|
#3
Nichole Rd
Spring Hope, NC 27882
|
1,716 sq. feet
|
2 baths 3 beds |
show details | |

|
#4
Sheep Pasture Rd
Spring Hope, NC 27882
|
2,938 sq. feet
|
2 baths 3 beds |
show details | |

|
#5
Strawbush Rd
Spring Hope, NC 27882
|
1,690 sq. feet
|
2 baths 3 beds |
show details | |

|
#6
Peachtree Hills Rd
Spring Hope, NC 27882
|
2,040 sq. feet
|
2 baths 3 beds |
show details | |

|
#7
S Nc 581
Spring Hope, NC 27882
|
576 sq. feet
|
- baths - beds |
show details | |

|
#8
Wiggins Rd
Spring Hope, NC 27882
|
- sq. feet
|
- baths - beds |
show details | |

|
#9
Moss Rd
Spring Hope, NC 27882
|
- sq. feet
|
- baths - beds |
show details | |

|
#10
W Nc 97
Spring Hope, NC 27882
|
- sq. feet
|
- baths - beds |
show details |
| Photo | Address | Area | Beds / Baths | Price | Details |
|---|---|---|---|---|---|

|
#11
Nashville Rd
Rocky Mount, NC 27803
|
1,118 sq. feet
|
1 baths 2 beds |
$45,000
|
show details |

|
#12
Strickland Rd
Louisburg, NC 27549
|
1,720 sq. feet
|
2 baths 3 beds |
show details | |

|
#13
Selma Rd
Middlesex, NC 27557
|
1,506 sq. feet
|
2 baths 3 beds |
show details | |

|
#14
Periwinkle Pl
Rocky Mount, NC 27804
|
1,224 sq. feet
|
2 baths 3 beds |
show details | |

|
#15
Maltese Rd
Middlesex, NC 27557
|
1,512 sq. feet
|
2 baths 3 beds |
show details | |

|
#16
Woodstream Dr
Bailey, NC 27807
|
1,552 sq. feet
|
2 baths 3 beds |
show details | |

|
#17
Stott St
Bailey, NC 27807
|
1,940 sq. feet
|
2 baths 3 beds |
show details | |

|
#18
Shellcastle Rd
Rocky Mount, NC 27804
|
4,691 sq. feet
|
4 baths 4 beds |
show details | |

|
#19
Camp Charles Rd
Bailey, NC 27807
|
2,432 sq. feet
|
3 baths 4 beds |
show details | |

|
#20
Reges Store Rd
Nashville, NC 27856
|
1,468 sq. feet
|
2 baths 3 beds |
show details |
| Photo | Address | Area | Beds / Baths | Price | Details |
|---|---|---|---|---|---|

|
#21
Benjamin Ct
Rocky Mount, NC 27803
|
1,634 sq. feet
|
2 baths 3 beds |
show details | |

|
#22
Country Club Dr N
Wilson, NC 27896
|
3,974 sq. feet
|
3 baths 4 beds |
show details | |

|
#23
Garden Gate Dr
Rocky Mount, NC 27803
|
1,788 sq. feet
|
2 baths 3 beds |
show details | |

|
#24
Ronald Tharrington Rd
Louisburg, NC 27549
|
1,938 sq. feet
|
2 baths 3 beds |
show details | |

|
#25
Beechwood Dr
Rocky Mount, NC 27803
|
1,605 sq. feet
|
2 baths 2 beds |
show details | |

|
#26
Ponte Vedra Ln N
Wilson, NC 27896
|
3,528 sq. feet
|
4 baths 3 beds |
show details | |

|
#27
Bethlehem Rd
Rocky Mount, NC 27803
|
2,229 sq. feet
|
2 baths 3 beds |
show details | |

|
#28
N Lumber St
Nashville, NC 27856
|
1,053 sq. feet
|
1 baths 2 beds |
show details | |

|
#29
Bissette Rd
Middlesex, NC 27557
|
1,060 sq. feet
|
1 baths 2 beds |
show details | |

|
#30
Oakland Ave
Rocky Mount, NC 27804
|
1,720 sq. feet
|
2 baths 4 beds |
show details |
| Photo | Address | Area | Beds / Baths | Price | Details |
|---|---|---|---|---|---|

|
#31
Berkley Dr
Rocky Mount, NC 27803
|
1,568 sq. feet
|
2 baths 4 beds |
show details | |

|
#32
Burnside Dr NW
Wilson, NC 27896
|
1,484 sq. feet
|
3 baths 3 beds |
show details | |

|
#33
Chamberlain Dr NW
Wilson, NC 27896
|
2,013 sq. feet
|
3 baths 3 beds |
show details | |

|
#34
Lakeside Dr NW
Wilson, NC 27896
|
3,112 sq. feet
|
4 baths 4 beds |
show details | |

|
#35
Nc 39 Hwy
Zebulon, NC 27597
|
1,008 sq. feet
|
1 baths 2 beds |
show details | |

|
#36
Hunter Ridge Rd
Rocky Mount, NC 27803
|
1,476 sq. feet
|
2 baths 3 beds |
show details | |

|
#37
S Tillery St
Rocky Mount, NC 27804
|
1,860 sq. feet
|
1 baths 3 beds |
show details | |

|
#38
Ripple Rd
Castalia, NC 27816
|
1,728 sq. feet
|
2 baths 3 beds |
show details | |

|
#39
Old County Home Rd
Nashville, NC 27856
|
1,152 sq. feet
|
2 baths 3 beds |
show details | |

|
#40
Bunk Ln
Middlesex, NC 27557
|
1,706 sq. feet
|
1 baths 3 beds |
show details |
| Photo | Address | Area | Beds / Baths | Price | Details |
|---|---|---|---|---|---|

|
#41
Loblolly Cir
Louisburg, NC 27549
|
2,040 sq. feet
|
3 baths 5 beds |
show details | |

|
#42
Sagamore Dr
Louisburg, NC 27549
|
1,277 sq. feet
|
2 baths 3 beds |
show details | |

|
#43
Horseman Drive
Louisburg, NC 27549
|
1,470 sq. feet
|
2 baths 3 beds |
show details | |

|
#44
Blackfoot Dr
Louisburg, NC 27549
|
925 sq. feet
|
2 baths 3 beds |
show details | |

|
#45
Black Cloud Dr
Louisburg, NC 27549
|
1,828 sq. feet
|
2 baths 3 beds |
show details | |

|
#46
Sportsmans Trl
Rocky Mount, NC 27804
|
1,156 sq. feet
|
1 baths 3 beds |
show details | |

|
#47
Oakwood Dr
Battleboro, NC 27809
|
1,568 sq. feet
|
2 baths 3 beds |
show details | |

|
#48
Bissette Rd
Middlesex, NC 27557
|
1,060 sq. feet
|
1 baths 2 beds |
show details | |

|
#49
Birchwood Village Ct
Nashville, NC 27856
|
1,544 sq. feet
|
2 baths 3 beds |
show details | |

|
Check over 1 million property listings on Foreclosure.com!
|
browse all offers | |||


Median year apartment built: 1976
Household type by relationship:
Households: 1,452- Male householders: 350 (185 living alone), Female householders: 374 (172 living alone)
192 spouses (192 opposite-sex spouses), 46 unmarried partners, (42 opposite-sex unmarried partners), 341 children (334 natural, 0 adopted, 7 stepchildren), 47 grandchildren, 25 brothers or sisters, 33 parents, 0 foster children, 20 other relatives, 19 non-relatives
- In group quarters: 2
Size of family households: 165 2-persons, 64 3-persons, 72 4-persons, 9 5-persons, 15 6-persons.
Size of nonfamily households: 404 1-person, 16 2-persons.
99 married couples with children.
105 single-parent households (10 men, 95 women).
95.9% of residents of Spring Hope speak English at home.
4.0% of residents speak Spanish at home (86% speak English very well, 14% speak English well).
0.1% of residents speak other Indo-European language at home (100% speak English not well).
Foreign born population: 29 (2.0%)
(55.2% of them are naturalized citizens)
| Here: | 6.1 |
| State: | 6.4 |
| Here: | 4.3 |
| State: | 4.4 |

- Bedrooms in owner-occupied houses and condos in Spring Hope, North Carolina
- 0no bedroom
- 01 bedroom
- 572 bedrooms
- 1633 bedrooms
- 254 bedrooms
- 125+ bedrooms

- Bedrooms in renter-occupied apartments in Spring Hope, North Carolina
- 11no bedroom
- 851 bedroom
- 2222 bedrooms
- 1393 bedrooms
- 134 bedrooms
- 05+ bedrooms

- Cars and other vehicles available in Spring Hope in owner-occupied houses/condos
- 6no vehicle
- 661 vehicle
- 762 vehicles
- 313 vehicles
- 664 vehicles
- 125+ vehicles

- Cars and other vehicles available in Spring Hope in renter-occupied apartments
- 90no vehicle
- 2611 vehicle
- 902 vehicles
- 293 vehicles
- 04 vehicles
- 05+ vehicles

- Rooms in owner-occupied houses in Spring Hope, North Carolina
- 01 room
- 02 rooms
- 03 rooms
- 144 rooms
- 595 rooms
- 956 rooms
- 587 rooms
- 178 rooms
- 149+ rooms

- Rooms in renter-occupied apartments in Spring Hope, North Carolina
- 111 room
- 112 rooms
- 743 rooms
- 1774 rooms
- 895 rooms
- 606 rooms
- 297 rooms
- 128 rooms
- 79+ rooms


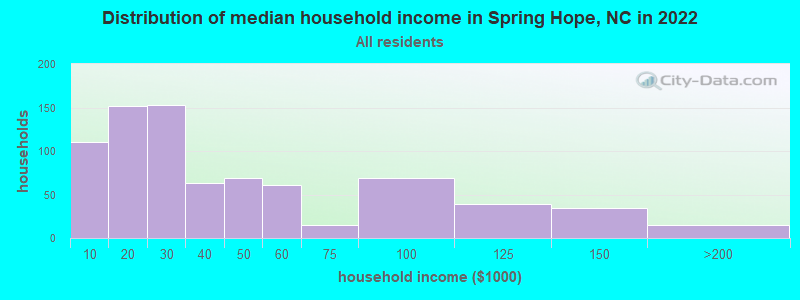
Spring Hope, NC household income distribution

- 110Less than $10,000
- 152$10,000 to $19,999
- 153$20,000 to $29,999
- 63$30,000 to $39,999
- 69$40,000 to $49,999
- 61$50,000 to $59,999
- 15$60,000 to $74,999
- 69$75,000 to $99,999
- 39$100,000 to $124,999
- 35$125,000 to $149,999
- 15$150,000 to $199,999
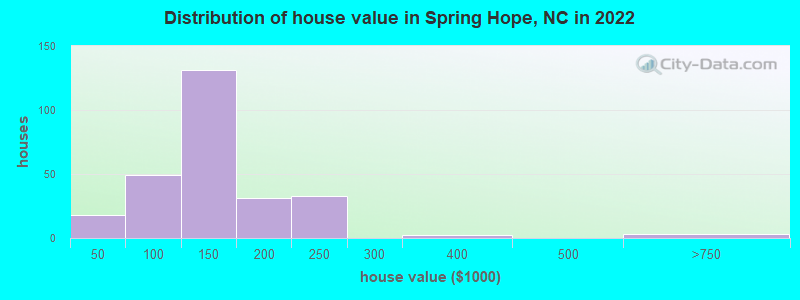
Home value of owner - occupied houses in 2022 in Spring Hope, NC
-
- 3Less than $10,000
- 4$10,000 to $14,999
- 3$15,000 to $19,999
- 7$20,000 to $24,999
- 12$50,000 to $59,999
- 5$70,000 to $79,999
- 18$80,000 to $89,999
- 12$90,000 to $99,999
- 121$100,000 to $124,999
- 9$125,000 to $149,999
- 21$150,000 to $174,999
- 9$175,000 to $199,999
- 32$200,000 to $249,999
- 2$300,000 to $399,999
- 3$500,000 to $749,999
Rent paid by renters in 2022 in Spring Hope, NC
-
- 5Less than $100
- 28$100 to $149
- 67$150 to $199
- 5$200 to $249
- 35$250 to $299
- 3$300 to $349
- 27$350 to $399
- 34$400 to $449
- 19$450 to $499
- 181$500 to $549
- 24$550 to $599
- 12$600 to $649
- 25$650 to $699
- 34$700 to $749
- 8$750 to $799
- 19$800 to $899
- 4$900 to $999
- 31$1,000 to $1,249
- 10$1,250 to $1,499
- 30No cash rent


Percentage of workers working in this county: 55.0%
Number of people working at home: 56 (9.9% of all workers)
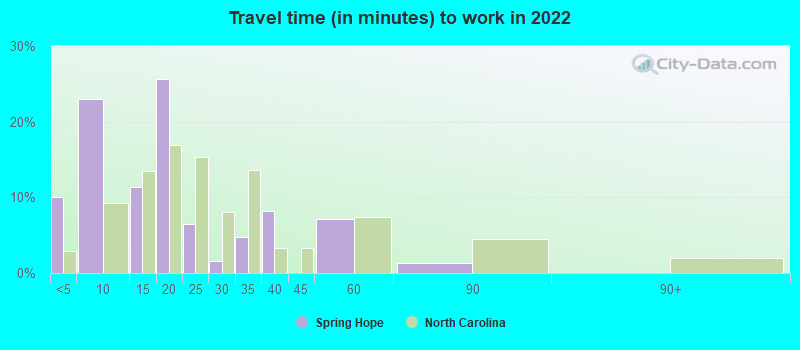
Travel time to work (commute)
- Less than 5 minutes: 73
- 5 to 9 minutes: 35
- 10 to 14 minutes: 9
- 15 to 19 minutes: 40
- 20 to 24 minutes: 36
- 25 to 29 minutes: 7
- 30 to 34 minutes: 135
- 35 to 39 minutes: 29
- 40 to 44 minutes: 6
- 45 to 59 minutes: 99
- 60 to 89 minutes: 77
- 90 or more minutes: 16
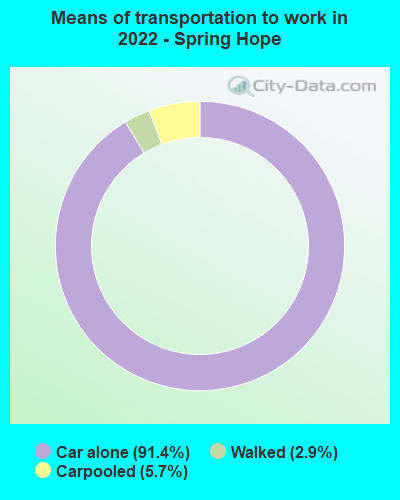
Means of transportation to work:
- Drove a car alone: 909 (82.8%)
- Carpooled: 57 (5.2%)
- Walked: 27 (2.5%)
- Worked at home: 61 (5.6%)

- Unemployment by race in 2022
- Unemployment rate for White non-Hispanic residents
- 1.7%Females
- Unemployment rate for Black residents
- 11.8%Males
- 9.6%Females

- Year of entry for the foreign-born population in Spring Hope, North Carolina
- 02010 or later
- 112000 to 2009
- 181990 to 1999
- 151980 to 1989
- 61970 to 1979
- 5Before 1970

First ancestries reported:
- English: 191 (18.9%)
- American: 93 (9.2%)
- German: 17 (1.7%)
- Scottish: 9 (0.9%)
- European: 8 (0.8%)
- Italian: 7 (0.7%)
- African: 7 (0.7%)
- Irish: 5 (0.5%)
- Norwegian: 5 (0.5%)
- Scotch-Irish: 5 (0.5%)
Most common places of birth for foreign-born residents (%):
| Spring Hope: | 41.9% (13) |
| North Carolina: | 0.7% (6,091) |
| Spring Hope: | 19.4% (6) |
| North Carolina: | 3.8% (33,379) |
| Spring Hope: | 19.4% (6) |
| North Carolina: | 1.2% (9,986) |
| Spring Hope: | 6.5% (2) |
| North Carolina: | 24.7% (214,776) |
Place of birth for U.S.-born residents:
- This state: 1,148
- Other state: 271
- Northeast: 125
- Midwest: 8
- South: 115
- West: 13
80.8% of Spring Hope residents lived in the same house 1 years ago.
Out of people who lived in different houses, 35.2% lived in this county.
Out of people who lived in different counties, 93.8% lived in North Carolina.
| Spring Hope: | 80.8% |
| State average: | 87.3% |
Education attainment for males 25 years and older:
- No schooling: 0
- Nursery to 4th grade: 8
- 5th and 6th grade: 0
- 7th and 8th grade: 9
- 9th grade: 29
- 10th grade: 21
- 11th grade: 170
- 12th grade, no diploma: 9
- High school graduate (or equivalency): 118
- Less than 1 year of college: 85
- Some college more than 1 year, no degree: 87
- Associate degree: 35
- Bachelor's degree: 23
- Master's degree: 8
- Professional school degree: 0
- Doctorate degree: 4

Education attainment for females 25 years and older:
- No schooling: 7
- Nursery to 4th grade: 0
- 5th and 6th grade: 7
- 7th and 8th grade: 12
- 9th grade: 1
- 10th grade: 63
- 11th grade: 33
- 12th grade, no diploma: 33
- High school graduate (or equivalency): 122
- Less than 1 year of college: 18
- Some college more than 1 year, no degree: 148
- Associate degree: 74
- Bachelor's degree: 46
- Master's degree: 38
- Professional school degree: 5
- Doctorate degree: 0


Housing units in structures:
- One, detached: 609
- One, attached: 3
- Two: 32
- 3 or 4: 50
- 5 to 9: 97
- 20 to 49: 4
- Mobile homes: 27
House/condo owner moved in on average 9 years ago
Renter moved in on average 4 years ago

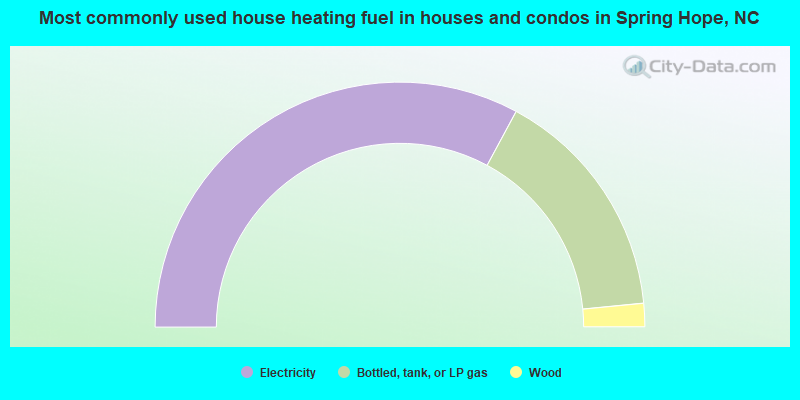
- 65.7%Electricity
- 31.1%Bottled, tank, or LP gas
- 3.1%Wood
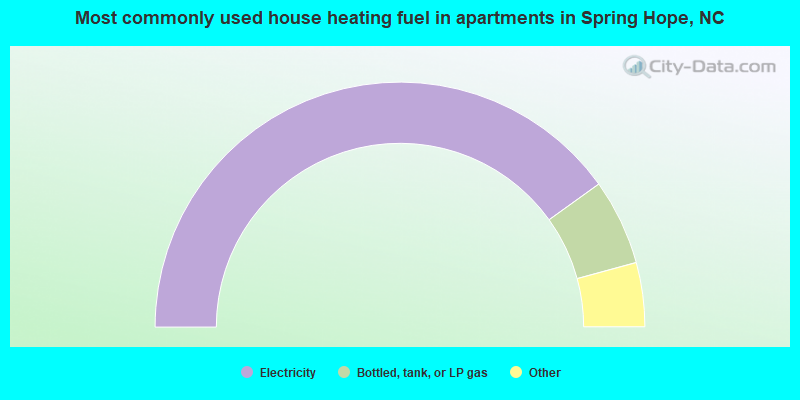
- 80.4%Electricity
- 11.4%Bottled, tank, or LP gas
- 3.2%Fuel oil, kerosene, etc.
- 2.6%Utility gas
- 1.3%Wood
- 1.1%No fuel used
Private vs. public school enrollment:
| Here: | 13.9% |
| North Carolina: | 13.8% |
| Here: | 9.8% |
| North Carolina: | 11.9% |
| Here: | 3.4% |
| North Carolina: | 19.3% |


