Spring, TX (Texas) Houses and Residents
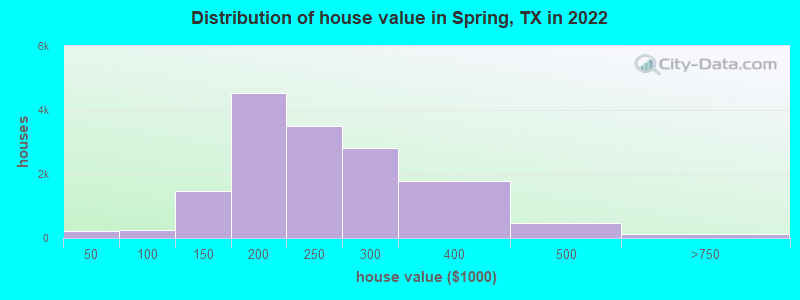
Estimated median house or condo value in 2022: $223,000 (it was $73,600 in 2000 )
Spring:
$223,000Texas:
$275,400
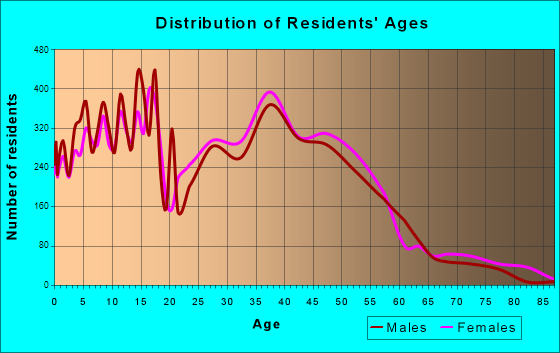
Lower value quartile - upper value quartile: $173,300 - $286,600Total population: 54,298 (Urban population: 35,147, Rural population: 1,287 (all nonfarm) )
Houses: 25,070 (23,971 occupied: 18,865 owner occupied, 5,106 renter occupied )
% of renters here:
21%State:
38%
Housing density: 1,047 houses/condos per square mile
Median price asked for vacant for-sale houses and condos in 2022: $145,848.
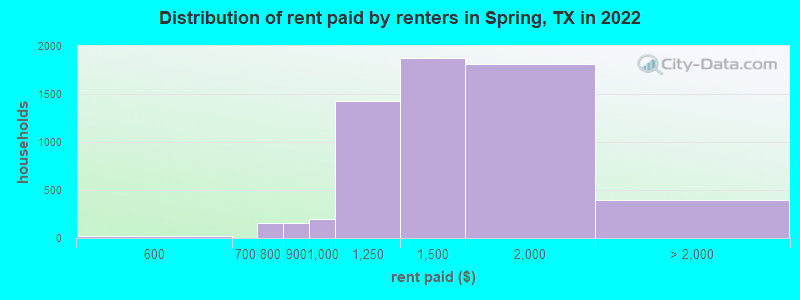
Median contract rent in 2022: $1,309 (lower quartile is $1,146, upper quartile is $1,478)
Median rent asked for vacant for-rent units in 2022: $1,529
Median gross rent in Spring, TX in 2022: $1,456
Housing units in Spring with a mortgage: 11,238 (517 second mortgage, 0 home equity loan, 145 both second mortgage and home equity loan )Houses without a mortgage: 169
Median household income for houses/condos with a mortgage: $99,443
Median household income for apartments without a mortgage: $80,097
Median monthly housing costs: $1,432
Data:
Median house or condo value ($)
Median house or condo value ($ change since 2000)
Median house or condo value ($) - White
Median house or condo value ($) - Black or African American
Median house or condo value ($) - Asian
Median house or condo value ($) - Hispanic or Latino
Median house or condo value ($) - American Indian and Alaska Native
Median house or condo value ($) - Multirace
Median house or condo value ($) - Other Race
Median price asked for mobile homes ($)
Household density (households per square mile)
Mean house or condo value by units in structure - 1, detached ($)
Mean house or condo value by units in structure - 1, attached ($)
Mean house or condo value by units in structure - 2 ($)
Mean house or condo value by units in structure by units in structure - 3 or 4 ($)
Mean house or condo value by units in structure - 5 or more ($)
Mean house or condo value by units in structure - Boat, RV, van, etc. ($)
Mean house or condo value by units in structure - Mobile home ($)
Median contract rent ($)
Median contract rent - Lower quartile ($)
Median contract rent - Upper quartile ($)
Median gross rent ($)
Urban houses (%)
Rural houses (%)
Houses occupied (%)
Houses occupied (% change since 2000)
Houses owner occupied (%)
Houses owner occupied (% change since 2000)
Houses renter occupied (%)
Houses renter occupied (% change since 2000)
Vacant housing units - For rent (%)
Vacant housing units - For rent (% change since 2000)
Vacant housing units - For sale only (%)
Vacant housing units - For sale only (% change since 2000)
Vacant housing units - Rented or sold, not occupied (%)
Vacant housing units - Rented or sold, not occupied (% change since 2000)
Vacant housing units - For seasonal, recreational, or occasional use (%)
Vacant housing units - For seasonal, recreational, or occasional use (% change since 2000)
Vacant housing units - For migrant workers (%)
Vacant housing units - For migrant workers (% change since 2000)
Vacant housing units - Other vacant (%)
Vacant housing units - Other vacant (% change since 2000)
Median monthly housing costs ($)
Median household income for houses/condos with a mortgage ($)
Median household income for houses/condos without a mortgage ($)
Median household income ($)
Median household income ($) - White
Median household income ($) - Black or African American
Median household income ($) - Asian
Median household income ($) - Hispanic or Latino
Median household income ($) - American Indian and Alaska Native
Median household income ($) - Multirace
Median household income ($) - Other Race
Mortgage status - with mortgage (%)
Mortgage status - with second mortgage (%)
Mortgage status - with home equity loan (%)
Mortgage status - with both second mortgage and home equity loan (%)
Mortgage status - without a mortgage (%)
Median year house/condo built
Median year apartment built
Household type by relationship - Male householder living alone (%)
Household type by relationship - Male householder not living alone (%)
Household type by relationship - Female householder living alone (%)
Household type by relationship - Female householder not living alone (%)
Household type by relationship - Opposite-Sex spouse (%)
Household type by relationship - Same-Sex spouse (%)
Household type by relationship - Opposite-Sex unmarried partner (%)
Household type by relationship - Same-Sex unmarried partner (%)
Household type by relationship - In group quarters (%)
Size of family households - 2-person household (%)
Size of family households - 3-person household (%)
Size of family households - 4-person household (%)
Size of family households - 5-person household (%)
Size of family households - 6-person household (%)
Size of family households - 7-or-more-person household (%)
Size of nonfamily households - 1-person household (%)
Size of nonfamily households - 2-person household (%)
Size of nonfamily households - 3-person household (%)
Size of nonfamily households - 4-person household (%)
Size of nonfamily households - 5-person household (%)
Size of nonfamily households - 6-person household (%)
Size of nonfamily households - 7-or-moreperson household (%)
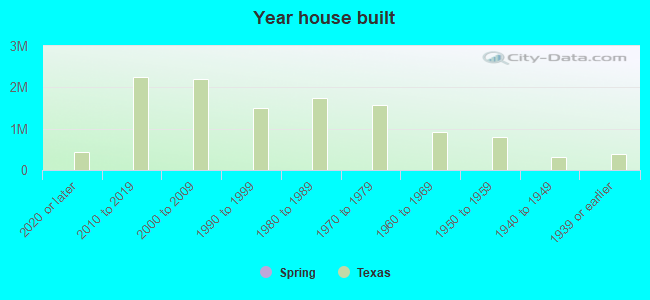
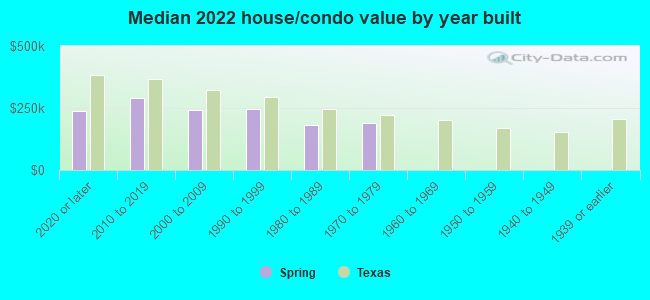
Year house built - Built 2010 or later (%)
Year house built - Built 2000 to 2009 (%)
Year house built - Built 1990 to 1999 (%)
Year house built - Built 1980 to 1989 (%)
Year house built - Built 1970 to 1979 (%)
Year house built - Built 1960 to 1969 (%)
Year house built - Built 1950 to 1959 (%)
Year house built - Built 1940 to 1949 (%)
Year house built - Built 1939 or earlier (%)
Median number of rooms in houses and condos
Median number of rooms in apartments
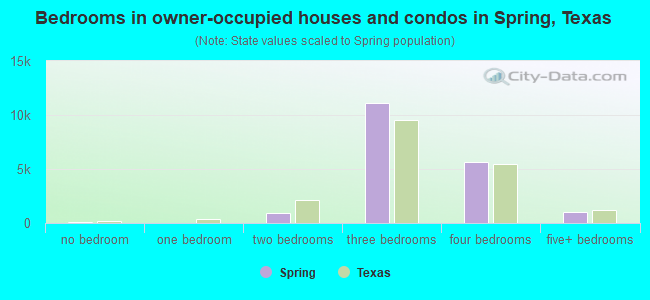
Median number of bedrooms in owner occupied houses
Mean number of bedrooms in owner occupied houses
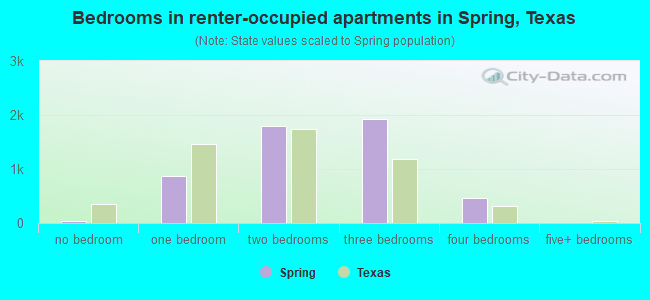
Median number of bedrooms in renter occupied houses
Mean number of bedrooms in renter occupied houses
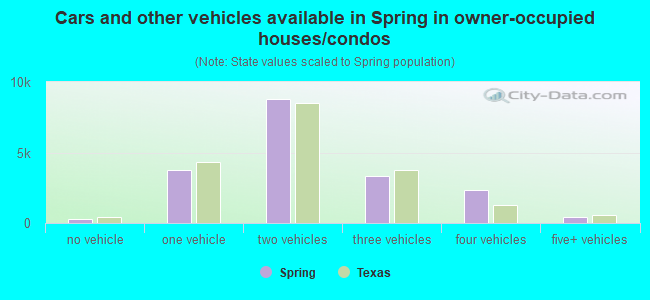
Median number of vehichles in owner occupied houses
Mean number of vehichles in owner occupied houses
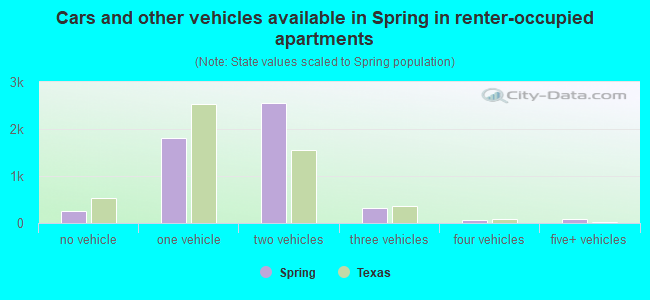
Median number of vehichles in renter occupied houses
Mean number of vehichles in renter occupied houses
Rooms in owner-occupied houses - 1 room (%)
Rooms in owner-occupied houses - 2 rooms (%)
Rooms in owner-occupied houses - 3 rooms (%)
Rooms in owner-occupied houses - 4 rooms (%)
Rooms in owner-occupied houses - 5 rooms (%)
Rooms in owner-occupied houses - 6 rooms (%)
Rooms in owner-occupied houses - 7 rooms (%)
Rooms in owner-occupied houses - 8 rooms (%)
Rooms in owner-occupied houses - 9+ rooms (%)
Rooms in renter-occupied houses - 1 room (%)
Rooms in renter-occupied houses - 2 rooms (%)
Rooms in renter-occupied houses - 3 rooms (%)
Rooms in renter-occupied houses - 4 rooms (%)
Rooms in renter-occupied houses - 5 rooms (%)
Rooms in renter-occupied houses - 6 rooms (%)
Rooms in renter-occupied houses - 7 rooms (%)
Rooms in renter-occupied houses - 8 rooms (%)
Rooms in renter-occupied houses - 9+ rooms (%)
Bedrooms in owner-occupied houses - no bedrooms (%)
Bedrooms in owner-occupied houses - 1 bedroom (%)
Bedrooms in owner-occupied houses - 2 bedrooms (%)
Bedrooms in owner-occupied houses - 3 bedrooms (%)
Bedrooms in owner-occupied houses - 4 bedrooms (%)
Bedrooms in owner-occupied houses - 5+ bedrooms (%)
Bedrooms in renter-occupied houses - no bedrooms (%)
Bedrooms in renter-occupied houses - 1 bedroom (%)
Bedrooms in renter-occupied houses - 2 bedrooms (%)
Bedrooms in renter-occupied houses - 3 bedrooms (%)
Bedrooms in renter-occupied houses - 4 bedrooms (%)
Bedrooms in renter-occupied houses - 5+ bedrooms (%)
Vehicles available in owner-occupied houses - no vehicle available (%)
Vehicles available in owner-occupied houses - 1 vehicle available(%)
Vehicles available in owner-occupied houses - 2 Vehicles available (%)
Vehicles available in owner-occupied houses - 3 Vehicles available (%)
Vehicles available in owner-occupied houses - 4 Vehicles available (%)
Vehicles available in owner-occupied houses - 5+ Vehicles available (%)
Vehicles available in renter-occupied houses - no vehicle available (%)
Vehicles available in renter-occupied houses - 1 vehicle available (%)
Vehicles available in renter-occupied houses - 2 Vehicles available (%)
Vehicles available in renter-occupied houses - 3 Vehicles available (%)
Vehicles available in renter-occupied houses - 4 Vehicles available (%)
Vehicles available in renter-occupied houses - 5+ Vehicles available (%)
Housing units in structures - 1, detached (%)
Housing units in structures - 1, attached (%)
Housing units in structures - 2 (%)
Housing units in structures - 3 or 4 (%)
Housing units in structures - 5 to 9 (%)
Housing units in structures - 10 to 19 (%)
Housing units in structures - 20 to 49 (%)
Housing units in structures - 50 or more (%)
Housing units in structures - Mobile home (%)
Housing units in structures - Boat, RV, van, etc. (%)
Housing units in structures - Owners - 1, detached (%)
Housing units in structures - Owners - 1, attached (%)
Housing units in structures - Owners - 2 (%)
Housing units in structures - Owners - 3 or 4 (%)
Housing units in structures - Owners - 5 to 9 (%)
Housing units in structures - Owners - 10 to 19 (%)
Housing units in structures - Owners - 20 to 49 (%)
Housing units in structures - Owners - 50 or more (%)
Housing units in structures - Owners - Mobile home (%)
Housing units in structures - Owners - Boat, RV, van, etc. (%)
Housing units in structures - Renters - 1, detached (%)
Housing units in structures - Renters - 1, attached (%)
Housing units in structures - Renters - 2 (%)
Housing units in structures - Renters - 3 or 4 (%)
Housing units in structures - Renters - 5 to 9 (%)
Housing units in structures - Renters - 10 to 19 (%)
Housing units in structures - Renters - 20 to 49 (%)
Housing units in structures - Renters - 50 or more (%)
Housing units in structures - Renters - Mobile home (%)
Housing units in structures - Renters - Boat, RV, van, etc. (%)
House/condo owner moved in on average (years ago)
Renter moved in on average (years ago)
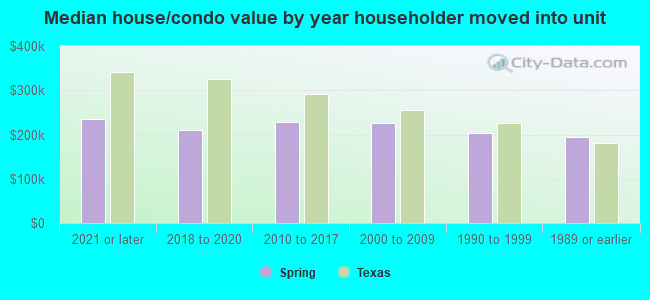
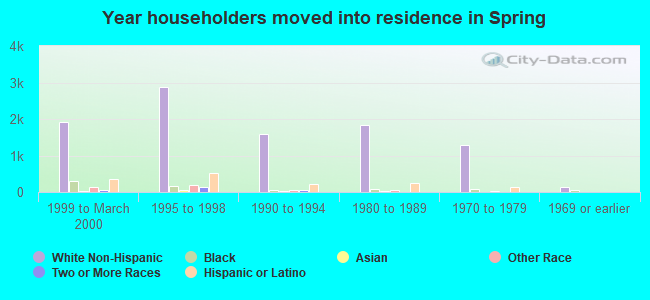
Year householder moved into unit - Moved in 1999 to March 2000 (%)
Year householder moved into unit - Moved in 1999 to March 2000 (%) - White
Year householder moved into unit - Moved in 1999 to March 2000 (%) - Black or African American
Year householder moved into unit - Moved in 1999 to March 2000 (%) - Asian
Year householder moved into unit - Moved in 1999 to March 2000 (%) - Hispanic or Latino
Year householder moved into unit - Moved in 1999 to March 2000 (%) - American Indian and Alaska Native
Year householder moved into unit - Moved in 1999 to March 2000 (%) - Multirace
Year householder moved into unit - Moved in 1999 to March 2000 (%) - Other Race
Year householder moved into unit - Moved in 1995 to 1998 (%)
Year householder moved into unit - Moved in 1995 to 1998 (%) - White
Year householder moved into unit - Moved in 1995 to 1998 (%) - Black or African American
Year householder moved into unit - Moved in 1995 to 1998 (%) - Asian
Year householder moved into unit - Moved in 1995 to 1998 (%) - Hispanic or Latino
Year householder moved into unit - Moved in 1995 to 1998 (%) - American Indian and Alaska Native
Year householder moved into unit - Moved in 1995 to 1998 (%) - Multirace
Year householder moved into unit - Moved in 1995 to 1998 (%) - Other Race
Year householder moved into unit - Moved in 1990 to 1994 (%)
Year householder moved into unit - Moved in 1990 to 1994 (%) - White
Year householder moved into unit - Moved in 1990 to 1994 (%) - Black or African American
Year householder moved into unit - Moved in 1990 to 1994 (%) - Asian
Year householder moved into unit - Moved in 1990 to 1994 (%) - Hispanic or Latino
Year householder moved into unit - Moved in 1990 to 1994 (%) - American Indian and Alaska Native
Year householder moved into unit - Moved in 1990 to 1994 (%) - Multirace
Year householder moved into unit - Moved in 1990 to 1994 (%) - Other Race
Year householder moved into unit - Moved in 1980 to 1989 (%)
Year householder moved into unit - Moved in 1980 to 1989 (%) - White
Year householder moved into unit - Moved in 1980 to 1989 (%) - Black or African American
Year householder moved into unit - Moved in 1980 to 1989 (%) - Asian
Year householder moved into unit - Moved in 1980 to 1989 (%) - Hispanic or Latino
Year householder moved into unit - Moved in 1980 to 1989 (%) - American Indian and Alaska Native
Year householder moved into unit - Moved in 1980 to 1989 (%) - Multirace
Year householder moved into unit - Moved in 1980 to 1989 (%) - Other Race
Year householder moved into unit - Moved in 1970 to 1979 (%)
Year householder moved into unit - Moved in 1970 to 1979 (%) - White
Year householder moved into unit - Moved in 1970 to 1979 (%) - Black or African American
Year householder moved into unit - Moved in 1970 to 1979 (%) - Asian
Year householder moved into unit - Moved in 1970 to 1979 (%) - Hispanic or Latino
Year householder moved into unit - Moved in 1970 to 1979 (%) - American Indian and Alaska Native
Year householder moved into unit - Moved in 1970 to 1979 (%) - Multirace
Year householder moved into unit - Moved in 1970 to 1979 (%) - Other Race
Year householder moved into unit - Moved in 1969 or earlier (%)
Year householder moved into unit - Moved in 1969 or earlier (%) - White
Year householder moved into unit - Moved in 1969 or earlier (%) - Black or African American
Year householder moved into unit - Moved in 1969 or earlier (%) - Asian
Year householder moved into unit - Moved in 1969 or earlier (%) - Hispanic or Latino
Year householder moved into unit - Moved in 1969 or earlier (%) - American Indian and Alaska Native
Year householder moved into unit - Moved in 1969 or earlier (%) - Multirace
Year householder moved into unit - Moved in 1969 or earlier (%) - Other Race
Housing units lacking complete plumbing facilities (%)
Housing units lacking complete kitchen facilities (%)
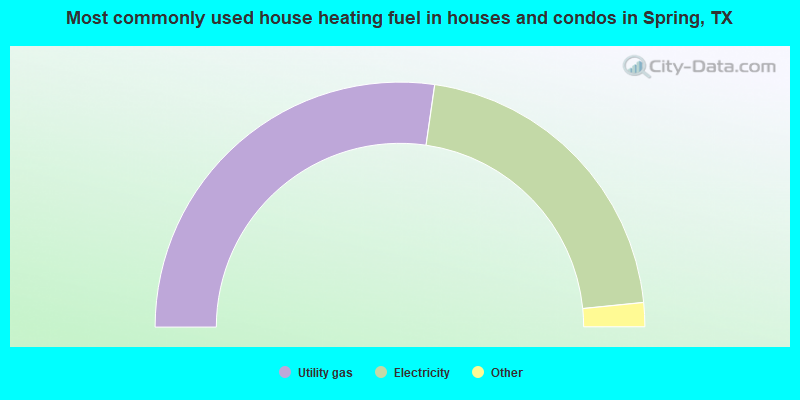
House heating fuel used in houses and condos - Utility gas (%)
House heating fuel used in houses and condos - Bottled, tank, or LP gas (%)
House heating fuel used in houses and condos - Electricity (%)
House heating fuel used in houses and condos - Fuel oil, kerosene, etc. (%)
House heating fuel used in houses and condos - Coal or coke (%)
House heating fuel used in houses and condos - Wood (%)
House heating fuel used in houses and condos - Solar energy (%)
House heating fuel used in houses and condos - Other fuel (%)
House heating fuel used in houses and condos - No fuel used (%)
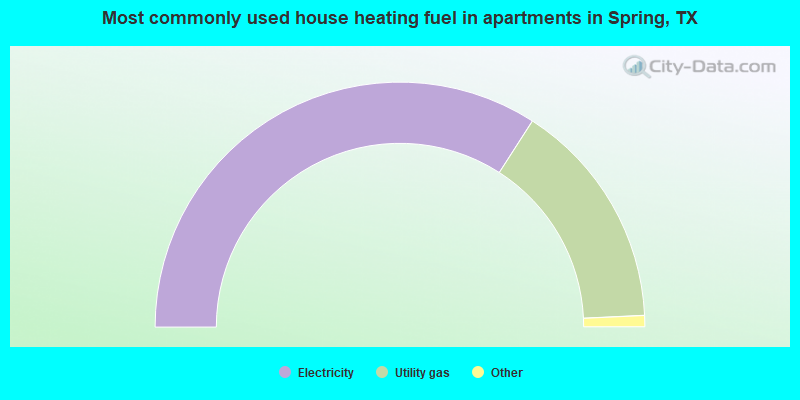
House heating fuel used in apartments - Utility gas (%)
House heating fuel used in apartments - Bottled, tank, or LP gas (%)
House heating fuel used in apartments - Electricity (%)
House heating fuel used in apartments - Fuel oil, kerosene, etc. (%)
House heating fuel used in apartments - Coal or coke (%)
House heating fuel used in apartments - Wood (%)
House heating fuel used in apartments - Solar energy (%)
House heating fuel used in apartments - Other fuel (%)
House heating fuel used in apartments - No fuel used (%)
Latest news about housing in Spring, TX collected exclusively by city-data.com from local newspapers, TV, and radio stations
Median year house/condo built: 2001Median year apartment built: 1989Household type by relationship:
Households: 73,085
Male householders: 14,313 (2,600 living alone ), Female householders: 9,658 (2,108 living alone )13,212 spouses (13,068 opposite-sex spouses ), 2,449 unmarried partners , (2,449 opposite-sex unmarried partners ), 25,502 children (22,737 natural , 835 adopted , 1,930 stepchildren ), 2,387 grandchildren , 864 brothers or sisters , 1,848 parents , 0 foster children , 2,137 other relatives , 650 non-relatives In group quarters: 65
Size of family households: 6,849 2-persons , 3,187 3-persons , 2,734 4-persons , 2,734 5-persons , 1,717 6-persons , 487 7-or-more-persons .
Size of nonfamily households: 4,708 1-person , 1,555 2-persons .
13,779 married couples with children. single-parent households (651 men , 2,276 women ).
63.5% of residents of Spring speak English at home. of residents speak Spanish at home (67% speak English very well , 19% speak English well , 9% speak English not well , 5% don't speak English at all ).of residents speak other Indo-European language at home (86% speak English very well , 5% speak English well , 5% speak English not well , 3% don't speak English at all ).of residents speak Asian or Pacific Island language at home (66% speak English very well , 20% speak English well , 14% speak English not well ).of residents speak other language at home (83% speak English very well , 17% speak English well ).
Foreign born population: 15,802 (21.6%)of them are naturalized citizens )
Median number of rooms in houses and condos:
Median number of rooms in apartments
Owner-occupied Renter-occupied
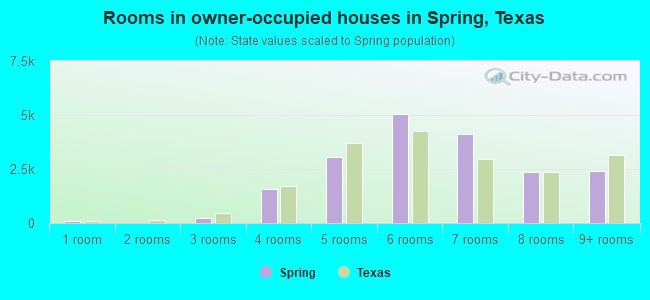
Rooms in owner-occupied houses in Spring, Texas
107 1 room 0 2 rooms 227 3 rooms 1,557 4 rooms 3,059 5 rooms 5,033 6 rooms 4,109 7 rooms 2,345 8 rooms 2,428 9+ rooms
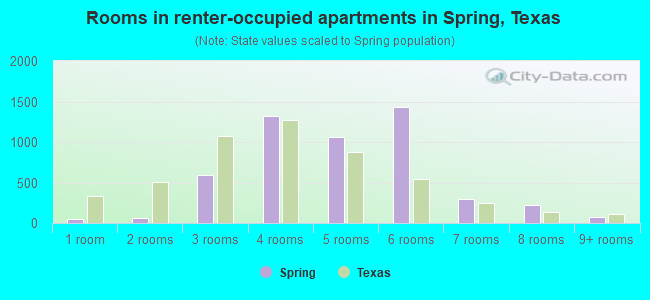
Rooms in renter-occupied apartments in Spring, Texas
46 1 room 62 2 rooms 596 3 rooms 1,315 4 rooms 1,057 5 rooms 1,436 6 rooms 297 7 rooms 228 8 rooms 69 9+ rooms
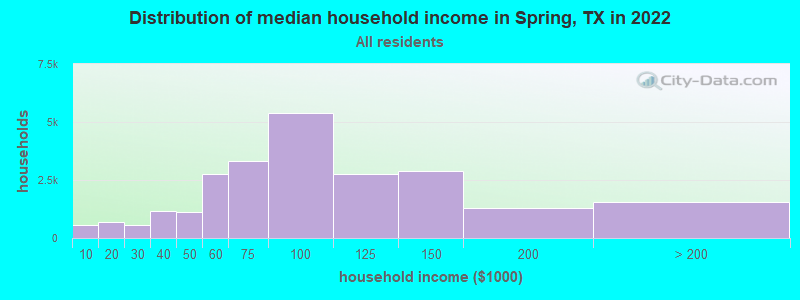
Spring, TX household income distribution 565 Less than $10,000670 $10,000 to $19,999543 $20,000 to $29,9991,180 $30,000 to $39,9991,100 $40,000 to $49,9992,743 $50,000 to $59,9993,326 $60,000 to $74,9995,399 $75,000 to $99,9992,740 $100,000 to $124,9992,888 $125,000 to $149,9991,284 $150,000 to $199,9991,533 $200,000 or more
Home value of owner - occupied houses in 2022 in Spring, TX 118 Less than $10,00012 $15,000 to $19,99924 $20,000 to $24,99938 $30,000 to $34,9999 $40,000 to $49,99959 $50,000 to $59,99922 $70,000 to $79,99956 $80,000 to $89,99988 $90,000 to $99,999571 $100,000 to $124,999906 $125,000 to $149,9992,136 $150,000 to $174,9992,400 $175,000 to $199,9993,486 $200,000 to $249,9992,818 $250,000 to $299,9991,776 $300,000 to $399,999454 $400,000 to $499,99984 $500,000 to $749,99917 $1,000,000 to $1,499,99929 $1,500,000 to $1,999,9994 $2,000,000 or moreRent paid by renters in 2022 in Spring, TX 20 $550 to $59927 $700 to $749128 $750 to $799156 $800 to $899203 $900 to $9991,427 $1,000 to $1,2491,870 $1,250 to $1,4991,811 $1,500 to $1,99984 $2,000 to $2,499113 $2,500 to $2,999198 No cash rent
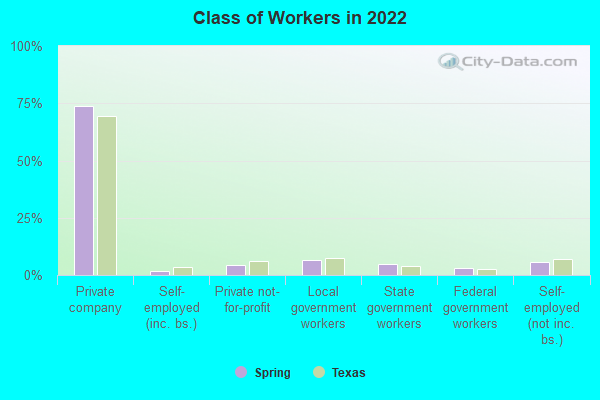
Percentage of workers working in this county: 87.2%Number of people working at home: 3,622 (10.9% of all workers )
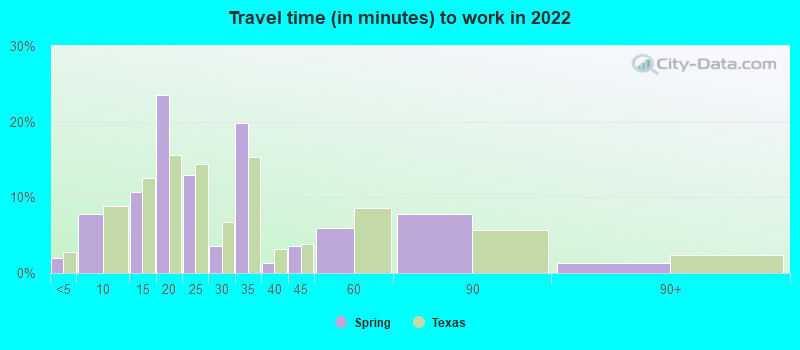
Travel time to work (commute)
Less than 5 minutes: 3185 to 9 minutes: 1,39310 to 14 minutes: 2,14715 to 19 minutes: 2,14320 to 24 minutes: 2,36225 to 29 minutes: 3,09930 to 34 minutes: 7,57835 to 39 minutes: 1,57740 to 44 minutes: 2,47545 to 59 minutes: 4,35360 to 89 minutes: 4,94490 or more minutes: 1,236
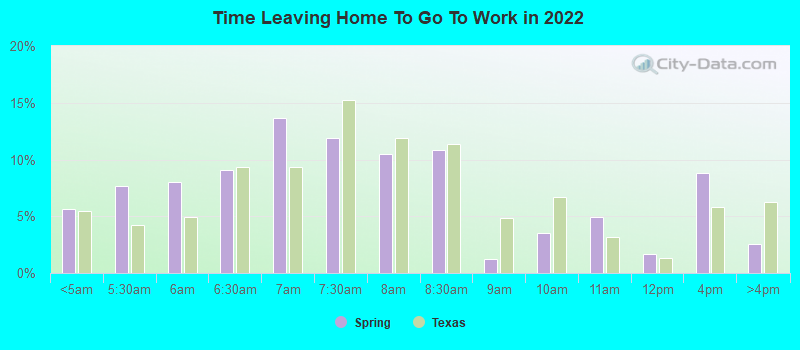
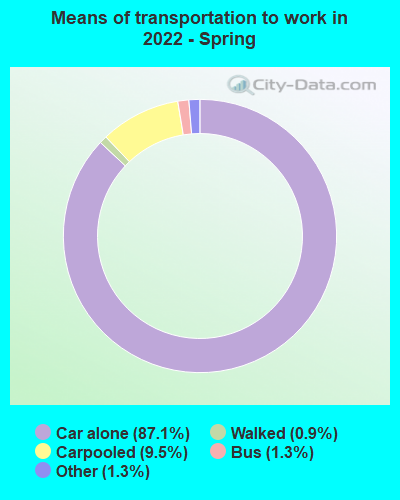
Means of transportation to work:
Drove a car alone: 16,290 (72.4%)Carpooled: 2,079 (9.2%)Bus : 209 (0.9%)Taxi: 328 (1.5%)Walked: 157 (0.7%)Worked at home: 3,622 (16.1%)
Unemployment by race in 2022
Unemployment rate for White non-Hispanic residents 5.9% FemalesUnemployment rate for Black residents 6.6% Males3.2% FemalesUnemployment rate for Asian residents 4.0% FemalesUnemployment rate for other race residents 12.4% FemalesUnemployment rate for two or more race residents 3.6% Males1.3% FemalesUnemployment rate for Hispanic or Latino residents 2.2% Males5.1% Females
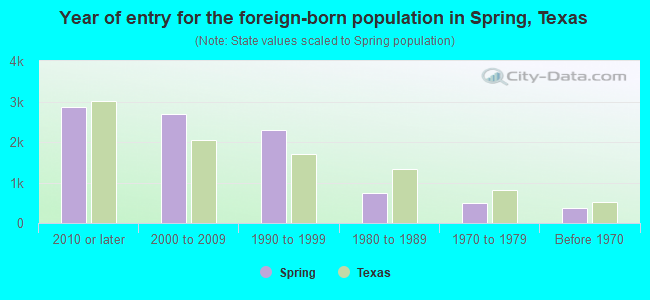
Year of entry for the foreign-born population in Spring, Texas
2,871 2010 or later 2,681 2000 to 2009 2,286 1990 to 1999 744 1980 to 1989 484 1970 to 1979 374 Before 1970
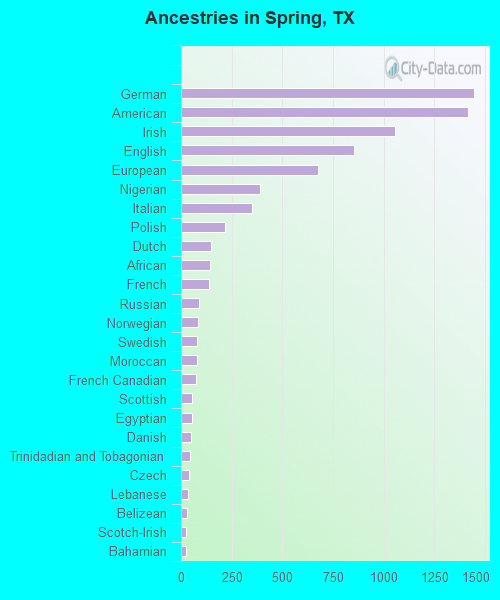
First ancestries reported:
German: 1,448 (4.3%)
American: 1,417 (4.2%)
Irish: 1,056 (3.1%)
English: 855 (2.5%)
European: 677 (2.0%)
Nigerian: 391 (1.2%)
Italian: 350 (1.0%)
Polish: 217 (0.6%)
Dutch: 148 (0.4%)
African: 145 (0.4%)
French: 138 (0.4%)
Russian: 87 (0.3%)
Norwegian: 83 (0.2%)
Swedish: 78 (0.2%)
Moroccan: 77 (0.2%)
French Canadian: 72 (0.2%)
Scottish: 54 (0.2%)
Egyptian: 53 (0.2%)
Danish: 48 (0.1%)
Trinidadian and Tobagonian: 46 (0.1%)
Czech: 39 (0.1%)
Lebanese: 34 (0.1%)
Belizean: 30 (0.09%)
Scotch-Irish: 25 (0.07%)
Bahamian: 24 (0.07%)
Palestinian: 23 (0.07%)
Romanian: 22 (0.06%)
British: 22 (0.06%)
Jamaican: 21 (0.06%)
Greek: 19 (0.06%)
Slavic: 18 (0.05%)
Iranian: 17 (0.05%)
Assyrian: 16 (0.05%)
Finnish: 12 (0.04%)
Northern European: 11 (0.03%)
Portuguese: 9 (0.03%)
Brazilian: 9 (0.03%)
Lithuanian: 2 (0.01%) Most common places of birth for foreign-born residents (%): Mexico Spring:
37.1% (3,908)Texas:
48.4% (2,411,723)
El Salvador Spring:
17.1% (1,799)Texas:
4.5% (224,455)
Cuba Spring:
8.2% (867)Texas:
1.3% (62,978)
Guatemala Spring:
6.2% (653)Texas:
1.8% (87,382)
Vietnam Spring:
4.4% (466)Texas:
3.7% (184,770)
Nigeria Spring:
3.9% (413)Texas:
1.9% (96,110)
Honduras Spring:
3.7% (393)Texas:
3.0% (147,182)
Other Caribbean Spring:
2.5% (264)Texas:
0.1% (3,790)
Ecuador Spring:
1.9% (202)Texas:
0.2% (12,456)
Philippines Spring:
1.5% (162)Texas:
2.1% (103,148)
Place of birth for U.S.-born residents:
This state: 37,771Other state: 17,155Northeast: 1,475Midwest: 6,122South: 4,238West: 5,320 88.8% of Spring residents lived in the same house 1 years ago.
Out of people who lived in different houses, 41.5% lived in this county.
Out of people who lived in different counties, 40.2% lived in Texas.
Spring:
88.8%State average:
85.7%
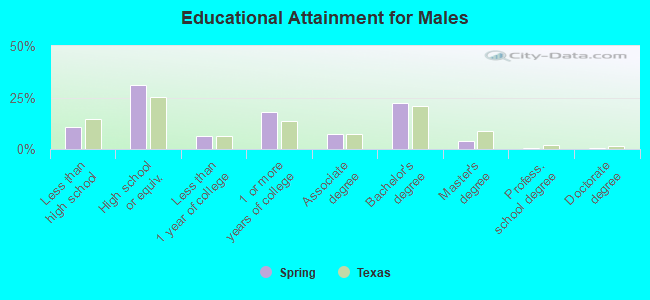
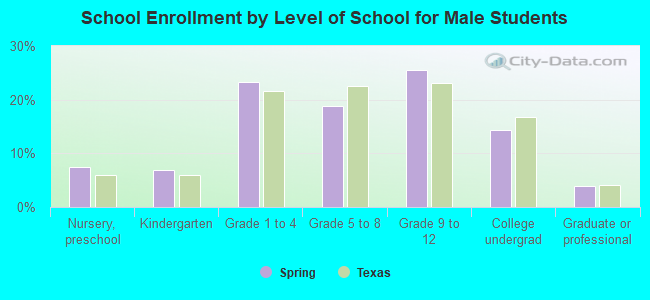
Education attainment for males 25 years and older:
No schooling: 479Nursery to 4th grade: 125th and 6th grade: 1967th and 8th grade: 1679th grade: 10810th grade: 26211th grade: 40512th grade, no diploma: 555High school graduate (or equivalency): 6,433Less than 1 year of college: 1,256Some college more than 1 year, no degree: 3,665Associate degree: 1,481Bachelor's degree: 4,555Master's degree: 777Professional school degree: 104Doctorate degree: 107
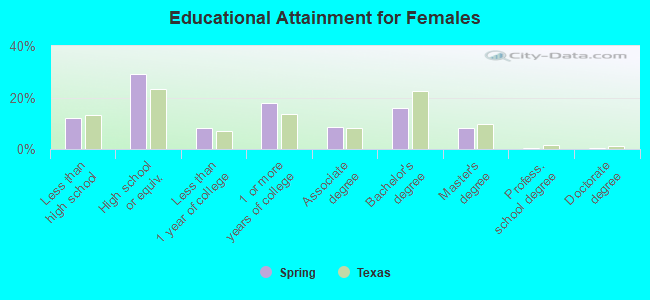
Education attainment for females 25 years and older:
No schooling: 431Nursery to 4th grade: 1615th and 6th grade: 3707th and 8th grade: 1179th grade: 58910th grade: 29911th grade: 28312th grade, no diploma: 320High school graduate (or equivalency): 6,226Less than 1 year of college: 1,697Some college more than 1 year, no degree: 3,776Associate degree: 1,786Bachelor's degree: 3,373Master's degree: 1,715Professional school degree: 64Doctorate degree: 81
Housing units in structures:
One, detached: 19,573One, attached: 620Two: 3233 or 4: 4825 to 9: 50210 to 19: 32720 to 49: 15150 or more: 802Mobile homes: 254Housing units lacking complete plumbing facilities in 2022: 0.7%Housing units lacking complete kitchen facilities in 2022: 0.6%House/condo owner moved in on average 7 years ago
Renter moved in on average 0 years ago
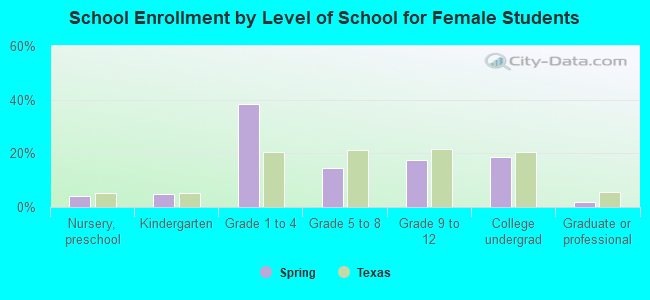
Private vs. public school enrollment:
Students in private schools in grades 1 to 8 (elementary and middle school): 403 Students in private schools in grades 9 to 12 (high school): 233 Students in private undergraduate colleges: 636