Springfield, GA (Georgia) Houses and Residents
| Springfield: | $193,294 |
| Georgia: | $297,400 |
Total population: 2,781 (Urban population: 1,607 (all inside urban clusters), Rural population: 100 (all nonfarm))
Houses: 1,265 (1,192 occupied: 808 owner occupied, 371 renter occupied)
| % of renters here: | 31% |
| State: | 34% |
Housing density: 593 houses/condos per square mile
Median price asked for vacant for-sale houses and condos in 2022 in this county: $128,811.
Median contract rent in 2022: $691 (lower quartile is $563, upper quartile is $895)
Median rent asked for vacant for-rent units in 2022: $690
Median gross rent in Springfield, GA in 2022: $956
Housing units in Springfield with a mortgage: 581 (21 second mortgage, 0 home equity loan, 7 both second mortgage and home equity loan)
Houses without a mortgage: 0
Median household income for houses/condos with a mortgage: $68,534
Median household income for apartments without a mortgage: $59,389
Median monthly housing costs: $1,030
Compare current foreclosures in Springfield, GA:
| Photo | Address | Area | Beds / Baths | Price | Details |
|---|---|---|---|---|---|

|
#1
Ash Street Ext
Springfield, GA 31329
|
1,615 sq. feet
|
1 baths - beds |
show details | |

|
#2
Willowbrook Ln
Springfield, GA 31329
|
1,053 sq. feet
|
1 baths - beds |
show details | |

|
#3
Springfield Egypt Rd
Springfield, GA 31329
|
1,088 sq. feet
|
1 baths - beds |
show details | |

|
#4
W 3rd St
Springfield, GA 31329
|
1,385 sq. feet
|
1 baths - beds |
show details | |

|
#5
S Railroad Ave
Springfield, GA 31329
|
1,152 sq. feet
|
1 baths - beds |
show details | |

|
#6
Laurel Point Dr
Springfield, GA 31329
|
1,087 sq. feet
|
1 baths - beds |
show details | |

|
#7
Hawk Hammock Dr
Springfield, GA 31329
|
1,728 sq. feet
|
1 baths - beds |
show details | |

|
#8
Blackwater Way
Springfield, GA 31329
|
1,261 sq. feet
|
1 baths - beds |
show details | |

|
#9
Cedar Dr
Springfield, GA 31329
|
1,786 sq. feet
|
1 baths - beds |
show details | |

|
#10
Berryville Rd
Springfield, GA 31329
|
2,422 sq. feet
|
1 baths - beds |
show details |
| Photo | Address | Area | Beds / Baths | Price | Details |
|---|---|---|---|---|---|

|
#11
Mccall Rd
Springfield, GA 31329
|
1,125 sq. feet
|
1 baths - beds |
show details | |

|
#12
Ash Street Ext
Springfield, GA 31329
|
1,150 sq. feet
|
1 baths - beds |
show details | |

|
#13
Stillwood Dr
Springfield, GA 31329
|
1,200 sq. feet
|
1 baths - beds |
show details | |

|
#14
S Ash St
Springfield, GA 31329
|
- sq. feet
|
- baths - beds |
show details | |

|
#15
Sweet Gum Cir
Springfield, GA 31329
|
- sq. feet
|
- baths - beds |
show details | |

|
#16
Mockingbird Dr
Springfield, GA 31329
|
- sq. feet
|
- baths - beds |
show details | |

|
#17
Cherry Oaks Ct
Springfield, GA 31329
|
- sq. feet
|
- baths - beds |
show details | |

|
#18
Western Red Cedar Dr
Springfield, GA 31329
|
- sq. feet
|
- baths - beds |
show details | |

|
#19
Nixon Chapel Rd
Springfield, GA 31329
|
- sq. feet
|
- baths - beds |
show details | |

|
#20
Blackwater Way
Springfield, GA 31329
|
- sq. feet
|
- baths - beds |
show details |
| Photo | Address | Area | Beds / Baths | Price | Details |
|---|---|---|---|---|---|

|
#21
Black Pine Dr
Springfield, GA 31329
|
- sq. feet
|
- baths - beds |
show details | |

|
#22
Cherry Oaks Ct
Springfield, GA 31329
|
- sq. feet
|
- baths - beds |
show details | |

|
#23
Cherry Oaks Ct
Springfield, GA 31329
|
- sq. feet
|
- baths - beds |
show details | |

|
#24
Mccall Rd # 706
Springfield, GA 31329
|
- sq. feet
|
- baths - beds |
show details | |

|
#25
Stoneycreek Ct
Springfield, GA 31329
|
- sq. feet
|
- baths - beds |
show details | |

|
#26
Cherry Oaks Ct
Springfield, GA 31329
|
- sq. feet
|
- baths - beds |
show details | |

|
#27
Ash Street Ext Apt A2
Springfield, GA 31329
|
- sq. feet
|
- baths - beds |
show details | |

|
#28
Gadwall Ct
Springfield, GA 31329
|
- sq. feet
|
- baths - beds |
show details | |

|
#29
Knotty Pine Cir
Springfield, GA 31329
|
- sq. feet
|
- baths - beds |
show details | |

|
#30
Nixon Chapel Rd
Springfield, GA 31329
|
- sq. feet
|
- baths - beds |
show details |
| Photo | Address | Area | Beds / Baths | Price | Details |
|---|---|---|---|---|---|

|
#31
Palmer St
Springfield, GA 31329
|
- sq. feet
|
- baths - beds |
show details | |

|
#32
Western Red Cedar Dr
Springfield, GA 31329
|
- sq. feet
|
- baths - beds |
show details | |

|
#33
Deer Rd
Springfield, GA 31329
|
- sq. feet
|
- baths - beds |
show details | |

|
#34
Mccall Rd
Springfield, GA 31329
|
- sq. feet
|
- baths - beds |
show details | |

|
#35
New Stillwell Rd
Springfield, GA 31329
|
- sq. feet
|
- baths - beds |
show details | |

|
#36
Silver Hill Church Rd
Springfield, GA 31329
|
- sq. feet
|
- baths - beds |
show details | |

|
Check over 1 million property listings on Foreclosure.com!
|
browse all offers | |||

Latest news about housing in Springfield, GA collected exclusively by city-data.com from local newspapers, TV, and radio stations

 | Savannah development news (634 replies) |
| Ellabell vs Springfield- Moving to the area in the next 6-8 months (13 replies) |
| Is migration to exurbs real (120 replies) |
| Is ATL and the metro changing to the point where it will feel unreconizable in a decade (40 replies) |
| Effingham to get $22M luxury apartment complex (4 replies) |
| Springfield creates downtown development authority (0 replies) |

Median year apartment built: 1985
Household type by relationship:
Households: 2,910- Male householders: 468 (128 living alone), Female householders: 723 (335 living alone)
375 spouses (375 opposite-sex spouses), 24 unmarried partners, (19 opposite-sex unmarried partners), 746 children (715 natural, 3 adopted, 27 stepchildren), 75 grandchildren, 32 brothers or sisters, 8 parents, 10 foster children, 76 other relatives, 33 non-relatives
- In group quarters: 336
Size of family households: 357 2-persons, 159 3-persons, 103 4-persons, 56 5-persons, 13 6-persons.
Size of nonfamily households: 361 1-person, 25 2-persons.
299 married couples with children.
259 single-parent households (62 men, 197 women).
96.9% of residents of Springfield speak English at home.
1.9% of residents speak Spanish at home (100% speak English very well).
0.3% of residents speak other Indo-European language at home (100% speak English very well).
0.3% of residents speak other language at home (100% speak English very well).
Foreign born population: 7 (0.2%)
(128.6% of them are naturalized citizens)
| Here: | 6.9 |
| State: | 6.8 |
| Here: | 4.5 |
| State: | 4.6 |

- Bedrooms in owner-occupied houses and condos in Springfield, Georgia
- 0no bedroom
- 01 bedroom
- 492 bedrooms
- 5353 bedrooms
- 1534 bedrooms
- 715+ bedrooms

- Bedrooms in renter-occupied apartments in Springfield, Georgia
- 0no bedroom
- 251 bedroom
- 2412 bedrooms
- 933 bedrooms
- 134 bedrooms
- 05+ bedrooms

- Cars and other vehicles available in Springfield in owner-occupied houses/condos
- 7no vehicle
- 2311 vehicle
- 4322 vehicles
- 933 vehicles
- 424 vehicles
- 45+ vehicles

- Cars and other vehicles available in Springfield in renter-occupied apartments
- 25no vehicle
- 2241 vehicle
- 902 vehicles
- 283 vehicles
- 44 vehicles
- 05+ vehicles

- Rooms in owner-occupied houses in Springfield, Georgia
- 01 room
- 02 rooms
- 03 rooms
- 454 rooms
- 1295 rooms
- 1516 rooms
- 2227 rooms
- 1558 rooms
- 1079+ rooms

- Rooms in renter-occupied apartments in Springfield, Georgia
- 01 room
- 02 rooms
- 73 rooms
- 1474 rooms
- 1675 rooms
- 106 rooms
- 177 rooms
- 248 rooms
- 09+ rooms


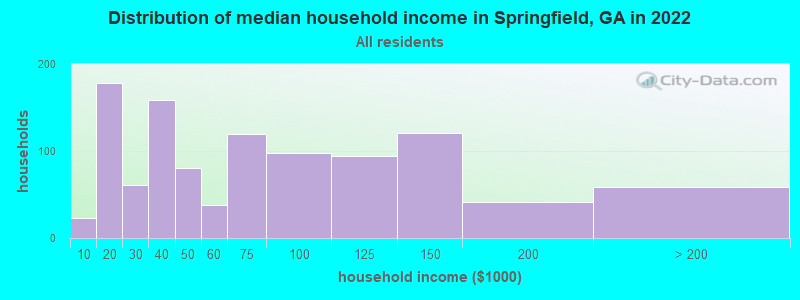
Springfield, GA household income distribution

- 23Less than $10,000
- 178$10,000 to $19,999
- 61$20,000 to $29,999
- 159$30,000 to $39,999
- 81$40,000 to $49,999
- 38$50,000 to $59,999
- 119$60,000 to $74,999
- 98$75,000 to $99,999
- 94$100,000 to $124,999
- 121$125,000 to $149,999
- 41$150,000 to $199,999
- 59$200,000 or more
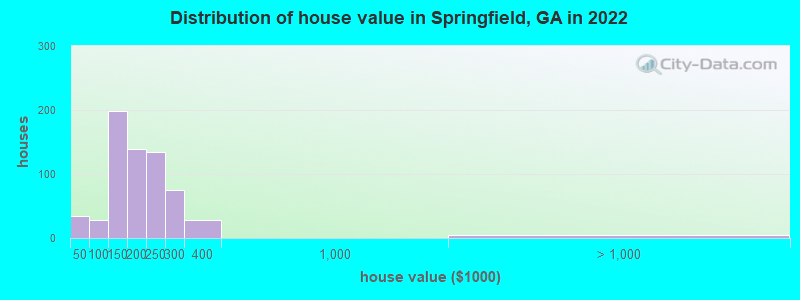
Home value of owner - occupied houses in 2022 in Springfield, GA
-
- 13$10,000 to $14,999
- 4$15,000 to $19,999
- 15$25,000 to $29,999
- 6$60,000 to $69,999
- 8$70,000 to $79,999
- 4$80,000 to $89,999
- 8$90,000 to $99,999
- 130$100,000 to $124,999
- 67$125,000 to $149,999
- 98$150,000 to $174,999
- 40$175,000 to $199,999
- 135$200,000 to $249,999
- 75$250,000 to $299,999
- 27$300,000 to $399,999
- 4$1,000,000 to $1,499,999
Rent paid by renters in 2022 in Springfield, GA
-
- 29$400 to $449
- 8$550 to $599
- 72$700 to $749
- 43$750 to $799
- 68$800 to $899
- 48$900 to $999
- 13$1,000 to $1,249
- 49No cash rent


Percentage of workers working in this county: 50.1%
Number of people working at home: 38 (2.6% of all workers)
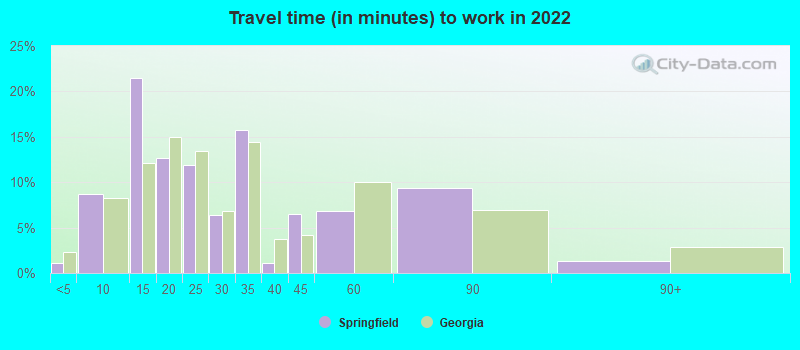
Travel time to work (commute)
- Less than 5 minutes: 19
- 5 to 9 minutes: 108
- 10 to 14 minutes: 95
- 15 to 19 minutes: 213
- 20 to 24 minutes: 72
- 25 to 29 minutes: 132
- 30 to 34 minutes: 539
- 35 to 39 minutes: 0
- 40 to 44 minutes: 38
- 45 to 59 minutes: 186
- 60 to 89 minutes: 80
- 90 or more minutes: 32
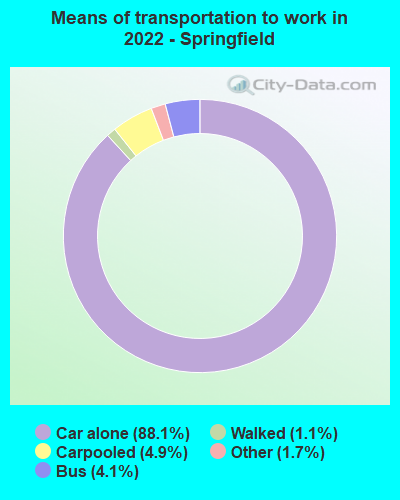
Means of transportation to work:
- Drove a car alone: 1,205 (82.2%)
- Carpooled: 70 (4.8%)
- Bus: 44 (3.0%)
- Taxi: 25 (1.7%)
- Walked: 15 (1.0%)
- Worked at home: 38 (2.6%)

- Unemployment by race in 2022
- Unemployment rate for White non-Hispanic residents
- 2.3%Females

- Year of entry for the foreign-born population in Springfield, Georgia
- 02010 or later
- 02000 to 2009
- 01990 to 1999
- 51980 to 1989
- 31970 to 1979
- 2Before 1970

First ancestries reported:
- American: 486 (34.7%)
- Irish: 98 (7.0%)
- English: 49 (3.5%)
- German: 43 (3.1%)
- Scotch-Irish: 22 (1.6%)
- Finnish: 18 (1.3%)
- European: 16 (1.1%)
- Norwegian: 8 (0.6%)
- Scottish: 7 (0.5%)
- Austrian: 3 (0.2%)
Most common places of birth for foreign-born residents (%):
| Springfield: | 100.0% (6) |
| Georgia: | 4.6% (51,270) |
Place of birth for U.S.-born residents:
- This state: 1,741
- Other state: 1,059
- Northeast: 195
- Midwest: 156
- South: 654
- West: 55
90.8% of Springfield residents lived in the same house 1 years ago.
Out of people who lived in different houses, 27.2% lived in this county.
Out of people who lived in different counties, 100.0% lived in Georgia.
| Springfield: | 90.8% |
| State average: | 86.6% |
Education attainment for males 25 years and older:
- No schooling: 24
- Nursery to 4th grade: 0
- 5th and 6th grade: 7
- 7th and 8th grade: 4
- 9th grade: 45
- 10th grade: 8
- 11th grade: 57
- 12th grade, no diploma: 13
- High school graduate (or equivalency): 301
- Less than 1 year of college: 89
- Some college more than 1 year, no degree: 79
- Associate degree: 118
- Bachelor's degree: 118
- Master's degree: 47
- Professional school degree: 2
- Doctorate degree: 0

Education attainment for females 25 years and older:
- No schooling: 0
- Nursery to 4th grade: 0
- 5th and 6th grade: 0
- 7th and 8th grade: 6
- 9th grade: 2
- 10th grade: 14
- 11th grade: 4
- 12th grade, no diploma: 17
- High school graduate (or equivalency): 330
- Less than 1 year of college: 64
- Some college more than 1 year, no degree: 120
- Associate degree: 147
- Bachelor's degree: 127
- Master's degree: 127
- Professional school degree: 0
- Doctorate degree: 0


Housing units in structures:
- One, detached: 1,000
- One, attached: 27
- Two: 117
- 3 or 4: 24
- 5 to 9: 7
- 10 to 19: 9
- 20 to 49: 23
- Mobile homes: 56
House/condo owner moved in on average 6 years ago
Renter moved in on average 4 years ago

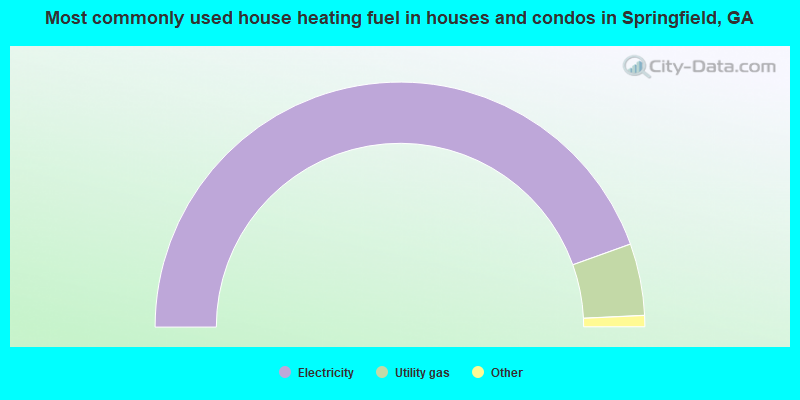
- 89.2%Electricity
- 9.5%Utility gas
- 0.8%No fuel used
- 0.5%Other fuel
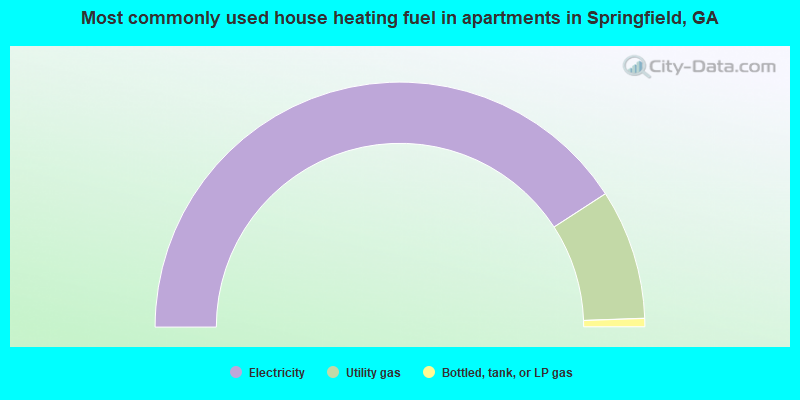
- 81.7%Electricity
- 17.2%Utility gas
- 1.1%Bottled, tank, or LP gas
Private vs. public school enrollment:
| Here: | 12.9% |
| Georgia: | 12.1% |
| Here: | 0.0% |
| Georgia: | 10.8% |
| Here: | 0.0% |
| Georgia: | 17.1% |


