Springfield, OH (Ohio) Houses and Residents
Estimated median house or condo value in 2022: $114,642 (it was $69,300 in 2000 )
Springfield:
$114,642Ohio:
$204,100
Lower value quartile - upper value quartile: $70,297 - $169,604Mean price in 2022: Detached houses: $135,766 Here:
$135,766State:
$254,366
Townhouses or other attached units: $170,462 Here:
$170,462State:
$225,733
In 2-unit structures: $183,637 Here:
$183,637State:
$144,384
In 3-to-4-unit structures: $304,461 Here:
$304,461State:
$203,002
In 5-or-more-unit structures: $135,477 Here:
$135,477State:
$211,593
Mobile homes: $16,564 Here:
$16,564State:
$62,719
Total population: 59,956 (All urban)
Houses: 27,829 (24,177 occupied: 12,545 owner occupied, 11,849 renter occupied )
% of renters here:
49%State:
33%
Housing density: 1,238 houses/condos per square mile
Median price asked for vacant for-sale houses and condos in 2022: $242,955.
Median contract rent in 2022: $606 (lower quartile is $493, upper quartile is $782)
Median rent asked for vacant for-rent units in 2022: $835
Median gross rent in Springfield, OH in 2022: $821
Housing units in Springfield with a mortgage: 7,041 (622 second mortgage, 36 home equity loan, 457 both second mortgage and home equity loan )Houses without a mortgage: 189
Median household income for houses/condos with a mortgage: $62,590
Median household income for apartments without a mortgage: $39,951
Median monthly housing costs: $740
Data:
Median house or condo value ($)
Median house or condo value ($ change since 2000)
Median house or condo value ($) - White
Median house or condo value ($) - Black or African American
Median house or condo value ($) - Asian
Median house or condo value ($) - Hispanic or Latino
Median house or condo value ($) - American Indian and Alaska Native
Median house or condo value ($) - Multirace
Median house or condo value ($) - Other Race
Median price asked for mobile homes ($)
Household density (households per square mile)
Mean house or condo value by units in structure - 1, detached ($)
Mean house or condo value by units in structure - 1, attached ($)
Mean house or condo value by units in structure - 2 ($)
Mean house or condo value by units in structure by units in structure - 3 or 4 ($)
Mean house or condo value by units in structure - 5 or more ($)
Mean house or condo value by units in structure - Boat, RV, van, etc. ($)
Mean house or condo value by units in structure - Mobile home ($)
Median contract rent ($)
Median contract rent - Lower quartile ($)
Median contract rent - Upper quartile ($)
Median gross rent ($)
Urban houses (%)
Rural houses (%)
Houses occupied (%)
Houses occupied (% change since 2000)
Houses owner occupied (%)
Houses owner occupied (% change since 2000)
Houses renter occupied (%)
Houses renter occupied (% change since 2000)
Vacant housing units - For rent (%)
Vacant housing units - For rent (% change since 2000)
Vacant housing units - For sale only (%)
Vacant housing units - For sale only (% change since 2000)
Vacant housing units - Rented or sold, not occupied (%)
Vacant housing units - Rented or sold, not occupied (% change since 2000)
Vacant housing units - For seasonal, recreational, or occasional use (%)
Vacant housing units - For seasonal, recreational, or occasional use (% change since 2000)
Vacant housing units - For migrant workers (%)
Vacant housing units - For migrant workers (% change since 2000)
Vacant housing units - Other vacant (%)
Vacant housing units - Other vacant (% change since 2000)
Median monthly housing costs ($)
Median household income for houses/condos with a mortgage ($)
Median household income for houses/condos without a mortgage ($)
Median household income ($)
Median household income ($) - White
Median household income ($) - Black or African American
Median household income ($) - Asian
Median household income ($) - Hispanic or Latino
Median household income ($) - American Indian and Alaska Native
Median household income ($) - Multirace
Median household income ($) - Other Race
Mortgage status - with mortgage (%)
Mortgage status - with second mortgage (%)
Mortgage status - with home equity loan (%)
Mortgage status - with both second mortgage and home equity loan (%)
Mortgage status - without a mortgage (%)
Median year house/condo built
Median year apartment built
Household type by relationship - Male householder living alone (%)
Household type by relationship - Male householder not living alone (%)
Household type by relationship - Female householder living alone (%)
Household type by relationship - Female householder not living alone (%)
Household type by relationship - Opposite-Sex spouse (%)
Household type by relationship - Same-Sex spouse (%)
Household type by relationship - Opposite-Sex unmarried partner (%)
Household type by relationship - Same-Sex unmarried partner (%)
Household type by relationship - In group quarters (%)
Size of family households - 2-person household (%)
Size of family households - 3-person household (%)
Size of family households - 4-person household (%)
Size of family households - 5-person household (%)
Size of family households - 6-person household (%)
Size of family households - 7-or-more-person household (%)
Size of nonfamily households - 1-person household (%)
Size of nonfamily households - 2-person household (%)
Size of nonfamily households - 3-person household (%)
Size of nonfamily households - 4-person household (%)
Size of nonfamily households - 5-person household (%)
Size of nonfamily households - 6-person household (%)
Size of nonfamily households - 7-or-moreperson household (%)
Year house built - Built 2010 or later (%)
Year house built - Built 2000 to 2009 (%)
Year house built - Built 1990 to 1999 (%)
Year house built - Built 1980 to 1989 (%)
Year house built - Built 1970 to 1979 (%)
Year house built - Built 1960 to 1969 (%)
Year house built - Built 1950 to 1959 (%)
Year house built - Built 1940 to 1949 (%)
Year house built - Built 1939 or earlier (%)
Median number of rooms in houses and condos
Median number of rooms in apartments
Median number of bedrooms in owner occupied houses
Mean number of bedrooms in owner occupied houses
Median number of bedrooms in renter occupied houses
Mean number of bedrooms in renter occupied houses
Median number of vehichles in owner occupied houses
Mean number of vehichles in owner occupied houses
Median number of vehichles in renter occupied houses
Mean number of vehichles in renter occupied houses
Rooms in owner-occupied houses - 1 room (%)
Rooms in owner-occupied houses - 2 rooms (%)
Rooms in owner-occupied houses - 3 rooms (%)
Rooms in owner-occupied houses - 4 rooms (%)
Rooms in owner-occupied houses - 5 rooms (%)
Rooms in owner-occupied houses - 6 rooms (%)
Rooms in owner-occupied houses - 7 rooms (%)
Rooms in owner-occupied houses - 8 rooms (%)
Rooms in owner-occupied houses - 9+ rooms (%)
Rooms in renter-occupied houses - 1 room (%)
Rooms in renter-occupied houses - 2 rooms (%)
Rooms in renter-occupied houses - 3 rooms (%)
Rooms in renter-occupied houses - 4 rooms (%)
Rooms in renter-occupied houses - 5 rooms (%)
Rooms in renter-occupied houses - 6 rooms (%)
Rooms in renter-occupied houses - 7 rooms (%)
Rooms in renter-occupied houses - 8 rooms (%)
Rooms in renter-occupied houses - 9+ rooms (%)
Bedrooms in owner-occupied houses - no bedrooms (%)
Bedrooms in owner-occupied houses - 1 bedroom (%)
Bedrooms in owner-occupied houses - 2 bedrooms (%)
Bedrooms in owner-occupied houses - 3 bedrooms (%)
Bedrooms in owner-occupied houses - 4 bedrooms (%)
Bedrooms in owner-occupied houses - 5+ bedrooms (%)
Bedrooms in renter-occupied houses - no bedrooms (%)
Bedrooms in renter-occupied houses - 1 bedroom (%)
Bedrooms in renter-occupied houses - 2 bedrooms (%)
Bedrooms in renter-occupied houses - 3 bedrooms (%)
Bedrooms in renter-occupied houses - 4 bedrooms (%)
Bedrooms in renter-occupied houses - 5+ bedrooms (%)
Vehicles available in owner-occupied houses - no vehicle available (%)
Vehicles available in owner-occupied houses - 1 vehicle available(%)
Vehicles available in owner-occupied houses - 2 Vehicles available (%)
Vehicles available in owner-occupied houses - 3 Vehicles available (%)
Vehicles available in owner-occupied houses - 4 Vehicles available (%)
Vehicles available in owner-occupied houses - 5+ Vehicles available (%)
Vehicles available in renter-occupied houses - no vehicle available (%)
Vehicles available in renter-occupied houses - 1 vehicle available (%)
Vehicles available in renter-occupied houses - 2 Vehicles available (%)
Vehicles available in renter-occupied houses - 3 Vehicles available (%)
Vehicles available in renter-occupied houses - 4 Vehicles available (%)
Vehicles available in renter-occupied houses - 5+ Vehicles available (%)
Housing units in structures - 1, detached (%)
Housing units in structures - 1, attached (%)
Housing units in structures - 2 (%)
Housing units in structures - 3 or 4 (%)
Housing units in structures - 5 to 9 (%)
Housing units in structures - 10 to 19 (%)
Housing units in structures - 20 to 49 (%)
Housing units in structures - 50 or more (%)
Housing units in structures - Mobile home (%)
Housing units in structures - Boat, RV, van, etc. (%)
Housing units in structures - Owners - 1, detached (%)
Housing units in structures - Owners - 1, attached (%)
Housing units in structures - Owners - 2 (%)
Housing units in structures - Owners - 3 or 4 (%)
Housing units in structures - Owners - 5 to 9 (%)
Housing units in structures - Owners - 10 to 19 (%)
Housing units in structures - Owners - 20 to 49 (%)
Housing units in structures - Owners - 50 or more (%)
Housing units in structures - Owners - Mobile home (%)
Housing units in structures - Owners - Boat, RV, van, etc. (%)
Housing units in structures - Renters - 1, detached (%)
Housing units in structures - Renters - 1, attached (%)
Housing units in structures - Renters - 2 (%)
Housing units in structures - Renters - 3 or 4 (%)
Housing units in structures - Renters - 5 to 9 (%)
Housing units in structures - Renters - 10 to 19 (%)
Housing units in structures - Renters - 20 to 49 (%)
Housing units in structures - Renters - 50 or more (%)
Housing units in structures - Renters - Mobile home (%)
Housing units in structures - Renters - Boat, RV, van, etc. (%)
House/condo owner moved in on average (years ago)
Renter moved in on average (years ago)
Year householder moved into unit - Moved in 1999 to March 2000 (%)
Year householder moved into unit - Moved in 1999 to March 2000 (%) - White
Year householder moved into unit - Moved in 1999 to March 2000 (%) - Black or African American
Year householder moved into unit - Moved in 1999 to March 2000 (%) - Asian
Year householder moved into unit - Moved in 1999 to March 2000 (%) - Hispanic or Latino
Year householder moved into unit - Moved in 1999 to March 2000 (%) - American Indian and Alaska Native
Year householder moved into unit - Moved in 1999 to March 2000 (%) - Multirace
Year householder moved into unit - Moved in 1999 to March 2000 (%) - Other Race
Year householder moved into unit - Moved in 1995 to 1998 (%)
Year householder moved into unit - Moved in 1995 to 1998 (%) - White
Year householder moved into unit - Moved in 1995 to 1998 (%) - Black or African American
Year householder moved into unit - Moved in 1995 to 1998 (%) - Asian
Year householder moved into unit - Moved in 1995 to 1998 (%) - Hispanic or Latino
Year householder moved into unit - Moved in 1995 to 1998 (%) - American Indian and Alaska Native
Year householder moved into unit - Moved in 1995 to 1998 (%) - Multirace
Year householder moved into unit - Moved in 1995 to 1998 (%) - Other Race
Year householder moved into unit - Moved in 1990 to 1994 (%)
Year householder moved into unit - Moved in 1990 to 1994 (%) - White
Year householder moved into unit - Moved in 1990 to 1994 (%) - Black or African American
Year householder moved into unit - Moved in 1990 to 1994 (%) - Asian
Year householder moved into unit - Moved in 1990 to 1994 (%) - Hispanic or Latino
Year householder moved into unit - Moved in 1990 to 1994 (%) - American Indian and Alaska Native
Year householder moved into unit - Moved in 1990 to 1994 (%) - Multirace
Year householder moved into unit - Moved in 1990 to 1994 (%) - Other Race
Year householder moved into unit - Moved in 1980 to 1989 (%)
Year householder moved into unit - Moved in 1980 to 1989 (%) - White
Year householder moved into unit - Moved in 1980 to 1989 (%) - Black or African American
Year householder moved into unit - Moved in 1980 to 1989 (%) - Asian
Year householder moved into unit - Moved in 1980 to 1989 (%) - Hispanic or Latino
Year householder moved into unit - Moved in 1980 to 1989 (%) - American Indian and Alaska Native
Year householder moved into unit - Moved in 1980 to 1989 (%) - Multirace
Year householder moved into unit - Moved in 1980 to 1989 (%) - Other Race
Year householder moved into unit - Moved in 1970 to 1979 (%)
Year householder moved into unit - Moved in 1970 to 1979 (%) - White
Year householder moved into unit - Moved in 1970 to 1979 (%) - Black or African American
Year householder moved into unit - Moved in 1970 to 1979 (%) - Asian
Year householder moved into unit - Moved in 1970 to 1979 (%) - Hispanic or Latino
Year householder moved into unit - Moved in 1970 to 1979 (%) - American Indian and Alaska Native
Year householder moved into unit - Moved in 1970 to 1979 (%) - Multirace
Year householder moved into unit - Moved in 1970 to 1979 (%) - Other Race
Year householder moved into unit - Moved in 1969 or earlier (%)
Year householder moved into unit - Moved in 1969 or earlier (%) - White
Year householder moved into unit - Moved in 1969 or earlier (%) - Black or African American
Year householder moved into unit - Moved in 1969 or earlier (%) - Asian
Year householder moved into unit - Moved in 1969 or earlier (%) - Hispanic or Latino
Year householder moved into unit - Moved in 1969 or earlier (%) - American Indian and Alaska Native
Year householder moved into unit - Moved in 1969 or earlier (%) - Multirace
Year householder moved into unit - Moved in 1969 or earlier (%) - Other Race
Housing units lacking complete plumbing facilities (%)
Housing units lacking complete kitchen facilities (%)
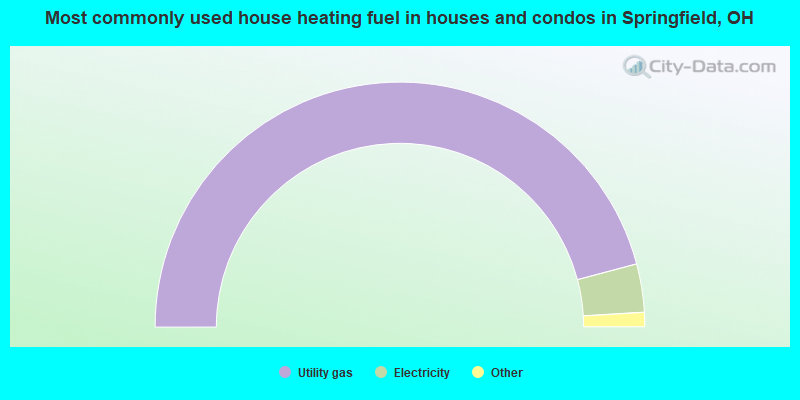
House heating fuel used in houses and condos - Utility gas (%)
House heating fuel used in houses and condos - Bottled, tank, or LP gas (%)
House heating fuel used in houses and condos - Electricity (%)
House heating fuel used in houses and condos - Fuel oil, kerosene, etc. (%)
House heating fuel used in houses and condos - Coal or coke (%)
House heating fuel used in houses and condos - Wood (%)
House heating fuel used in houses and condos - Solar energy (%)
House heating fuel used in houses and condos - Other fuel (%)
House heating fuel used in houses and condos - No fuel used (%)
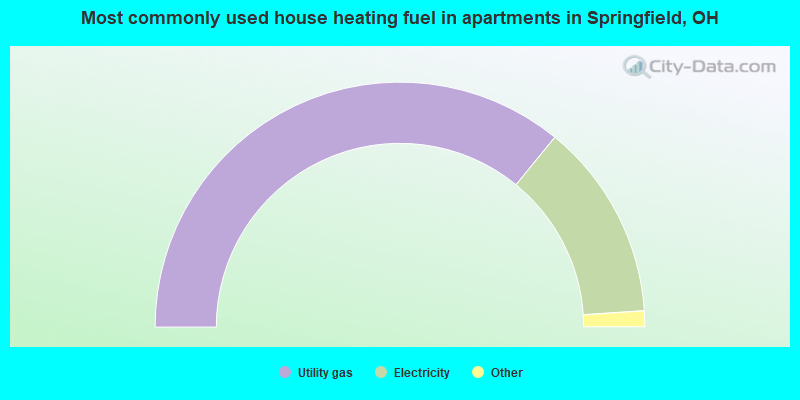
House heating fuel used in apartments - Utility gas (%)
House heating fuel used in apartments - Bottled, tank, or LP gas (%)
House heating fuel used in apartments - Electricity (%)
House heating fuel used in apartments - Fuel oil, kerosene, etc. (%)
House heating fuel used in apartments - Coal or coke (%)
House heating fuel used in apartments - Wood (%)
House heating fuel used in apartments - Solar energy (%)
House heating fuel used in apartments - Other fuel (%)
House heating fuel used in apartments - No fuel used (%)
Latest news about housing in Springfield, OH collected exclusively by city-data.com from local newspapers, TV, and radio stations
Median year house/condo built: 1948Median year apartment built: 1962Household type by relationship:
Households: 58,193
Male householders: 10,748 (4,140 living alone ), Female householders: 13,197 (4,871 living alone )7,108 spouses (7,080 opposite-sex spouses ), 2,917 unmarried partners , (2,761 opposite-sex unmarried partners ), 15,222 children (13,956 natural , 611 adopted , 654 stepchildren ), 1,745 grandchildren , 740 brothers or sisters , 406 parents , 181 foster children , 1,287 other relatives , 2,227 non-relatives In group quarters: 2,409
Size of family households: 5,403 2-persons , 2,773 3-persons , 2,028 4-persons , 1,559 5-persons , 423 6-persons , 166 7-or-more-persons .
Size of nonfamily households: 9,928 1-person , 2,187 2-persons , 370 3-persons , 32 4-persons .
4,858 married couples with children. single-parent households (1,211 men , 3,868 women ).
95.2% of residents of Springfield speak English at home. of residents speak Spanish at home (59% speak English very well , 17% speak English well , 15% speak English not well , 9% don't speak English at all ).of residents speak other Indo-European language at home (25% speak English very well , 41% speak English well , 14% speak English not well , 20% don't speak English at all ).of residents speak Asian or Pacific Island language at home (31% speak English very well , 14% speak English well , 56% speak English not well ).of residents speak other language at home (57% speak English very well , 25% speak English well , 6% speak English not well , 13% don't speak English at all ).
Foreign born population: 1,998 (3.4%)of them are naturalized citizens )
Median number of rooms in houses and condos:
Median number of rooms in apartments
Owner-occupied Renter-occupied
Rooms in owner-occupied houses in Springfield, Ohio
11 1 room 53 2 rooms 56 3 rooms 795 4 rooms 2,811 5 rooms 3,302 6 rooms 2,260 7 rooms 1,545 8 rooms 1,713 9+ rooms
Rooms in renter-occupied apartments in Springfield, Ohio
295 1 room 348 2 rooms 1,878 3 rooms 2,720 4 rooms 3,016 5 rooms 1,976 6 rooms 1,016 7 rooms 313 8 rooms 287 9+ rooms
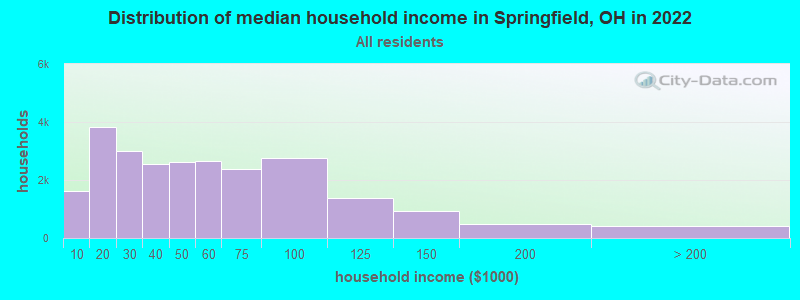
Springfield, OH household income distribution 1,608 Less than $10,0003,811 $10,000 to $19,9993,000 $20,000 to $29,9992,538 $30,000 to $39,9992,628 $40,000 to $49,9992,659 $50,000 to $59,9992,368 $60,000 to $74,9992,769 $75,000 to $99,9991,390 $100,000 to $124,999936 $125,000 to $149,999499 $150,000 to $199,999397 $200,000 or more
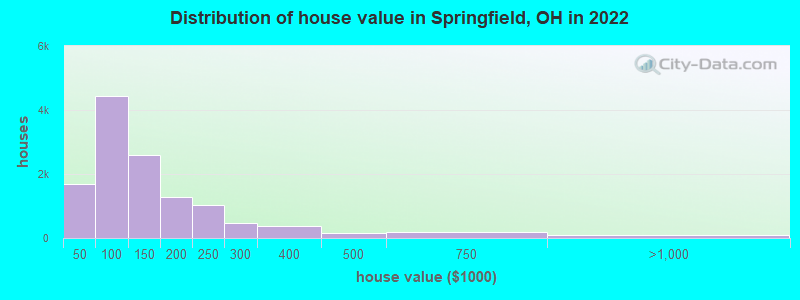
Home value of owner - occupied houses in 2022 in Springfield, OH 138 Less than $10,000278 $10,000 to $14,99999 $15,000 to $19,999170 $20,000 to $24,999100 $25,000 to $29,999273 $30,000 to $34,999271 $35,000 to $39,999339 $40,000 to $49,999465 $50,000 to $59,999963 $60,000 to $69,9991,163 $70,000 to $79,9991,011 $80,000 to $89,999503 $90,000 to $99,9991,578 $100,000 to $124,9991,026 $125,000 to $149,999587 $150,000 to $174,999696 $175,000 to $199,9991,045 $200,000 to $249,999460 $250,000 to $299,999362 $300,000 to $399,999156 $400,000 to $499,999202 $500,000 to $749,99986 $750,000 to $999,999Rent paid by renters in 2022 in Springfield, OH 416 Less than $10072 $100 to $149221 $150 to $199663 $200 to $249191 $250 to $299319 $300 to $349187 $350 to $399240 $400 to $449676 $450 to $4991,225 $500 to $5491,263 $550 to $5991,853 $600 to $649758 $650 to $699873 $700 to $749283 $750 to $799918 $800 to $899430 $900 to $999273 $1,000 to $1,249143 $1,250 to $1,49925 $1,500 to $1,999120 $2,000 to $2,49930 $2,500 to $2,99937 $3,000 to $3,4998 $3,500 or more360 No cash rent
Percentage of workers working in this county: 72.9%Number of people working at home: 1,568 (6.5% of all workers )
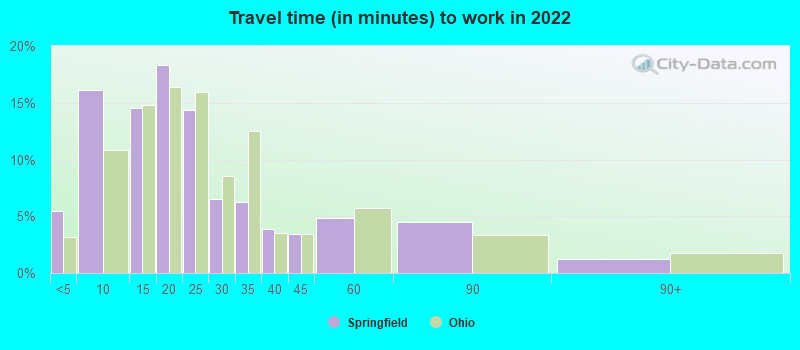
Travel time to work (commute)
Less than 5 minutes: 1,6845 to 9 minutes: 4,23310 to 14 minutes: 3,78815 to 19 minutes: 3,68220 to 24 minutes: 2,12725 to 29 minutes: 1,03330 to 34 minutes: 1,91635 to 39 minutes: 69240 to 44 minutes: 86645 to 59 minutes: 1,74960 to 89 minutes: 47790 or more minutes: 163
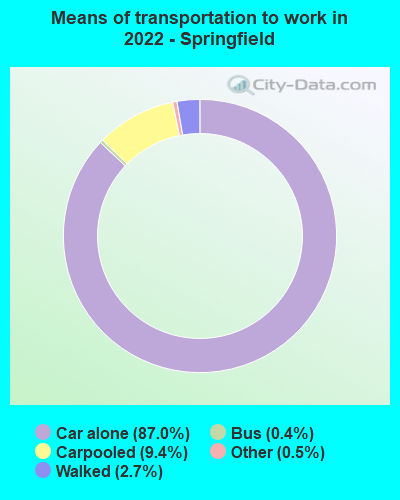
Means of transportation to work:
Drove a car alone: 24,963 (83.3%)Carpooled: 1,941 (6.5%)Bus : 191 (0.6%)Taxi: 260 (0.9%)Bicycle: 14 (0.0%)Walked: 979 (3.3%)Worked at home: 1,568 (5.2%)
Unemployment by race in 2022
Unemployment rate for White non-Hispanic residents 7.8% Males6.2% FemalesUnemployment rate for Black residents 16.0% Males11.6% FemalesUnemployment rate for Asian residents 12.8% FemalesUnemployment rate for other race residents 5.7% FemalesUnemployment rate for two or more race residents 16.0% Males6.1% FemalesUnemployment rate for Hispanic or Latino residents 6.8% Males6.5% Females
Year of entry for the foreign-born population in Springfield, Ohio
736 2010 or later 632 2000 to 2009 231 1990 to 1999 222 1980 to 1989 103 1970 to 1979 209 Before 1970
First ancestries reported:
German: 3,333 (12.7%)
American: 2,892 (11.0%)
English: 2,323 (8.9%)
Irish: 1,650 (6.3%)
Haitian: 847 (3.2%)
Italian: 819 (3.1%)
European: 441 (1.7%)
Scotch-Irish: 177 (0.7%)
African: 170 (0.6%)
Scottish: 155 (0.6%)
Eastern European: 152 (0.6%)
Polish: 147 (0.6%)
French: 101 (0.4%)
Greek: 81 (0.3%)
Swiss: 75 (0.3%)
Dutch: 68 (0.3%)
Welsh: 67 (0.3%)
Nigerian: 65 (0.2%)
Ethiopian: 63 (0.2%)
Canadian: 60 (0.2%)
French Canadian: 56 (0.2%)
Norwegian: 44 (0.2%)
Czech: 42 (0.2%)
Slovak: 30 (0.1%)
British: 25 (0.10%)
Slavic: 18 (0.07%)
Danish: 16 (0.06%)
Pennsylvania German: 16 (0.06%)
Portuguese: 15 (0.06%)
Czechoslovakian: 14 (0.05%)
Lithuanian: 14 (0.05%)
Hungarian: 13 (0.05%)
Scandinavian: 11 (0.04%)
Palestinian: 11 (0.04%)
Macedonian: 10 (0.04%)
Russian: 9 (0.03%)
Swedish: 8 (0.03%)
Slovene: 7 (0.03%)
Iranian: 5 (0.02%)
Celtic: 5 (0.02%)
Sierra Leonean: 5 (0.02%)
Romanian: 3 (0.01%)
West Indian: 3 (0.01%) Most common places of birth for foreign-born residents (%): Mexico Springfield:
39.4% (723)Ohio:
7.8% (44,796)
Haiti Springfield:
35.9% (660)Ohio:
0.5% (2,819)
China, excluding Hong Kong and Taiwan Springfield:
5.4% (100)Ohio:
6.2% (35,703)
Dominican Republic Springfield:
2.7% (50)Ohio:
1.1% (6,549)
India Springfield:
2.7% (49)Ohio:
11.6% (66,525)
West Indies Springfield:
2.6% (47)Ohio:
0.0% (228)
Germany Springfield:
2.2% (40)Ohio:
2.2% (12,846)
United Kingdom, excluding England and Scotland Springfield:
2.1% (38)Ohio:
0.9% (5,422)
Algeria Springfield:
1.9% (35)Ohio:
0.4% (2,052)
Philippines Springfield:
1.9% (35)Ohio:
3.1% (17,818)
Israel Springfield:
1.9% (34)Ohio:
0.5% (2,631)
Vietnam Springfield:
1.7% (31)Ohio:
1.9% (10,960)
Senegal Springfield:
1.6% (29)Ohio:
0.5% (3,061)
Place of birth for U.S.-born residents:
This state: 45,902Other state: 9,445Northeast: 1,112Midwest: 2,695South: 4,319West: 1,360 83.0% of Springfield residents lived in the same house 1 years ago.
Out of people who lived in different houses, 44.1% lived in this county.
Out of people who lived in different counties, 48.6% lived in Ohio.
Springfield:
83.0%State average:
87.8%
Education attainment for males 25 years and older:
No schooling: 682Nursery to 4th grade: 885th and 6th grade: 1307th and 8th grade: 1899th grade: 33210th grade: 60011th grade: 83012th grade, no diploma: 677High school graduate (or equivalency): 7,047Less than 1 year of college: 1,131Some college more than 1 year, no degree: 2,476Associate degree: 1,307Bachelor's degree: 1,724Master's degree: 683Professional school degree: 101Doctorate degree: 243
Education attainment for females 25 years and older:
No schooling: 67Nursery to 4th grade: 315th and 6th grade: 1337th and 8th grade: 2299th grade: 52810th grade: 50411th grade: 60712th grade, no diploma: 189High school graduate (or equivalency): 6,991Less than 1 year of college: 2,174Some college more than 1 year, no degree: 2,929Associate degree: 2,034Bachelor's degree: 2,512Master's degree: 752Professional school degree: 80Doctorate degree: 49
Housing units in structures:
One, detached: 17,661One, attached: 3,310Two: 1,2423 or 4: 1,3475 to 9: 1,44410 to 19: 77820 to 49: 53350 or more: 1,476Mobile homes: 9Boats, RVs, vans, etc.: 25Housing units lacking complete plumbing facilities in 2022: 3.6%Housing units lacking complete kitchen facilities in 2022: 6.9%House/condo owner moved in on average 14 years ago
Renter moved in on average 3 years ago
Private vs. public school enrollment:
Students in private schools in grades 1 to 8 (elementary and middle school): 1,115 Students in private schools in grades 9 to 12 (high school): 370 Students in private undergraduate colleges: 1,067