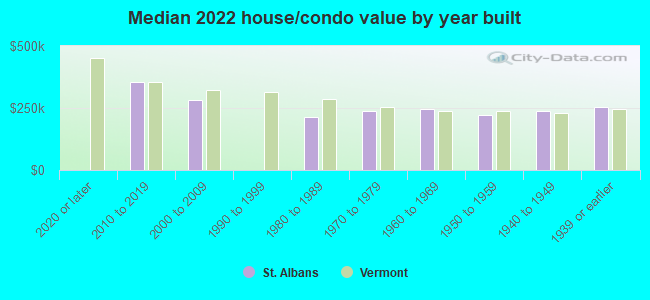
St. Albans, VT (Vermont) Houses and Residents
| St. Albans: | $251,568 |
| Vermont: | $304,700 |
Mean price in 2022:
Detached houses: $256,569
Here: $256,569 State: $378,260 Townhouses or other attached units: $241,415
Here: $241,415 State: $360,670 In 2-unit structures: $241,516
Here: $241,516 State: $304,383 In 3-to-4-unit structures: $387,373
Here: $387,373 State: $746,315 In 5-or-more-unit structures: $208,190
Here: $208,190 State: $259,595 Mobile homes: $63,987
Here: $63,987 State: $98,266
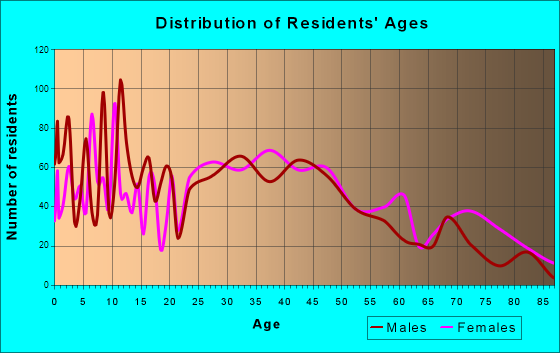
Total population: 6,860 (All urban)
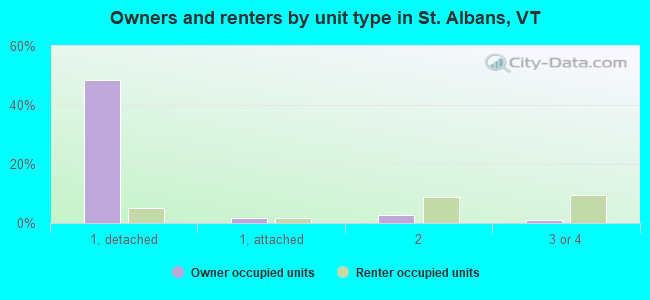
Houses: 3,273 (2,894 occupied: 1,540 owner occupied, 1,442 renter occupied)
| % of renters here: | 48% |
| State: | 26% |
Housing density: 1,612 houses/condos per square mile
Median price asked for vacant for-sale houses and condos in 2022 in this county: $254,297.
Median contract rent in 2022: $961 (lower quartile is $583, upper quartile is $1,162)
Median rent asked for vacant for-rent units in 2022: $677
Median gross rent in St. Albans, VT in 2022: $1,135
Housing units in St. Albans with a mortgage: 1,085 (163 second mortgage, 1 home equity loan, 84 both second mortgage and home equity loan)
Houses without a mortgage: 35
Median household income for houses/condos with a mortgage: $88,101
Median household income for apartments without a mortgage: $55,302
Median monthly housing costs: $1,264
Compare current foreclosures near St. Albans, VT:
| Photo | Address | Area | Beds / Baths | Price | Details |
|---|---|---|---|---|---|

|
#1
Senesac Pl
Isle La Motte, VT 05463
|
2,016 sq. feet
|
1 baths 4 beds |
$339,900
|
show details |

|
#2
Ballard Rd
Highgate Center, VT 05459
|
1,196 sq. feet
|
1 baths 3 beds |
$349,900
|
show details |

|
#3
Academy Street
Alburg, VT 05440
|
- sq. feet
|
2 baths 4 beds |
show details | |

|
#4
Chester Arthur Rd
Enosburg Falls, VT 05450
|
1,690 sq. feet
|
2 baths 3 beds |
show details | |

|
#5
Victoria Ln, Apt 108
Saint Albans, VT 05478
|
- sq. feet
|
- baths - beds |
show details | |

|
#6
Windcrest Road
Milton, VT 05468
|
- sq. feet
|
- baths - beds |
show details | |

|
#7
Lake St
Alburg, VT 05440
|
- sq. feet
|
- baths - beds |
show details | |

|
#8
Carle St
Alburg, VT 05440
|
- sq. feet
|
- baths - beds |
show details | |

|
#9
Main St N
Enosburg Falls, VT 05450
|
- sq. feet
|
- baths - beds |
show details | |

|
#10
Boutah Rd
Alburg, VT 05440
|
- sq. feet
|
- baths - beds |
show details |
| Photo | Address | Area | Beds / Baths | Price | Details |
|---|---|---|---|---|---|

|
#11
Us Route 2
Grand Isle, VT 05458
|
- sq. feet
|
- baths - beds |
show details | |

|
#12
Lapierre Dr
Milton, VT 05468
|
- sq. feet
|
- baths - beds |
show details | |

|
#13
Carter Hill Rd
Swanton, VT 05488
|
- sq. feet
|
- baths - beds |
show details | |

|
#14
Roosevelt Hwy Apt 111
Colchester, VT 05446
|
- sq. feet
|
- baths - beds |
show details | |

|
#15
E Shore N
Grand Isle, VT 05458
|
- sq. feet
|
- baths - beds |
show details | |

|
#16
Elizabeth St
Saint Albans, VT 05478
|
- sq. feet
|
- baths - beds |
show details | |

|
#17
Hibbard Rd
Milton, VT 05468
|
- sq. feet
|
- baths - beds |
show details | |

|
#18
Mill St
Sheldon, VT 05483
|
- sq. feet
|
- baths - beds |
show details | |

|
#19
Dunning St
Swanton, VT 05488
|
- sq. feet
|
- baths - beds |
show details | |

|
#20
Bmx Blvd
Highgate Center, VT 05459
|
- sq. feet
|
- baths - beds |
show details |
| Photo | Address | Area | Beds / Baths | Price | Details |
|---|---|---|---|---|---|

|
#21
Abenaki Acres
Swanton, VT 05488
|
- sq. feet
|
- baths - beds |
show details | |

|
#22
Reynolds Rd
Saint Albans, VT 05478
|
- sq. feet
|
- baths - beds |
show details | |

|
#23
Lincoln Ave
Saint Albans, VT 05478
|
- sq. feet
|
- baths - beds |
show details | |

|
#24
W Berkshire Rd
Enosburg Falls, VT 05450
|
- sq. feet
|
- baths - beds |
show details | |

|
#25
Berkshire Est
Enosburg Falls, VT 05450
|
- sq. feet
|
- baths - beds |
show details | |

|
#26
Walnut St
Saint Albans, VT 05478
|
- sq. feet
|
- baths - beds |
show details | |

|
#27
Potter Ave
Saint Albans, VT 05478
|
- sq. feet
|
- baths - beds |
show details | |

|
#28
Woodcrest Cir
Milton, VT 05468
|
- sq. feet
|
- baths - beds |
show details | |

|
#29
Pearl Ave
Saint Albans, VT 05478
|
- sq. feet
|
- baths - beds |
show details | |

|
#30
Brown Ave
Swanton, VT 05488
|
- sq. feet
|
- baths - beds |
show details |
| Photo | Address | Area | Beds / Baths | Price | Details |
|---|---|---|---|---|---|

|
#31
Kingsbury Xing
Milton, VT 05468
|
- sq. feet
|
- baths - beds |
show details | |

|
#32
Route 7 N
Milton, VT 05468
|
- sq. feet
|
- baths - beds |
show details | |

|
#33
Lake St
Saint Albans, VT 05478
|
- sq. feet
|
- baths - beds |
show details | |

|
#34
Old Academy St # 102
Fairfax, VT 05454
|
- sq. feet
|
- baths - beds |
show details | |

|
#35
Main St
Fairfax, VT 05454
|
- sq. feet
|
- baths - beds |
show details | |

|
Check over 1 million property listings on Foreclosure.com!
|
browse all offers | |||


 | What I love about living in Vermont (52 replies) |
| Apartments in Burlington or nearby locations (13 replies) |
| If you moved to VT from another place, let us know what your experience was here (161 replies) |
| Possibly Relocating to St. Albans (13 replies) |
| Another 'Where Should I Live in Vermont' Post (11 replies) |
| Curious about St. Albans (4 replies) |
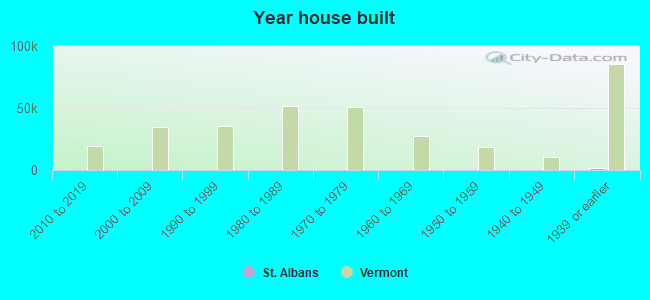
Median year apartment built: 1948
Household type by relationship:
Households: 6,925- Male householders: 1,087 (353 living alone), Female householders: 1,788 (641 living alone)
1,094 spouses (1,080 opposite-sex spouses), 280 unmarried partners, (269 opposite-sex unmarried partners), 2,023 children (1,810 natural, 111 adopted, 101 stepchildren), 101 grandchildren, 202 brothers or sisters, 0 parents, 21 foster children, 97 other relatives, 141 non-relatives
- In group quarters: 87
Size of family households: 901 2-persons, 504 3-persons, 156 4-persons, 120 5-persons, 38 6-persons, 31 7-or-more-persons.
Size of nonfamily households: 1,009 1-person, 208 2-persons, 9 3-persons.
456 married couples with children.
708 single-parent households (140 men, 568 women).
96.7% of residents of St. Albans speak English at home.
0.4% of residents speak Spanish at home (100% speak English very well).
2.0% of residents speak other Indo-European language at home (56% speak English very well, 40% speak English not well, 4% don't speak English at all).
0.4% of residents speak other language at home (54% speak English very well, 46% speak English well).
Foreign born population: 140 (2.0%)
(74.3% of them are naturalized citizens)
| Here: | 6.7 |
| State: | 6.4 |
| Here: | 4.2 |
| State: | 3.9 |
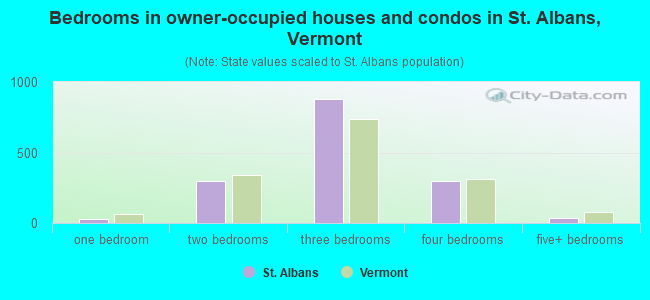
- Bedrooms in owner-occupied houses and condos in St. Albans, Vermont
- 0no bedroom
- 291 bedroom
- 3002 bedrooms
- 8813 bedrooms
- 2964 bedrooms
- 345+ bedrooms
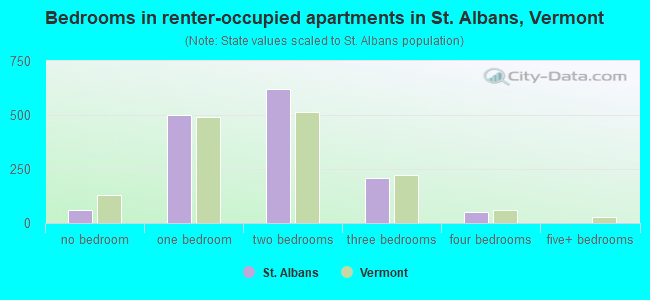
- Bedrooms in renter-occupied apartments in St. Albans, Vermont
- 59no bedroom
- 4991 bedroom
- 6222 bedrooms
- 2093 bedrooms
- 524 bedrooms
- 05+ bedrooms
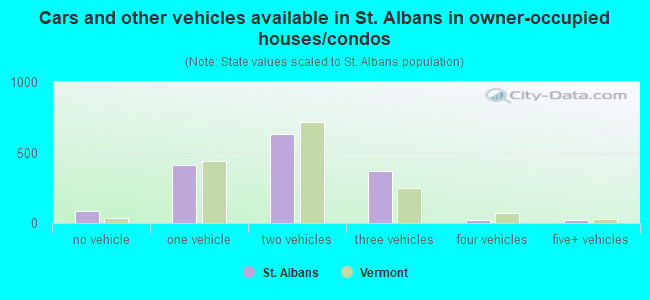
- Cars and other vehicles available in St. Albans in owner-occupied houses/condos
- 88no vehicle
- 4091 vehicle
- 6282 vehicles
- 3713 vehicles
- 214 vehicles
- 245+ vehicles
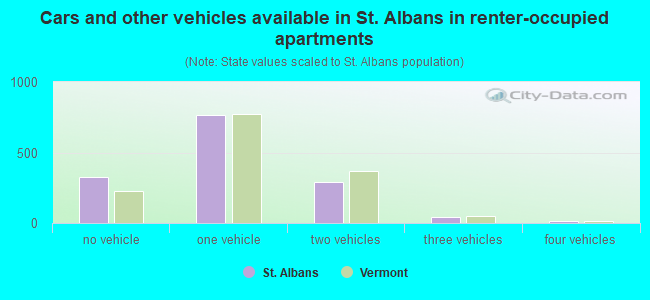
- Cars and other vehicles available in St. Albans in renter-occupied apartments
- 323no vehicle
- 7691 vehicle
- 2942 vehicles
- 423 vehicles
- 154 vehicles
- 05+ vehicles
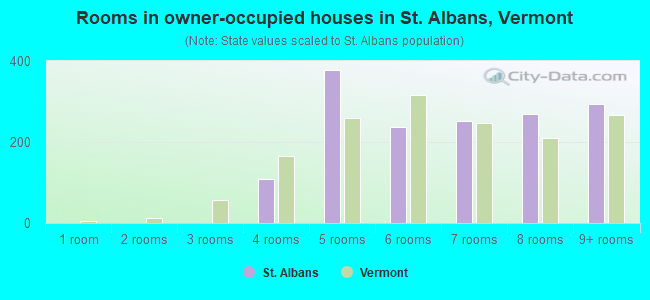
- Rooms in owner-occupied houses in St. Albans, Vermont
- 01 room
- 02 rooms
- 03 rooms
- 1094 rooms
- 3795 rooms
- 2366 rooms
- 2537 rooms
- 2698 rooms
- 2949+ rooms
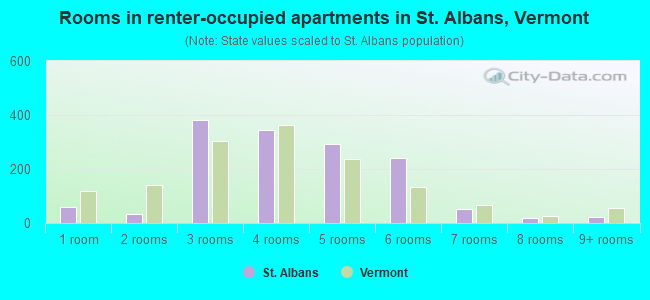
- Rooms in renter-occupied apartments in St. Albans, Vermont
- 591 room
- 342 rooms
- 3813 rooms
- 3444 rooms
- 2915 rooms
- 2396 rooms
- 537 rooms
- 178 rooms
- 249+ rooms
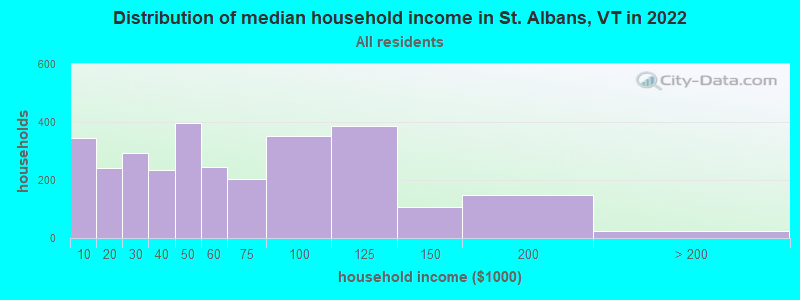
St. Albans, VT household income distribution

- 344Less than $10,000
- 242$10,000 to $19,999
- 292$20,000 to $29,999
- 233$30,000 to $39,999
- 398$40,000 to $49,999
- 244$50,000 to $59,999
- 205$60,000 to $74,999
- 352$75,000 to $99,999
- 387$100,000 to $124,999
- 108$125,000 to $149,999
- 150$150,000 to $199,999
- 24$200,000 or more
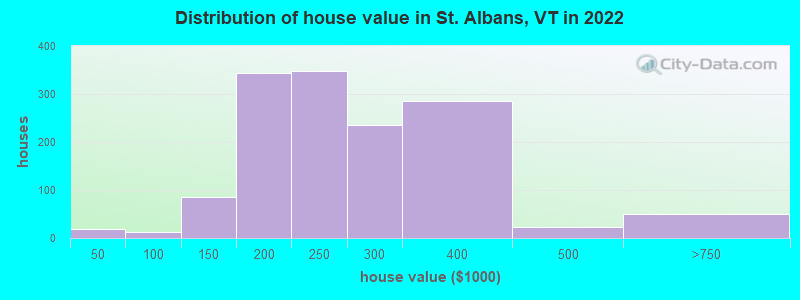
Home value of owner - occupied houses in 2022 in St. Albans, VT
-
- 9$15,000 to $19,999
- 8$35,000 to $39,999
- 12$70,000 to $79,999
- 28$100,000 to $124,999
- 57$125,000 to $149,999
- 172$150,000 to $174,999
- 171$175,000 to $199,999
- 347$200,000 to $249,999
- 235$250,000 to $299,999
- 284$300,000 to $399,999
- 21$400,000 to $499,999
- 50$500,000 to $749,999
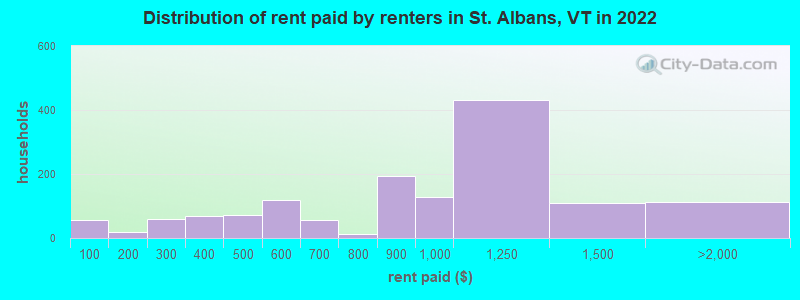
Rent paid by renters in 2022 in St. Albans, VT
-
- 55Less than $100
- 11$100 to $149
- 8$150 to $199
- 10$200 to $249
- 47$250 to $299
- 68$300 to $349
- 21$400 to $449
- 50$450 to $499
- 48$500 to $549
- 70$550 to $599
- 15$600 to $649
- 40$650 to $699
- 11$750 to $799
- 194$800 to $899
- 128$900 to $999
- 429$1,000 to $1,249
- 110$1,250 to $1,499
- 112$1,500 to $1,999
Percentage of workers working in this county: 61.8%
Number of people working at home: 293 (9.1% of all workers)
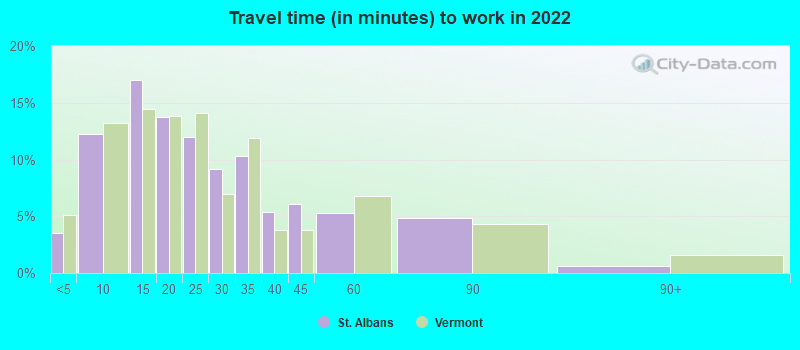
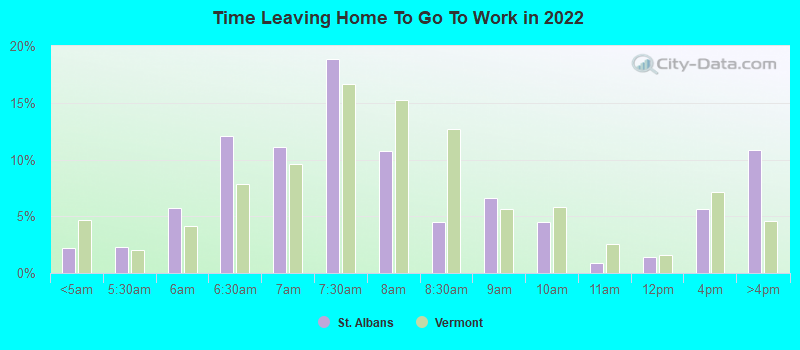
Travel time to work (commute)
- Less than 5 minutes: 224
- 5 to 9 minutes: 457
- 10 to 14 minutes: 437
- 15 to 19 minutes: 234
- 20 to 24 minutes: 277
- 25 to 29 minutes: 77
- 30 to 34 minutes: 401
- 35 to 39 minutes: 245
- 40 to 44 minutes: 307
- 45 to 59 minutes: 179
- 60 to 89 minutes: 30
- 90 or more minutes: 24
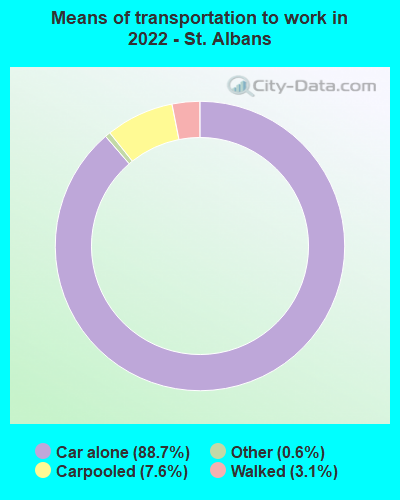
Means of transportation to work:
- Drove a car alone: 4,430 (82.9%)
- Carpooled: 340 (6.4%)
- Taxi: 28 (0.5%)
- Walked: 149 (2.8%)
- Worked at home: 293 (5.5%)
- Unemployment by race in 2022
- Unemployment rate for White non-Hispanic residents
- 2.0%Males
- 0.6%Females
- Unemployment rate for two or more race residents
- 11.8%Males
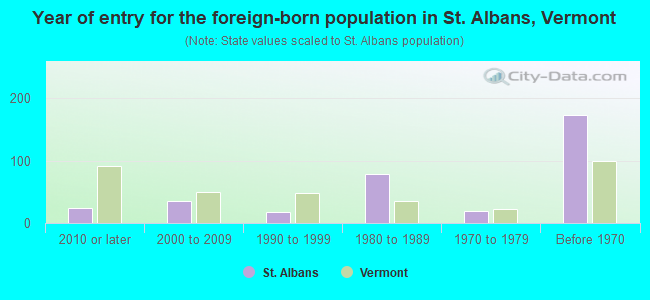
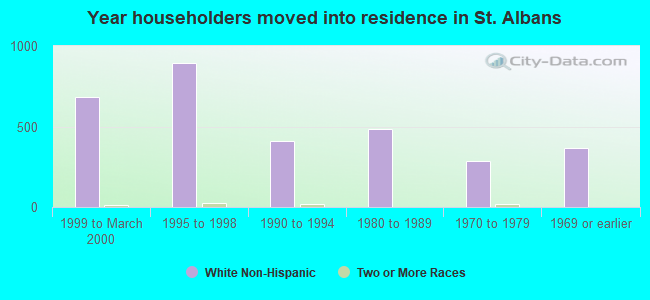
- Year of entry for the foreign-born population in St. Albans, Vermont
- 242010 or later
- 352000 to 2009
- 181990 to 1999
- 781980 to 1989
- 201970 to 1979
- 173Before 1970
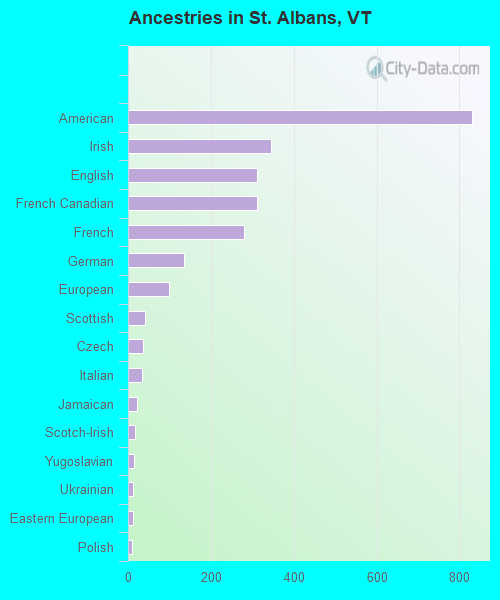
First ancestries reported:
- American: 830 (28.7%)
- Irish: 346 (11.9%)
- English: 312 (10.8%)
- French Canadian: 311 (10.7%)
- French: 279 (9.6%)
- German: 134 (4.6%)
- European: 99 (3.4%)
- Scottish: 40 (1.4%)
- Czech: 37 (1.3%)
- Italian: 34 (1.2%)
- Jamaican: 21 (0.7%)
- Scotch-Irish: 18 (0.6%)
- Yugoslavian: 15 (0.5%)
- Ukrainian: 13 (0.4%)
- Eastern European: 11 (0.4%)
- Polish: 9 (0.3%)
- Scandinavian: 7 (0.2%)
- Guyanese: 6 (0.2%)
Most common places of birth for foreign-born residents (%):
| St. Albans: | 45.9% (67) |
| Vermont: | 18.5% (5,219) |
| St. Albans: | 16.4% (24) |
| Vermont: | 0.7% (197) |
| St. Albans: | 14.4% (21) |
| Vermont: | 1.8% (520) |
| St. Albans: | 11.6% (17) |
| Vermont: | 0.8% (223) |
| St. Albans: | 5.5% (8) |
| Vermont: | 3.5% (981) |
| St. Albans: | 3.4% (5) |
| Vermont: | 0.5% (151) |
Place of birth for U.S.-born residents:
- This state: 4,583
- Other state: 2,026
- Northeast: 1,448
- Midwest: 179
- South: 277
- West: 121
86.4% of St. Albans residents lived in the same house 1 years ago.
Out of people who lived in different houses, 40.4% lived in this county.
Out of people who lived in different counties, 56.2% lived in Vermont.
| St. Albans: | 86.4% |
| State average: | 88.2% |
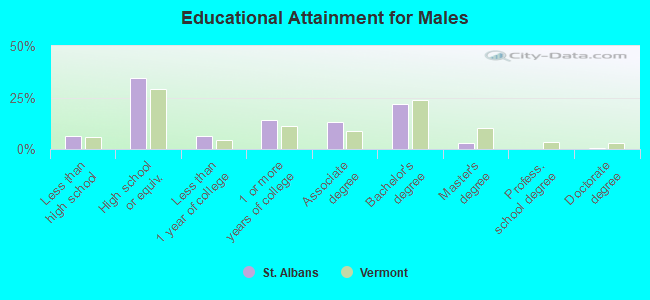
Education attainment for males 25 years and older:
- No schooling: 0
- Nursery to 4th grade: 0
- 5th and 6th grade: 47
- 7th and 8th grade: 8
- 9th grade: 0
- 10th grade: 14
- 11th grade: 46
- 12th grade, no diploma: 25
- High school graduate (or equivalency): 753
- Less than 1 year of college: 141
- Some college more than 1 year, no degree: 311
- Associate degree: 283
- Bachelor's degree: 476
- Master's degree: 67
- Professional school degree: 1
- Doctorate degree: 12
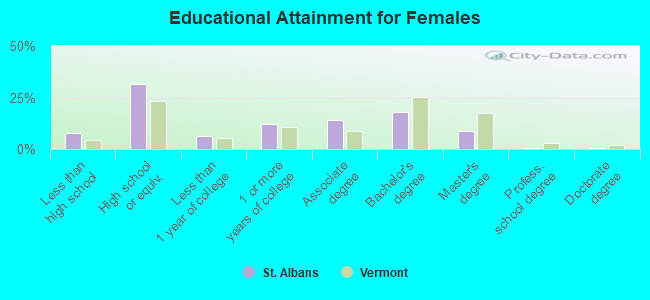
Education attainment for females 25 years and older:
- No schooling: 29
- Nursery to 4th grade: 0
- 5th and 6th grade: 0
- 7th and 8th grade: 42
- 9th grade: 3
- 10th grade: 36
- 11th grade: 90
- 12th grade, no diploma: 0
- High school graduate (or equivalency): 796
- Less than 1 year of college: 161
- Some college more than 1 year, no degree: 305
- Associate degree: 355
- Bachelor's degree: 445
- Master's degree: 221
- Professional school degree: 8
- Doctorate degree: 18
Housing units in structures:
- One, detached: 1,534
- One, attached: 104
- Two: 580
- 3 or 4: 553
- 5 to 9: 226
- 10 to 19: 128
- 20 to 49: 77
- 50 or more: 43
- Mobile homes: 24
Median worth of mobile homes: $76,700
Housing units lacking complete kitchen facilities in 2022: 2.3%
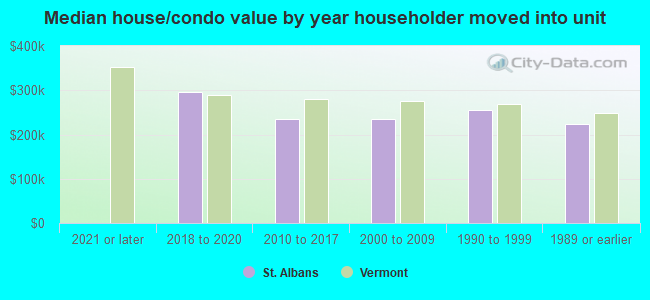
House/condo owner moved in on average 16 years ago
Renter moved in on average 5 years ago
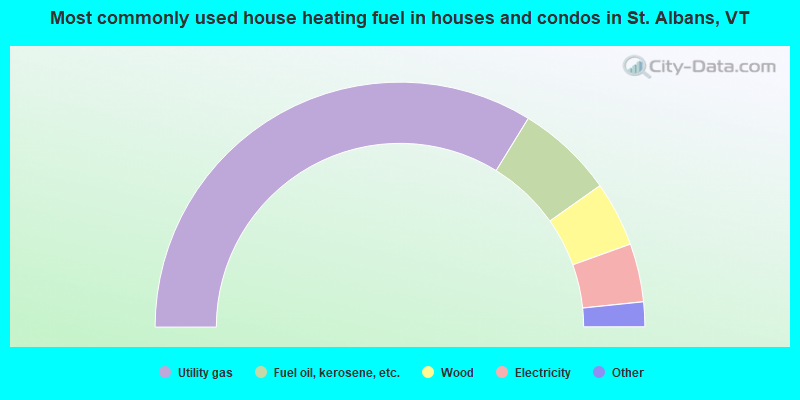
- 67.7%Utility gas
- 12.9%Fuel oil, kerosene, etc.
- 8.6%Wood
- 7.7%Electricity
- 1.6%Bottled, tank, or LP gas
- 1.6%Other fuel
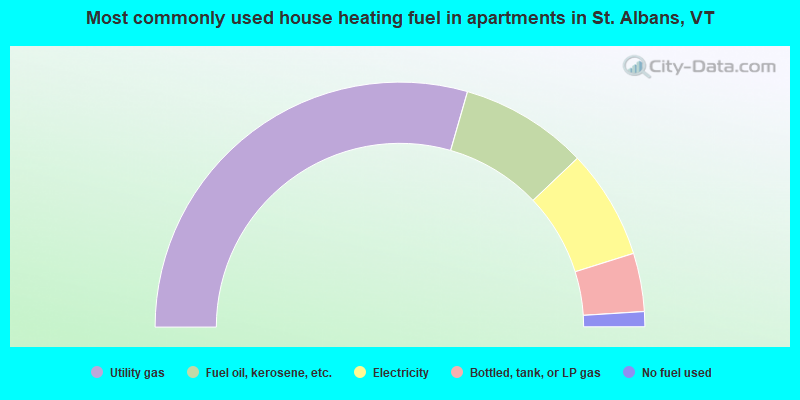
- 58.9%Utility gas
- 16.9%Fuel oil, kerosene, etc.
- 14.5%Electricity
- 7.7%Bottled, tank, or LP gas
- 2.0%No fuel used
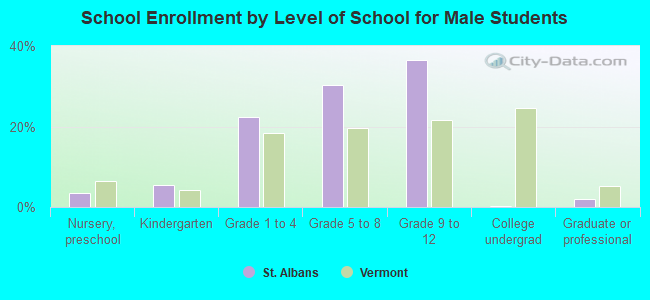
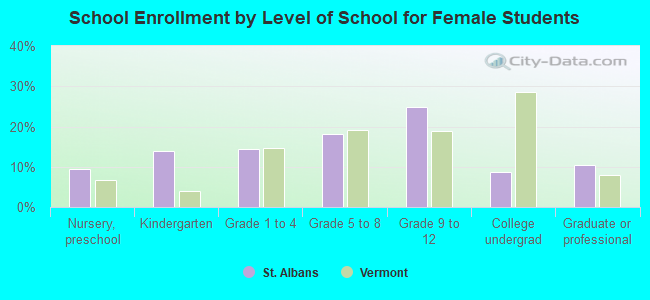
Private vs. public school enrollment:
| Here: | 7.1% |
| Vermont: | 10.3% |
| Here: | 6.5% |
| Vermont: | 11.6% |
| Here: | 0.0% |
| Vermont: | 29.2% |