St. Anne, IL (Illinois) Houses and Residents
| St. Anne: | $135,895 |
| Illinois: | $251,600 |
Mean price in 2022:
Detached houses: $152,263
Here: $152,263 State: $310,164
Total population: 1,230 (Urban population: 0, Rural population: 1,205 (5 farm, 1,200 nonfarm))
Houses: 488 (419 occupied: 262 owner occupied, 155 renter occupied)
| % of renters here: | 37% |
| State: | 33% |
Housing density: 960 houses/condos per square mile
Median price asked for vacant for-sale houses and condos in 2022 in this county: $115,283.
Median contract rent in 2022: $605 (lower quartile is $460, upper quartile is $751)
Median rent asked for vacant for-rent units in 2022: $549
Median gross rent in St. Anne, IL in 2022: $774
Housing units in St. Anne with a mortgage: 135 (6 second mortgage, 0 home equity loan, 6 both second mortgage and home equity loan)
Houses without a mortgage: 3
Median household income for houses/condos with a mortgage: $98,655
Median household income for apartments without a mortgage: $47,692
Median monthly housing costs: $775
Compare current foreclosures near St. Anne, IL:
| Photo | Address | Area | Beds / Baths | Price | Details |
|---|---|---|---|---|---|

|
#1
S Cleveland Ave
Bradley, IL 60915
|
1,200 sq. feet
|
1 baths 2 beds |
$103,900
|
show details |

|
#2
Heather Rd E
Bourbonnais, IL 60914
|
- sq. feet
|
2 baths 3 beds |
$272,400
|
show details |

|
#3
E Fine St
Ashkum, IL 60911
|
1,551 sq. feet
|
1 baths 2 beds |
show details | |

|
#4
Toni St
Bourbonnais, IL 60914
|
920 sq. feet
|
1 baths 3 beds |
show details | |

|
#5
N Raub Ave
Donovan, IL 60931
|
2,012 sq. feet
|
2 baths 3 beds |
show details | |

|
#6
S Douglas Ave
Bradley, IL 60915
|
852 sq. feet
|
1 baths 3 beds |
show details | |

|
#7
S Main St
Iroquois, IL 60945
|
2,173 sq. feet
|
1 baths 4 beds |
show details | |

|
#8
West Second South Street
Chebanse, IL 60922
|
1,288 sq. feet
|
2 baths 3 beds |
show details | |

|
#9
W River St
Bourbonnais, IL 60914
|
2,136 sq. feet
|
2 baths 4 beds |
show details | |

|
#10
S 4th Ave
Kankakee, IL 60901
|
- sq. feet
|
1 baths 2 beds |
show details |
| Photo | Address | Area | Beds / Baths | Price | Details |
|---|---|---|---|---|---|

|
#11
N 2nd St
Watseka, IL 60970
|
- sq. feet
|
2 baths 3 beds |
show details | |

|
#12
N Chicago St
Watseka, IL 60970
|
- sq. feet
|
- baths - beds |
$27,900
|
show details |

|
#13
W 800 S
Morocco, IN 47963
|
1,936 sq. feet
|
1 baths 5 beds |
show details | |

|
#14
S Clay St
Morocco, IN 47963
|
1,518 sq. feet
|
1 baths 3 beds |
show details | |

|
#15
S Mckinley Ave
Kankakee, IL 60901
|
- sq. feet
|
1 baths 2 beds |
show details | |

|
#16
Strasma W Dr
Kankakee, IL 60901
|
- sq. feet
|
2 baths 4 beds |
show details | |

|
#17
W Beaver St
Morocco, IN 47963
|
938 sq. feet
|
1 baths 2 beds |
show details | |

|
#18
S Main St
Morocco, IN 47963
|
1,960 sq. feet
|
3 baths - beds |
show details | |

|
#19
Timber Ridge Ct
Kankakee, IL 60901
|
- sq. feet
|
2 baths - beds |
show details | |

|
#20
E Washington St
Morocco, IN 47963
|
1,148 sq. feet
|
1 baths - beds |
show details |
| Photo | Address | Area | Beds / Baths | Price | Details |
|---|---|---|---|---|---|

|
#21
E Bethel Dr
Bourbonnais, IL 60914
|
- sq. feet
|
- baths - beds |
show details | |

|
#22
W Hickory St
Kankakee, IL 60901
|
- sq. feet
|
- baths - beds |
show details | |

|
#23
S 4th Ave
Kankakee, IL 60901
|
- sq. feet
|
- baths - beds |
show details | |

|
#24
S 6th Ave
Kankakee, IL 60901
|
- sq. feet
|
- baths - beds |
show details | |

|
#25
W Mertens St
Kankakee, IL 60901
|
- sq. feet
|
- baths - beds |
show details | |

|
#26
N 9th Ave
Kankakee, IL 60901
|
- sq. feet
|
- baths - beds |
show details | |

|
#27
N Schuyler Ave Apt 1
Kankakee, IL 60901
|
- sq. feet
|
- baths - beds |
show details | |

|
#28
S Prairie Ave
Bradley, IL 60915
|
- sq. feet
|
- baths - beds |
show details | |

|
#29
Potomac Pl Apt 2
Bourbonnais, IL 60914
|
- sq. feet
|
- baths - beds |
show details | |

|
#30
Lemna Ave Apt 1
Bourbonnais, IL 60914
|
- sq. feet
|
- baths - beds |
show details |
| Photo | Address | Area | Beds / Baths | Price | Details |
|---|---|---|---|---|---|

|
#31
S 4th Ave
Kankakee, IL 60901
|
- sq. feet
|
- baths - beds |
show details | |

|
#32
Trappers Ln
Bourbonnais, IL 60914
|
- sq. feet
|
- baths - beds |
show details | |

|
#33
S 5th Ave
Kankakee, IL 60901
|
- sq. feet
|
- baths - beds |
show details | |

|
#34
Plum Creek Ct Apt B
Bourbonnais, IL 60914
|
- sq. feet
|
- baths - beds |
show details | |

|
#35
Fox Trail Ct
Bourbonnais, IL 60914
|
- sq. feet
|
- baths - beds |
show details | |

|
#36
N Main St
Morocco, IN 47963
|
- sq. feet
|
- baths - beds |
show details | |

|
#37
Maple Ln
Manteno, IL 60950
|
- sq. feet
|
- baths - beds |
show details | |

|
#38
Birch Ct Apt 2
Manteno, IL 60950
|
- sq. feet
|
- baths - beds |
show details | |

|
#39
N Us Highway 41
Lake Village, IN 46349
|
- sq. feet
|
- baths - beds |
show details | |

|
#40
N 200 W
Lake Village, IN 46349
|
- sq. feet
|
- baths - beds |
show details |
| Photo | Address | Area | Beds / Baths | Price | Details |
|---|---|---|---|---|---|

|
#41
Cedar Cir # 122
Manteno, IL 60950
|
- sq. feet
|
- baths - beds |
show details | |

|
#42
E 9160n Rd # 46
Manteno, IL 60950
|
- sq. feet
|
- baths - beds |
show details | |

|
#43
W Taylor St
Grant Park, IL 60940
|
- sq. feet
|
- baths - beds |
show details | |

|
#44
Orchard St
Morocco, IN 47963
|
- sq. feet
|
- baths - beds |
show details | |

|
#45
S Lincoln St
Morocco, IN 47963
|
- sq. feet
|
- baths - beds |
show details | |

|
#46
Saint Pauls Dr
Bourbonnais, IL 60914
|
- sq. feet
|
- baths - beds |
show details | |

|
#47
William R Latham Sr Dr # 3
Bourbonnais, IL 60914
|
- sq. feet
|
- baths - beds |
show details | |

|
#48
Big Chief Dr
Bourbonnais, IL 60914
|
- sq. feet
|
- baths - beds |
show details | |

|
#49
Saint George Dr
Bourbonnais, IL 60914
|
- sq. feet
|
- baths - beds |
show details | |

|
Check over 1 million property listings on Foreclosure.com!
|
browse all offers | |||


 | Looking for info about a specific part of Hazel Crest (8 replies) |
| Narrowing down suburbs (51 replies) |
| Thinking of building in Rual St. Anne. Help. (11 replies) |
| Which locations (distance no object) have plenty of nature and are near train line? (25 replies) |

Median year apartment built: 1962
Household type by relationship:
Households: 1,017- Male householders: 169 (12 living alone), Female householders: 243 (131 living alone)
198 spouses (198 opposite-sex spouses), 21 unmarried partners, (21 opposite-sex unmarried partners), 276 children (274 natural, 0 adopted, 1 stepchildren), 22 grandchildren, 11 brothers or sisters, 3 parents, 0 foster children, 34 other relatives, 33 non-relatives
Size of family households: 111 2-persons, 63 3-persons, 53 4-persons, 33 5-persons.
Size of nonfamily households: 144 1-person, 9 2-persons, 3 3-persons.
75 married couples with children.
68 single-parent households (31 men, 37 women).
92.7% of residents of St. Anne speak English at home.
6.6% of residents speak Spanish at home (63% speak English very well, 17% speak English well, 19% speak English not well).
Foreign born population: 33 (3.2%)
(18.2% of them are naturalized citizens)
| Here: | 7.2 |
| State: | 6.4 |
| Here: | 4.5 |
| State: | 4.1 |

- Bedrooms in owner-occupied houses and condos in St. Anne, Illinois
- 0no bedroom
- 101 bedroom
- 342 bedrooms
- 1443 bedrooms
- 754 bedrooms
- 05+ bedrooms

- Bedrooms in renter-occupied apartments in St. Anne, Illinois
- 0no bedroom
- 381 bedroom
- 462 bedrooms
- 473 bedrooms
- 254 bedrooms
- 05+ bedrooms

- Cars and other vehicles available in St. Anne in owner-occupied houses/condos
- 7no vehicle
- 671 vehicle
- 1002 vehicles
- 613 vehicles
- 174 vehicles
- 115+ vehicles

- Cars and other vehicles available in St. Anne in renter-occupied apartments
- 28no vehicle
- 741 vehicle
- 492 vehicles
- 53 vehicles
- 04 vehicles
- 05+ vehicles

- Rooms in owner-occupied houses in St. Anne, Illinois
- 01 room
- 02 rooms
- 33 rooms
- 124 rooms
- 465 rooms
- 476 rooms
- 597 rooms
- 548 rooms
- 429+ rooms

- Rooms in renter-occupied apartments in St. Anne, Illinois
- 01 room
- 152 rooms
- 163 rooms
- 444 rooms
- 355 rooms
- 66 rooms
- 407 rooms
- 08 rooms
- 09+ rooms


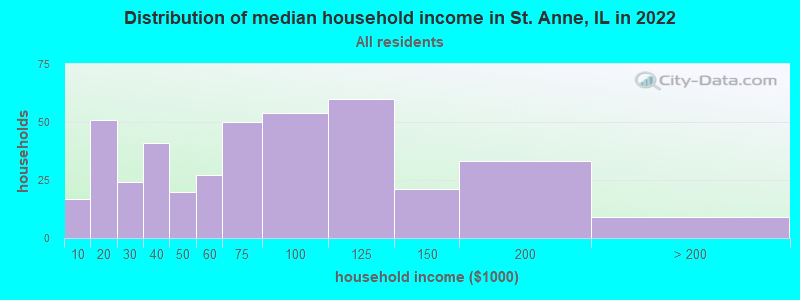
St. Anne, IL household income distribution

- 17Less than $10,000
- 51$10,000 to $19,999
- 24$20,000 to $29,999
- 41$30,000 to $39,999
- 20$40,000 to $49,999
- 27$50,000 to $59,999
- 50$60,000 to $74,999
- 54$75,000 to $99,999
- 60$100,000 to $124,999
- 21$125,000 to $149,999
- 33$150,000 to $199,999
- 9$200,000 or more
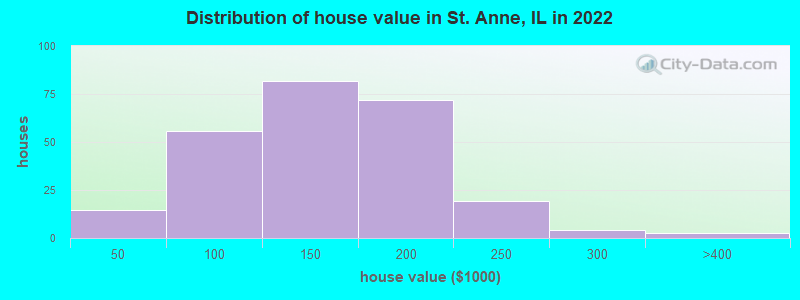
Home value of owner - occupied houses in 2022 in St. Anne, IL
-
- 1$20,000 to $24,999
- 10$35,000 to $39,999
- 3$40,000 to $49,999
- 11$50,000 to $59,999
- 6$60,000 to $69,999
- 12$70,000 to $79,999
- 14$80,000 to $89,999
- 7$90,000 to $99,999
- 49$100,000 to $124,999
- 32$125,000 to $149,999
- 55$150,000 to $174,999
- 16$175,000 to $199,999
- 19$200,000 to $249,999
- 4$250,000 to $299,999
- 2$300,000 to $399,999
Rent paid by renters in 2022 in St. Anne, IL
-
- 2$200 to $249
- 13$250 to $299
- 7$300 to $349
- 7$400 to $449
- 19$450 to $499
- 17$550 to $599
- 11$600 to $649
- 21$650 to $699
- 5$700 to $749
- 11$750 to $799
- 14$1,000 to $1,249
- 10$1,250 to $1,499
- 8No cash rent


Percentage of workers working in this county: 66.4%
Number of people working at home: 47 (10.9% of all workers)
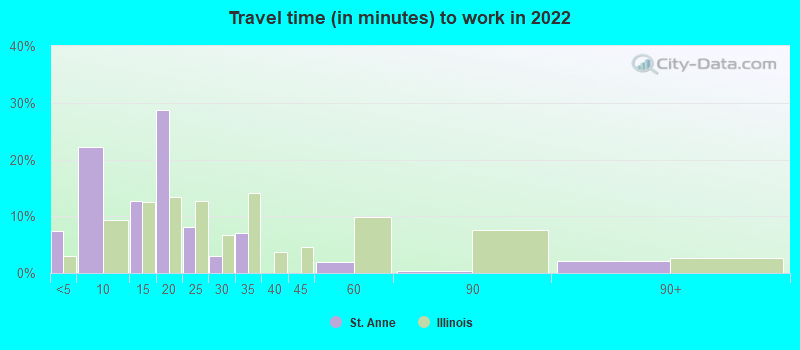
Travel time to work (commute)
- Less than 5 minutes: 18
- 5 to 9 minutes: 28
- 10 to 14 minutes: 8
- 15 to 19 minutes: 40
- 20 to 24 minutes: 83
- 25 to 29 minutes: 39
- 30 to 34 minutes: 53
- 35 to 39 minutes: 4
- 40 to 44 minutes: 16
- 45 to 59 minutes: 23
- 60 to 89 minutes: 28
- 90 or more minutes: 35
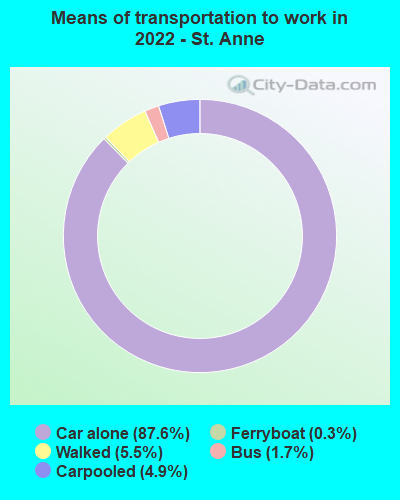
Means of transportation to work:
- Drove a car alone: 300 (78.7%)
- Carpooled: 11 (2.9%)
- Bus: 5 (1.3%)
- Ferryboat: 1 (0.3%)
- Walked: 30 (7.9%)
- Worked at home: 47 (12.3%)

- Unemployment by race in 2022
- Unemployment rate for White non-Hispanic residents
- 12.1%Males
- 10.1%Females

- Year of entry for the foreign-born population in St. Anne, Illinois
- 282010 or later
- 132000 to 2009
- 01990 to 1999
- 51980 to 1989
- 91970 to 1979
- 6Before 1970

First ancestries reported:
- German: 104 (17.4%)
- Irish: 98 (16.4%)
- American: 59 (9.9%)
- English: 47 (7.9%)
- French: 46 (7.7%)
- Italian: 27 (4.5%)
- French Canadian: 9 (1.5%)
- Dutch: 6 (1.0%)
- Scandinavian: 5 (0.8%)
- Israeli: 3 (0.5%)
- European: 2 (0.3%)
- Northern European: 2 (0.3%)
- Polish: 1 (0.2%)
Most common places of birth for foreign-born residents (%):
| St. Anne: | 97.3% (36) |
| Illinois: | 34.7% (626,958) |
Place of birth for U.S.-born residents:
- This state: 829
- Other state: 153
- Northeast: 4
- Midwest: 32
- South: 91
- West: 37
91.0% of St. Anne residents lived in the same house 1 years ago.
Out of people who lived in different houses, 45.8% lived in this county.
Out of people who lived in different counties, 100.0% lived in Illinois.
| St. Anne: | 91.0% |
| State average: | 88.3% |
Education attainment for males 25 years and older:
- No schooling: 3
- Nursery to 4th grade: 11
- 5th and 6th grade: 0
- 7th and 8th grade: 0
- 9th grade: 8
- 10th grade: 7
- 11th grade: 3
- 12th grade, no diploma: 11
- High school graduate (or equivalency): 94
- Less than 1 year of college: 21
- Some college more than 1 year, no degree: 34
- Associate degree: 44
- Bachelor's degree: 20
- Master's degree: 3
- Professional school degree: 8
- Doctorate degree: 8

Education attainment for females 25 years and older:
- No schooling: 5
- Nursery to 4th grade: 5
- 5th and 6th grade: 0
- 7th and 8th grade: 0
- 9th grade: 6
- 10th grade: 1
- 11th grade: 0
- 12th grade, no diploma: 7
- High school graduate (or equivalency): 180
- Less than 1 year of college: 46
- Some college more than 1 year, no degree: 62
- Associate degree: 51
- Bachelor's degree: 34
- Master's degree: 11
- Professional school degree: 0
- Doctorate degree: 0


Housing units in structures:
- One, detached: 410
- One, attached: 10
- Two: 35
- 3 or 4: 7
- 10 to 19: 3
- 20 to 49: 18
- Mobile homes: 4
Housing units lacking complete kitchen facilities in 2022: 4.5%
House/condo owner moved in on average 18 years ago
Renter moved in on average 6 years ago

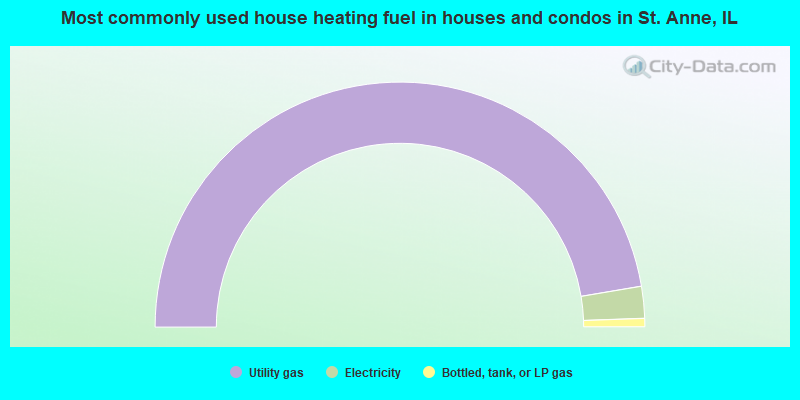
- 94.7%Utility gas
- 4.2%Electricity
- 1.1%Bottled, tank, or LP gas
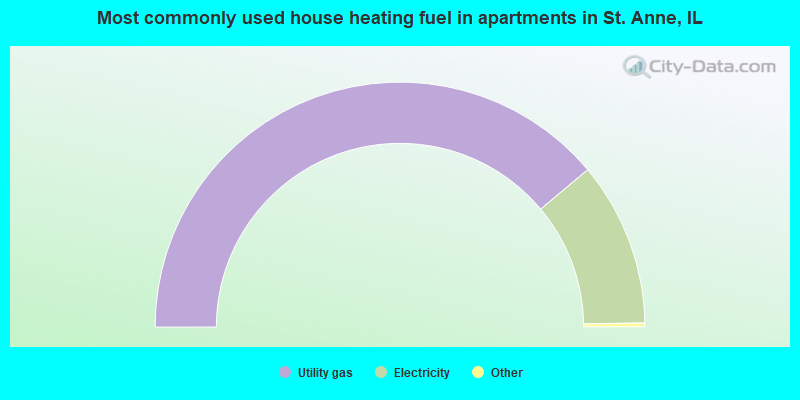
- 78.2%Utility gas
- 21.8%Electricity
Private vs. public school enrollment:
| Here: | 17.8% |
| Illinois: | 13.3% |
| Here: | 17.0% |
| Illinois: | 9.9% |
| Here: | 33.3% |
| Illinois: | 27.4% |


