St. Charles, SC (South Carolina) Houses and Residents
| St. Charles: | $98,898 |
| South Carolina: | $254,600 |
Total population: 1,719 (Urban population: 0, Rural population: 1,646 (45 farm, 1,601 nonfarm))
Houses: 609 (543 occupied: 473 owner occupied, 70 renter occupied)
| % of renters here: | 13% |
| State: | 28% |
Housing density: 13 houses/condos per square mile
Median price asked for vacant for-sale houses and condos in 2022 in this county: $74,356.
Median contract rent in 2022: $533 (lower quartile is $548, upper quartile is $792)
Median rent asked for vacant for-rent units in 2022: $788
Median gross rent in St. Charles, SC in 2022: $824
Housing units in St. Charles with a mortgage: 120 (10 second mortgage, 16 home equity loan, 0 both second mortgage and home equity loan)
Houses without a mortgage: 103


Household type by relationship:
Households: 17,245- In family households: 14,746 (2,313 male householders, 2,254 female householders)
2,551 spouses, 5,256 children (4,941 natural, 141 adopted, 174 stepchildren), 1,078 grandchildren, 288 brothers or sisters, 166 parents, foster children, 393 other relatives, 371 non-relatives
- In nonfamily households: 2,499 (1,061 male householders (928 living alone)), 1,169 female householders (1,065 living alone)), 269 nonrelatives
- In group quarters: 1,975 (1,920 institutionalized population)
2,353 married couples with children.
1,694 single-parent households (220 men, 1,474 women).
93.7% of residents of St. Charles speak English at home.
5.6% of residents speak Spanish at home (86% speak English very well, 14% speak English well).
0.7% of residents speak other Indo-European language at home (100% speak English very well).
| Here: | 6.2 |
| State: | 6.4 |
| Here: | 4.9 |
| State: | 4.5 |

- Bedrooms in owner-occupied houses and condos in St. Charles, South Carolina
- 5no bedroom
- 111 bedroom
- 1102 bedrooms
- 2473 bedrooms
- 1004 bedrooms
- 05+ bedrooms

- Bedrooms in renter-occupied apartments in St. Charles, South Carolina
- 12no bedroom
- 51 bedroom
- 62 bedrooms
- 353 bedrooms
- 124 bedrooms
- 05+ bedrooms

- Cars and other vehicles available in St. Charles in owner-occupied houses/condos
- 80no vehicle
- 1691 vehicle
- 1462 vehicles
- 513 vehicles
- 274 vehicles
- 05+ vehicles

- Cars and other vehicles available in St. Charles in renter-occupied apartments
- 34no vehicle
- 181 vehicle
- 182 vehicles
- 03 vehicles
- 04 vehicles
- 05+ vehicles

- Rooms in owner-occupied houses in St. Charles, South Carolina
- 01 room
- 72 rooms
- 383 rooms
- 774 rooms
- 1415 rooms
- 966 rooms
- 707 rooms
- 388 rooms
- 69+ rooms

- Rooms in renter-occupied apartments in St. Charles, South Carolina
- 01 room
- 122 rooms
- 113 rooms
- 64 rooms
- 235 rooms
- 66 rooms
- 07 rooms
- 128 rooms
- 09+ rooms


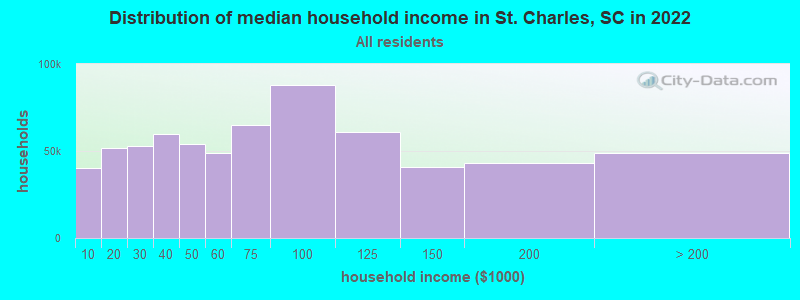
St. Charles, SC household income distribution

- 27,871Less than $10,000
- 42,635$10,000 to $19,999
- 37,296$20,000 to $29,999
- 41,411$30,000 to $39,999
- 38,225$40,000 to $49,999
- 29,855$50,000 to $59,999
- 39,810$60,000 to $74,999
- 52,765$75,000 to $99,999
- 37,232$100,000 to $124,999
- 23,325$125,000 to $149,999
- 23,203$150,000 to $199,999
- 22,876$200,000 or more
Percentage of workers working in this county: 44.2%
Number of people working at home: 43 (7.4% of all workers)
Travel time to work (commute)
- Less than 5 minutes: 8
- 5 to 9 minutes: 23
- 10 to 14 minutes: 40
- 15 to 19 minutes: 78
- 20 to 24 minutes: 79
- 25 to 29 minutes: 25
- 30 to 34 minutes: 87
- 35 to 39 minutes: 23
- 40 to 44 minutes: 14
- 45 to 59 minutes: 85
- 60 to 89 minutes: 26
- 90 or more minutes: 63
Means of transportation to work:
- Drove a car alone: 340 (59.4%)
- Carpooled: 109 (19.1%)
- Bus or trolley bus: 71 (12.4%)
- Taxi: 7 (1.2%)
- Walked: 8 (1.4%)
- Other means: 16 (2.8%)
- Worked at home: 21 (3.7%)
Place of birth for U.S.-born residents:
- This state: 1,438
- Other state: 185
- Northeast: 41
- Midwest: 8
- South: 122
- West: 14
73% of St. Charles residents lived in the same house 5 years ago.
Out of people who lived in different houses, 61% lived in this county.
Out of people who lived in different counties, 70% lived in South Carolina.
Education attainment for males 25 years and older:
- No schooling: 31
- Nursery to 4th grade: 20
- 5th and 6th grade: 25
- 7th and 8th grade: 21
- 9th grade: 33
- 10th grade: 28
- 11th grade: 23
- 12th grade, no diploma: 36
- High school graduate (or equivalency): 143
- Less than 1 year of college: 12
- Some college more than 1 year, no degree: 42
- Associate degree: 17
- Bachelor's degree: 15
- Master's degree: 0
- Professional school degree: 0
- Doctorate degree: 7

Education attainment for females 25 years and older:
- No schooling: 23
- Nursery to 4th grade: 3
- 5th and 6th grade: 33
- 7th and 8th grade: 51
- 9th grade: 57
- 10th grade: 23
- 11th grade: 40
- 12th grade, no diploma: 42
- High school graduate (or equivalency): 163
- Less than 1 year of college: 45
- Some college more than 1 year, no degree: 45
- Associate degree: 10
- Bachelor's degree: 31
- Master's degree: 9
- Professional school degree: 0
- Doctorate degree: 0


Housing units in structures:
- One, detached: 309
- One, attached: 6
- 3 or 4: 6
- Mobile homes: 281
- Boats, RVs, vans, etc.: 7
Median worth of mobile homes: $50,333
Housing units lacking complete kitchen facilities: 3.1%

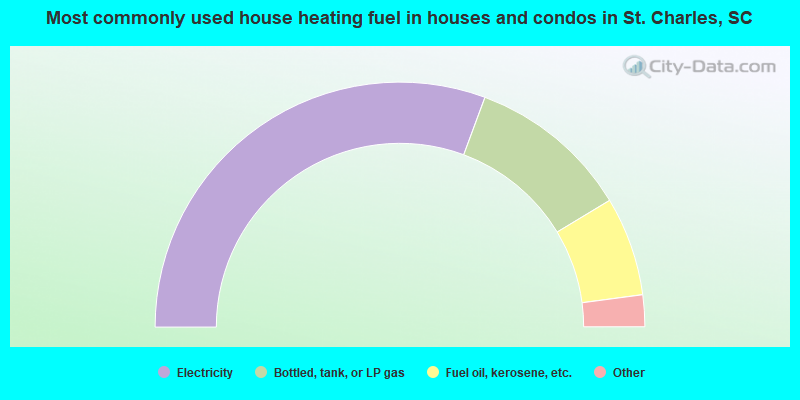
- 61.3%Electricity
- 21.4%Bottled, tank, or LP gas
- 13.1%Fuel oil, kerosene, etc.
- 2.7%No fuel used
- 1.5%Utility gas
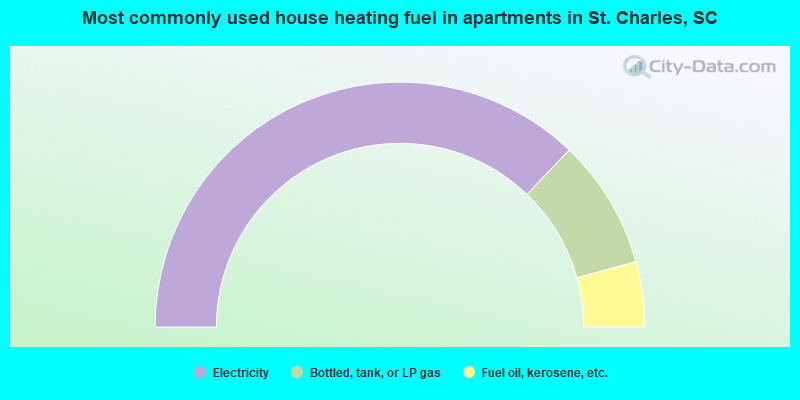
- 74.3%Electricity
- 17.1%Bottled, tank, or LP gas
- 8.6%Fuel oil, kerosene, etc.
Private vs. public school enrollment:
| Here: | 3.2% |
| South Carolina: | 9.2% |
| Here: | 21.1% |
| South Carolina: | 8.1% |
| Here: | 14.8% |
| South Carolina: | 20.3% |


