St. Clair, MO (Missouri) Houses and Residents
| St. Clair: | $143,559 |
| Missouri: | $221,200 |
Total population: 4,701 (Urban population: 4,208 (all inside urban clusters), Rural population: 76 (all nonfarm))
Houses: 2,441 (2,082 occupied: 1,214 owner occupied, 945 renter occupied)
| % of renters here: | 44% |
| State: | 32% |
Housing density: 781 houses/condos per square mile
Median price asked for vacant for-sale houses and condos in 2022: $171,594.
Median contract rent in 2022: $589 (lower quartile is $466, upper quartile is $751)
Median rent asked for vacant for-rent units in 2022: $614
Median gross rent in St. Clair, MO in 2022: $748
Housing units in St. Clair with a mortgage: 746 (0 second mortgage, 0 home equity loan, 0 both second mortgage and home equity loan)
Houses without a mortgage: 0
Median household income for apartments without a mortgage: $29,682
Median monthly housing costs: $835
Compare current foreclosures near St. Clair, MO:
| Photo | Address | Area | Beds / Baths | Price | Details |
|---|---|---|---|---|---|

|
#1
Fair St
Washington, MO 63090
|
1,134 sq. feet
|
1 baths 2 beds |
$59,900
|
show details |

|
#2
Timberland Dr
Sullivan, MO 63080
|
- sq. feet
|
2 baths 3 beds |
$89,900
|
show details |

|
#3
Valley Glenn Dr
Robertsville, MO 63072
|
2,356 sq. feet
|
3 baths 4 beds |
show details | |

|
#4
Meadow Dr
Catawissa, MO 63015
|
1,040 sq. feet
|
1 baths 3 beds |
show details | |

|
#5
Jane Ave
Union, MO 63084
|
1,226 sq. feet
|
2 baths 3 beds |
show details | |

|
#6
W Springfield Rd
Saint Clair, MO 63077
|
1,040 sq. feet
|
1 baths 1 beds |
show details | |

|
#7
Redbud Dr
Lonedell, MO 63060
|
3,089 sq. feet
|
2 baths 3 beds |
show details | |

|
#8
Orchard St
Sullivan, MO 63080
|
597 sq. feet
|
1 baths 1 beds |
show details | |

|
#9
Iron Hill Rd
Union, MO 63084
|
1,390 sq. feet
|
1 baths 4 beds |
show details | |

|
#10
Big Vly
Union, MO 63084
|
1,976 sq. feet
|
2 baths 3 beds |
show details |
| Photo | Address | Area | Beds / Baths | Price | Details |
|---|---|---|---|---|---|

|
#11
Parklane Dr
Saint Clair, MO 63077
|
900 sq. feet
|
1 baths 2 beds |
show details | |

|
#12
Vistaview Dr
Villa Ridge, MO 63089
|
960 sq. feet
|
- baths 3 beds |
show details | |

|
#13
Lindner Ln
Union, MO 63084
|
780 sq. feet
|
1 baths 2 beds |
show details | |

|
#14
Highway Am
Villa Ridge, MO 63089
|
1,240 sq. feet
|
1 baths 3 beds |
show details | |

|
#15
Bridgewater Xing
Villa Ridge, MO 63089
|
1,624 sq. feet
|
3 baths 3 beds |
show details | |

|
#16
Highway Jj
Sullivan, MO 63080
|
1,327 sq. feet
|
2 baths 3 beds |
show details | |

|
#17
N Washington Ave
Union, MO 63084
|
1,100 sq. feet
|
1 baths 2 beds |
show details | |

|
#18
Lighthouse Ct
Villa Ridge, MO 63089
|
1,834 sq. feet
|
3 baths 2 beds |
show details | |

|
#19
Central Ave
Union, MO 63084
|
812 sq. feet
|
1 baths 2 beds |
show details | |

|
#20
Old Highway 100
Villa Ridge, MO 63089
|
1,098 sq. feet
|
1 baths 3 beds |
show details |
| Photo | Address | Area | Beds / Baths | Price | Details |
|---|---|---|---|---|---|

|
#21
W Main St
Union, MO 63084
|
880 sq. feet
|
1 baths 3 beds |
show details | |

|
#22
Missouri Ave
Saint Clair, MO 63077
|
1,104 sq. feet
|
1 baths 3 beds |
show details | |

|
#23
Marilyn Ct
Washington, MO 63090
|
988 sq. feet
|
2 baths 2 beds |
show details | |

|
#24
Rabbit Trail Dr
Washington, MO 63090
|
910 sq. feet
|
2 baths 2 beds |
show details | |

|
#25
Cedar Ledge Dr
Pacific, MO 63069
|
960 sq. feet
|
1 baths 3 beds |
show details | |

|
#26
Pacific Estates Dr
Pacific, MO 63069
|
1,082 sq. feet
|
1 baths 2 beds |
show details | |

|
#27
Rolling Hls
New Haven, MO 63068
|
1,344 sq. feet
|
2 baths 4 beds |
show details | |

|
#28
W Congress St
Pacific, MO 63069
|
1,196 sq. feet
|
2 baths 3 beds |
show details | |

|
#29
Williams St
Washington, MO 63090
|
- sq. feet
|
1 baths 4 beds |
show details | |

|
#30
Cedar Dr
Pacific, MO 63069
|
1,080 sq. feet
|
1 baths 3 beds |
show details |
| Photo | Address | Area | Beds / Baths | Price | Details |
|---|---|---|---|---|---|

|
#31
Pat St
Sullivan, MO 63080
|
1,248 sq. feet
|
1 baths 3 beds |
show details | |

|
#32
Dalton Ct
Pacific, MO 63069
|
1,276 sq. feet
|
1 baths 3 beds |
show details | |

|
#33
Highway Mm
Gray Summit, MO 63039
|
1,152 sq. feet
|
1 baths 3 beds |
show details | |

|
#34
Highway D
Bourbon, MO 65441
|
- sq. feet
|
- baths - beds |
$89,700
|
show details |

|
#35
Maple St
Sullivan, MO 63080
|
1,272 sq. feet
|
1 baths 3 beds |
show details | |

|
#36
E Lane Dr
Washington, MO 63090
|
1,183 sq. feet
|
1 baths 3 beds |
show details | |

|
#37
E Lane Dr
Washington, MO 63090
|
1,183 sq. feet
|
1 baths 3 beds |
show details | |

|
#38
International Ave
Washington, MO 63090
|
1,176 sq. feet
|
1 baths 3 beds |
show details | |

|
#39
E Vine St
Sullivan, MO 63080
|
1,873 sq. feet
|
1 baths 3 beds |
show details | |

|
#40
Rock Island Dr
Union, MO 63084
|
910 sq. feet
|
3 baths 3 beds |
show details |
| Photo | Address | Area | Beds / Baths | Price | Details |
|---|---|---|---|---|---|

|
#41
Wildwood Ter
Sullivan, MO 63080
|
988 sq. feet
|
2 baths 4 beds |
show details | |

|
#42
Highway K
Saint Clair, MO 63077
|
1,656 sq. feet
|
1 baths 2 beds |
show details | |

|
#43
Runway Dr
Saint Clair, MO 63077
|
2,994 sq. feet
|
4 baths 4 beds |
show details | |

|
#44
Brookmoore
Union, MO 63084
|
1,318 sq. feet
|
2 baths 3 beds |
show details | |

|
#45
Sullivan Bottom Rd
Saint Clair, MO 63077
|
1,120 sq. feet
|
2 baths 2 beds |
show details | |

|
#46
Denmark Rd
Union, MO 63084
|
2,156 sq. feet
|
4 baths 3 beds |
show details | |

|
#47
N Bend Rd
Union, MO 63084
|
2,512 sq. feet
|
2 baths 3 beds |
show details | |

|
#48
Porterford Rd
Union, MO 63084
|
1,120 sq. feet
|
1 baths 3 beds |
show details | |

|
#49
Saint Louis Inn Rd
Saint Clair, MO 63077
|
1,872 sq. feet
|
1 baths 3 beds |
show details | |

|
Check over 1 million property listings on Foreclosure.com!
|
browse all offers | |||


 | Purina Farms - Grey Summit (where to stay/eat) (3 replies) |
| Nordstrom moving from Oak Park Mall to the Plaza (79 replies) |
| memories of the 1982 World Series against the Milwaukee Brewers (2 replies) |
| Missouri Outlaw History (3407 replies) |
| Total outsider want to move to small city in Missouri, where do you suggest? (35 replies) |
| Interesting Missouri facts. (1186 replies) |

Median year apartment built: 1974
Household type by relationship:
Households: 4,817- Male householders: 1,193 (249 living alone), Female householders: 873 (422 living alone)
762 spouses (749 opposite-sex spouses), 239 unmarried partners, (222 opposite-sex unmarried partners), 1,207 children (1,096 natural, 0 adopted, 111 stepchildren), 72 grandchildren, 65 brothers or sisters, 63 parents, 0 foster children, 154 other relatives, 105 non-relatives
- In group quarters: 79
Size of family households: 590 2-persons, 307 3-persons, 270 4-persons, 96 5-persons, 18 6-persons.
Size of nonfamily households: 661 1-person, 179 2-persons.
593 married couples with children.
257 single-parent households (91 men, 166 women).
99.5% of residents of St. Clair speak English at home.
0.3% of residents speak Asian or Pacific Island language at home (100% speak English very well).
0.1% of residents speak other language at home (100% speak English very well).
Foreign born population: 180 (3.7%)
(6.7% of them are naturalized citizens)
| Here: | 5.9 |
| State: | 6.4 |
| Here: | 3.9 |
| State: | 4.4 |

- Bedrooms in owner-occupied houses and condos in St. Clair, Missouri
- 0no bedroom
- 741 bedroom
- 2402 bedrooms
- 4883 bedrooms
- 3604 bedrooms
- 545+ bedrooms

- Bedrooms in renter-occupied apartments in St. Clair, Missouri
- 13no bedroom
- 4001 bedroom
- 3862 bedrooms
- 1473 bedrooms
- 04 bedrooms
- 05+ bedrooms

- Cars and other vehicles available in St. Clair in owner-occupied houses/condos
- 30no vehicle
- 2411 vehicle
- 4532 vehicles
- 4363 vehicles
- 434 vehicles
- 135+ vehicles

- Cars and other vehicles available in St. Clair in renter-occupied apartments
- 138no vehicle
- 4401 vehicle
- 3202 vehicles
- 83 vehicles
- 204 vehicles
- 195+ vehicles

- Rooms in owner-occupied houses in St. Clair, Missouri
- 01 room
- 02 rooms
- 843 rooms
- 2424 rooms
- 1545 rooms
- 2366 rooms
- 1137 rooms
- 88 rooms
- 3779+ rooms

- Rooms in renter-occupied apartments in St. Clair, Missouri
- 131 room
- 1742 rooms
- 1613 rooms
- 3864 rooms
- 1155 rooms
- 386 rooms
- 357 rooms
- 238 rooms
- 09+ rooms


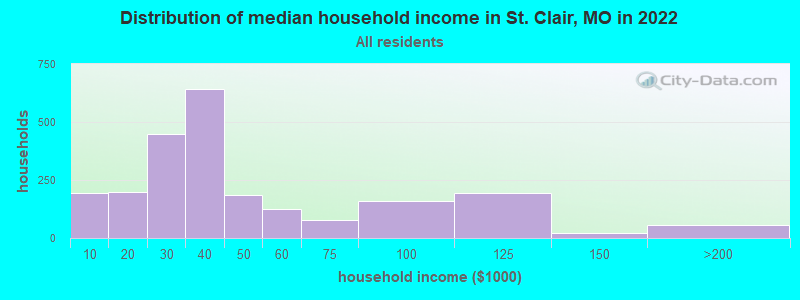
St. Clair, MO household income distribution

- 194Less than $10,000
- 198$10,000 to $19,999
- 450$20,000 to $29,999
- 643$30,000 to $39,999
- 184$40,000 to $49,999
- 126$50,000 to $59,999
- 76$60,000 to $74,999
- 161$75,000 to $99,999
- 194$100,000 to $124,999
- 22$125,000 to $149,999
- 44$150,000 to $199,999
- 10$200,000 or more
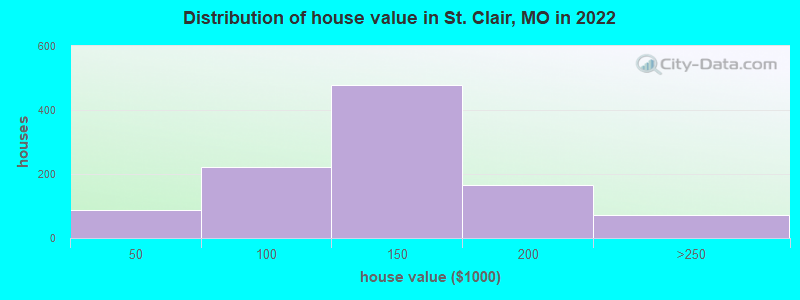
Home value of owner - occupied houses in 2022 in St. Clair, MO
-
- 27Less than $10,000
- 21$10,000 to $14,999
- 23$15,000 to $19,999
- 14$40,000 to $49,999
- 45$50,000 to $59,999
- 111$70,000 to $79,999
- 42$80,000 to $89,999
- 10$90,000 to $99,999
- 122$100,000 to $124,999
- 354$125,000 to $149,999
- 108$150,000 to $174,999
- 56$175,000 to $199,999
- 72$200,000 to $249,999
Rent paid by renters in 2022 in St. Clair, MO
-
- 5$200 to $249
- 16$250 to $299
- 56$350 to $399
- 83$400 to $449
- 68$450 to $499
- 199$500 to $549
- 260$600 to $649
- 12$650 to $699
- 28$700 to $749
- 104$750 to $799
- 92$800 to $899
- 13$1,000 to $1,249
- 31$1,250 to $1,499


Percentage of workers working in this county: 82.4%
Number of people working at home: 105 (5.5% of all workers)
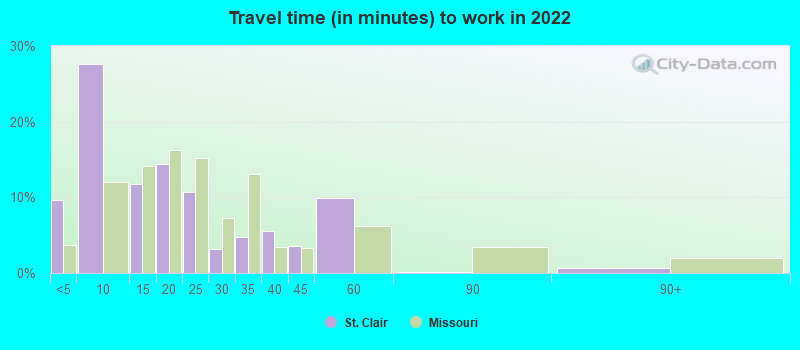
Travel time to work (commute)
- Less than 5 minutes: 175
- 5 to 9 minutes: 461
- 10 to 14 minutes: 99
- 15 to 19 minutes: 343
- 20 to 24 minutes: 266
- 25 to 29 minutes: 105
- 30 to 34 minutes: 107
- 35 to 39 minutes: 49
- 40 to 44 minutes: 34
- 45 to 59 minutes: 79
- 60 to 89 minutes: 149
- 90 or more minutes: 0
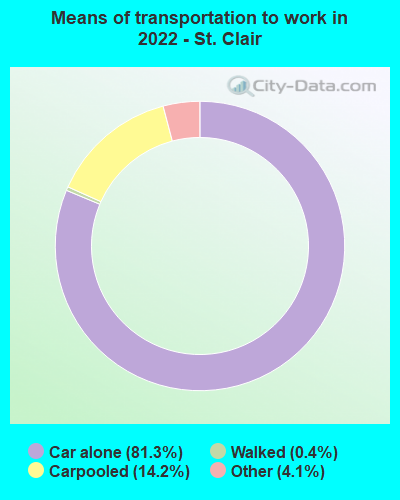
Means of transportation to work:
- Drove a car alone: 1,647 (75.8%)
- Carpooled: 290 (13.3%)
- Taxi: 85 (3.9%)
- Walked: 7 (0.3%)
- Worked at home: 105 (4.8%)

- Unemployment by race in 2022
- Unemployment rate for White non-Hispanic residents
- 10.3%Males
- 9.8%Females

- Year of entry for the foreign-born population in St. Clair, Missouri
- 32010 or later
- 112000 to 2009
- 01990 to 1999
- 91980 to 1989
- 01970 to 1979
- 23Before 1970

First ancestries reported:
- American: 415 (32.8%)
- German: 251 (19.9%)
- English: 197 (15.6%)
- Irish: 135 (10.7%)
- Scottish: 63 (5.0%)
- European: 40 (3.2%)
- French: 28 (2.2%)
- Polish: 12 (0.9%)
Most common places of birth for foreign-born residents (%):
| St. Clair: | 98.5% (265) |
| Missouri: | 3.0% (7,803) |
| St. Clair: | 5.6% (15) |
| Missouri: | 2.8% (7,146) |
Place of birth for U.S.-born residents:
- This state: 3,360
- Other state: 1,199
- Northeast: 48
- Midwest: 488
- South: 533
- West: 111
89.2% of St. Clair residents lived in the same house 1 years ago.
Out of people who lived in different houses, 28.6% lived in this county.
Out of people who lived in different counties, 51.4% lived in Missouri.
| St. Clair: | 89.2% |
| State average: | 87.1% |
Education attainment for males 25 years and older:
- No schooling: 9
- Nursery to 4th grade: 0
- 5th and 6th grade: 0
- 7th and 8th grade: 0
- 9th grade: 19
- 10th grade: 122
- 11th grade: 0
- 12th grade, no diploma: 46
- High school graduate (or equivalency): 987
- Less than 1 year of college: 102
- Some college more than 1 year, no degree: 115
- Associate degree: 99
- Bachelor's degree: 42
- Master's degree: 0
- Professional school degree: 7
- Doctorate degree: 0

Education attainment for females 25 years and older:
- No schooling: 25
- Nursery to 4th grade: 0
- 5th and 6th grade: 0
- 7th and 8th grade: 100
- 9th grade: 204
- 10th grade: 29
- 11th grade: 44
- 12th grade, no diploma: 8
- High school graduate (or equivalency): 631
- Less than 1 year of college: 238
- Some college more than 1 year, no degree: 325
- Associate degree: 194
- Bachelor's degree: 117
- Master's degree: 15
- Professional school degree: 0
- Doctorate degree: 0


Housing units in structures:
- One, detached: 1,496
- One, attached: 43
- Two: 103
- 3 or 4: 113
- 5 to 9: 132
- 10 to 19: 202
- 20 to 49: 18
- 50 or more: 90
- Mobile homes: 240
Housing units lacking complete kitchen facilities in 2022: 6.8%
House/condo owner moved in on average 5 years ago
Renter moved in on average 2 years ago

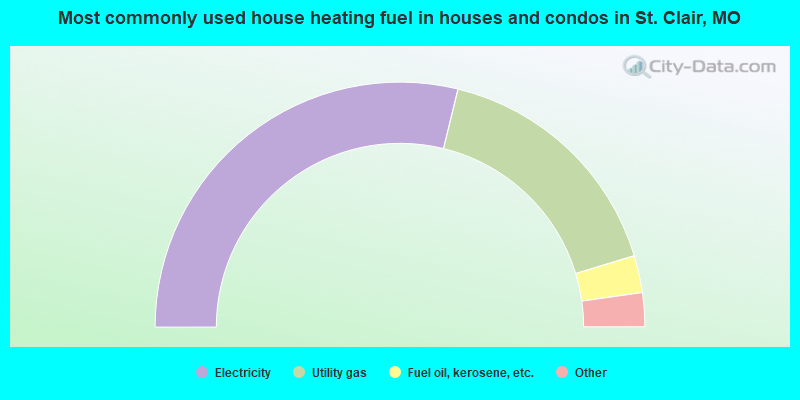
- 57.7%Electricity
- 33.0%Utility gas
- 4.9%Fuel oil, kerosene, etc.
- 3.4%Bottled, tank, or LP gas
- 1.0%Solar energy
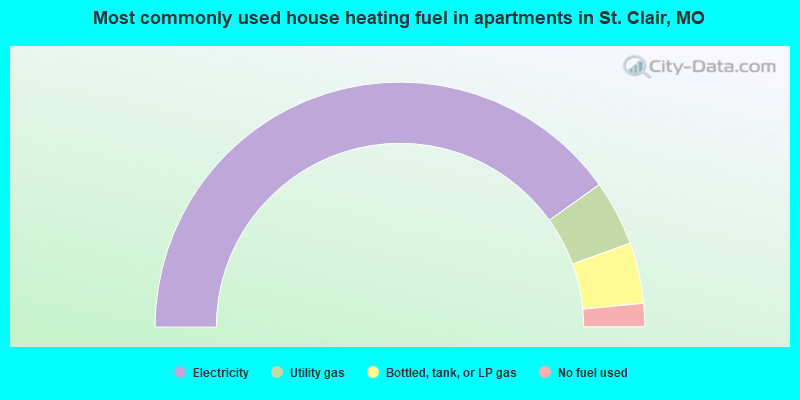
- 80.2%Electricity
- 8.6%Utility gas
- 8.0%Bottled, tank, or LP gas
- 3.1%No fuel used
Private vs. public school enrollment:
| Here: | 4.1% |
| Missouri: | 15.4% |
| Here: | 0.0% |
| Missouri: | 13.9% |
| Here: | 36.3% |
| Missouri: | 22.6% |


