St. Clair, PA (Pennsylvania) Houses and Residents
| St. Clair: | $79,215 |
| Pennsylvania: | $245,500 |
Mean price in 2022:
Detached houses: $111,125
Here: $111,125 State: $317,202 Townhouses or other attached units: $53,169
Here: $53,169 State: $254,369
Total population: 2,923 (All urban)
Houses: 1,573 (1,226 occupied: 970 owner occupied, 283 renter occupied)
| % of renters here: | 23% |
| State: | 31% |
Housing density: 1,287 houses/condos per square mile
Median price asked for vacant for-sale houses and condos in 2022 in this county: $77,403.
Median contract rent in 2022: $707 (lower quartile is $653, upper quartile is $818)
Median rent asked for vacant for-rent units in 2022: $675
Median gross rent in St. Clair, PA in 2022: $849
Housing units in St. Clair with a mortgage: 363 (33 second mortgage, 0 home equity loan, 35 both second mortgage and home equity loan)
Houses without a mortgage: 32
Median household income for houses/condos with a mortgage: $62,140
Median household income for apartments without a mortgage: $68,991
Median monthly housing costs: $633
Compare current foreclosures near St. Clair, PA:
| Photo | Address | Area | Beds / Baths | Price | Details |
|---|---|---|---|---|---|

|
#1
1st St
Coaldale, PA 18218
|
1,519 sq. feet
|
1 baths 2 beds |
$3,066
|
show details |

|
#2
S Margaretta St
Schuylkill Haven, PA 17972
|
1,264 sq. feet
|
1 baths 3 beds |
$114,614
|
show details |

|
#3
S Lehigh Ave
Frackville, PA 17931
|
1,696 sq. feet
|
1 baths 3 beds |
$67,664
|
show details |

|
#4
S 2nd St
Frackville, PA 17931
|
1,260 sq. feet
|
1 baths 3 beds |
$13,246
|
show details |

|
#5
E Saylor St
Mount Carmel, PA 17851
|
- sq. feet
|
1 baths 2 beds |
$34,900
|
show details |

|
#6
Hazle St
Tamaqua, PA 18252
|
1,576 sq. feet
|
1 baths 3 beds |
$69,864
|
show details |

|
#7
Market St
Tamaqua, PA 18252
|
1,265 sq. feet
|
1 baths 3 beds |
$63,376
|
show details |

|
#8
Pottsville St
Cressona, PA 17929
|
1,308 sq. feet
|
1 baths 3 beds |
$108,472
|
show details |

|
#9
Orwigsburg St
Tamaqua, PA 18252
|
1,455 sq. feet
|
1 baths 3 beds |
$47,280
|
show details |

|
#10
W Laurel St
Tremont, PA 17981
|
1,065 sq. feet
|
1 baths 2 beds |
$3,132
|
show details |
| Photo | Address | Area | Beds / Baths | Price | Details |
|---|---|---|---|---|---|

|
#11
Graeff St
Cressona, PA 17929
|
1,176 sq. feet
|
1 baths 2 beds |
$94,435
|
show details |

|
#12
North St
Minersville, PA 17954
|
1,479 sq. feet
|
1 baths 4 beds |
$49,885
|
show details |

|
#13
Golf Rd
Barnesville, PA 18214
|
1,440 sq. feet
|
1 baths 2 beds |
$3,893
|
show details |

|
#14
Parkway
Schuylkill Haven, PA 17972
|
1,428 sq. feet
|
1 baths 3 beds |
$85,871
|
show details |

|
#15
Hotel Ln
Barnesville, PA 18214
|
1,316 sq. feet
|
1 baths 3 beds |
$140,761
|
show details |

|
#16
E Liberty St
Schuylkill Haven, PA 17972
|
1,176 sq. feet
|
1 baths 3 beds |
$106,662
|
show details |

|
#17
Chestnut Rd
Orwigsburg, PA 17961
|
1,674 sq. feet
|
1 baths 3 beds |
$4,256
|
show details |

|
#18
W Spruce St
Mahanoy City, PA 17948
|
1,408 sq. feet
|
1 baths 4 beds |
$35,163
|
show details |

|
#19
Grey Hawk Dr
Orwigsburg, PA 17961
|
2,240 sq. feet
|
2 baths 3 beds |
$266,560
|
show details |

|
#20
W Mount Vernon St
Shenandoah, PA 17976
|
900 sq. feet
|
1 baths 2 beds |
$6,216
|
show details |
| Photo | Address | Area | Beds / Baths | Price | Details |
|---|---|---|---|---|---|

|
#21
Lytle St
Minersville, PA 17954
|
1,970 sq. feet
|
1 baths 3 beds |
$37,137
|
show details |

|
#22
Virginia Ave
Shenandoah, PA 17976
|
1,311 sq. feet
|
1 baths 3 beds |
$6,313
|
show details |

|
#23
Penn St
Minersville, PA 17954
|
1,798 sq. feet
|
1 baths 5 beds |
$53,453
|
show details |

|
#24
Mill Street
Saint Clair, PA 17970
|
1,419 sq. feet
|
1 baths 3 beds |
$93,483
|
show details |

|
#25
Arnots
Saint Clair, PA 17970
|
1,718 sq. feet
|
1 baths 5 beds |
$3,002
|
show details |

|
#26
Ann St
Pottsville, PA 17901
|
1,512 sq. feet
|
2 baths 3 beds |
$3,333
|
show details |

|
#27
Broad St
Saint Clair, PA 17970
|
1,536 sq. feet
|
1 baths 2 beds |
show details | |

|
#28
W Church St
Orwigsburg, PA 17961
|
1,620 sq. feet
|
1 baths 3 beds |
show details | |

|
#29
Reichwein Road
Lavelle, PA 17943
|
3,563 sq. feet
|
4 baths 3 beds |
show details | |

|
#30
Laurel Rd
Orwigsburg, PA 17961
|
1,591 sq. feet
|
2 baths 3 beds |
show details |
| Photo | Address | Area | Beds / Baths | Price | Details |
|---|---|---|---|---|---|

|
#31
W Columbia St
Schuylkill Haven, PA 17972
|
1,129 sq. feet
|
1 baths 2 beds |
show details | |

|
#32
Washington Street
Auburn, PA 17922
|
1,526 sq. feet
|
1 baths 2 beds |
show details | |

|
#33
George St
Pottsville, PA 17901
|
1,520 sq. feet
|
1 baths 2 beds |
show details | |

|
#34
Grove St
Cressona, PA 17929
|
2,202 sq. feet
|
2 baths 5 beds |
show details | |

|
#35
Willow St
Schuylkill Haven, PA 17972
|
1,316 sq. feet
|
1 baths 3 beds |
show details | |

|
#36
Comanche Dr
Auburn, PA 17922
|
2,177 sq. feet
|
2 baths 3 beds |
show details | |

|
#37
E Phillips St
Coaldale, PA 18218
|
1,281 sq. feet
|
1 baths 2 beds |
show details | |

|
#38
W Race St
Pottsville, PA 17901
|
1,872 sq. feet
|
1 baths 3 beds |
show details | |

|
#39
Hatchet Cv
Auburn, PA 17922
|
1,260 sq. feet
|
2 baths 4 beds |
show details | |

|
#40
N 4th St
Hamburg, PA 19526
|
1,320 sq. feet
|
1 baths 3 beds |
show details |
| Photo | Address | Area | Beds / Baths | Price | Details |
|---|---|---|---|---|---|

|
#41
Pleasant Valley Rd
Pine Grove, PA 17963
|
2,080 sq. feet
|
1 baths 4 beds |
show details | |

|
#42
Saint Ann St
Barnesville, PA 18214
|
1,312 sq. feet
|
1 baths 3 beds |
show details | |

|
#43
Walnut St
Ashland, PA 17921
|
1,512 sq. feet
|
2 baths 3 beds |
show details | |

|
#44
N Garfield Ave
Schuylkill Haven, PA 17972
|
904 sq. feet
|
1 baths 2 beds |
show details | |

|
#45
W End Ave
Pottsville, PA 17901
|
1,536 sq. feet
|
2 baths 3 beds |
show details | |

|
#46
S Mill St
Saint Clair, PA 17970
|
1,419 sq. feet
|
1 baths 3 beds |
show details | |

|
#47
Washington St
Middleport, PA 17953
|
- sq. feet
|
1 baths 2 beds |
show details | |

|
#48
Grant St
Pottsville, PA 17901
|
1,984 sq. feet
|
1 baths 3 beds |
show details | |

|
#49
Walnut St
Ashland, PA 17921
|
1,261 sq. feet
|
1 baths 3 beds |
show details | |

|
Check over 1 million property listings on Foreclosure.com!
|
browse all offers | |||


 | Pittsburgh's average apartment asking rent now above $900 (101 replies) |
| 1st time home buyer in Upper St. Clair -- what are the best and worst areas?! (19 replies) |
| Relocating in summer, neighborhood and school help (29 replies) |
| Relocation: Upper St. Clair or Mount Lebanon? (126 replies) |
| Choosing between Pittsburgh and Philly (22 replies) |
| Neighborhood of the week: St. Clair (7 replies) |

Median year apartment built: 1951
Household type by relationship:
Households: 2,763- Male householders: 666 (157 living alone), Female householders: 559 (176 living alone)
419 spouses (419 opposite-sex spouses), 193 unmarried partners, (193 opposite-sex unmarried partners), 590 children (578 natural, 0 adopted, 11 stepchildren), 66 grandchildren, 36 brothers or sisters, 67 parents, 0 foster children, 27 other relatives, 127 non-relatives
- In group quarters: 4
Size of family households: 414 2-persons, 157 3-persons, 142 4-persons, 26 5-persons, 6 6-persons, 7 7-or-more-persons.
Size of nonfamily households: 313 1-person, 178 2-persons, 3 3-persons.
153 married couples with children.
159 single-parent households (38 men, 121 women).
97.4% of residents of St. Clair speak English at home.
2.2% of residents speak Spanish at home (100% speak English very well).
Foreign born population: 26 (0.9%)
(65.4% of them are naturalized citizens)
| Here: | 6.8 |
| State: | 6.8 |
| Here: | 6.3 |
| State: | 4.3 |

- Bedrooms in owner-occupied houses and condos in St. Clair, Pennsylvania
- 0no bedroom
- 01 bedroom
- 2242 bedrooms
- 6443 bedrooms
- 864 bedrooms
- 175+ bedrooms

- Bedrooms in renter-occupied apartments in St. Clair, Pennsylvania
- 0no bedroom
- 431 bedroom
- 1072 bedrooms
- 1063 bedrooms
- 274 bedrooms
- 05+ bedrooms

- Cars and other vehicles available in St. Clair in owner-occupied houses/condos
- 82no vehicle
- 3811 vehicle
- 3322 vehicles
- 1253 vehicles
- 224 vehicles
- 295+ vehicles

- Cars and other vehicles available in St. Clair in renter-occupied apartments
- 87no vehicle
- 1421 vehicle
- 212 vehicles
- 143 vehicles
- 04 vehicles
- 185+ vehicles

- Rooms in owner-occupied houses in St. Clair, Pennsylvania
- 01 room
- 02 rooms
- 03 rooms
- 314 rooms
- 935 rooms
- 3386 rooms
- 1527 rooms
- 738 rooms
- 2849+ rooms

- Rooms in renter-occupied apartments in St. Clair, Pennsylvania
- 01 room
- 02 rooms
- 213 rooms
- 594 rooms
- 465 rooms
- 986 rooms
- 277 rooms
- 228 rooms
- 99+ rooms


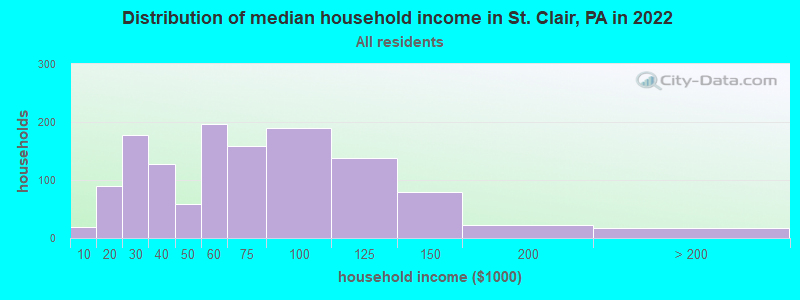
St. Clair, PA household income distribution

- 19Less than $10,000
- 90$10,000 to $19,999
- 178$20,000 to $29,999
- 127$30,000 to $39,999
- 58$40,000 to $49,999
- 196$50,000 to $59,999
- 159$60,000 to $74,999
- 190$75,000 to $99,999
- 138$100,000 to $124,999
- 80$125,000 to $149,999
- 23$150,000 to $199,999
- 18$200,000 or more
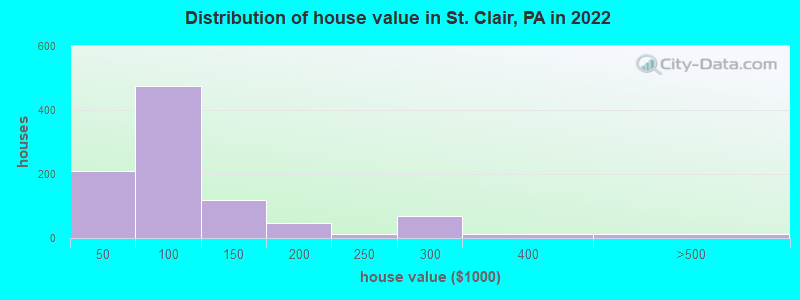
Home value of owner - occupied houses in 2022 in St. Clair, PA
-
- 5Less than $10,000
- 4$10,000 to $14,999
- 22$20,000 to $24,999
- 4$25,000 to $29,999
- 40$30,000 to $34,999
- 73$35,000 to $39,999
- 58$40,000 to $49,999
- 132$50,000 to $59,999
- 77$60,000 to $69,999
- 92$70,000 to $79,999
- 45$80,000 to $89,999
- 69$90,000 to $99,999
- 109$100,000 to $124,999
- 9$125,000 to $149,999
- 30$150,000 to $174,999
- 16$175,000 to $199,999
- 13$200,000 to $249,999
- 68$250,000 to $299,999
- 11$300,000 to $399,999
- 12$400,000 to $499,999
Rent paid by renters in 2022 in St. Clair, PA
-
- 16$250 to $299
- 16$400 to $449
- 30$600 to $649
- 34$650 to $699
- 16$700 to $749
- 39$750 to $799
- 9$800 to $899
- 11$900 to $999
- 44$1,500 to $1,999
- 36No cash rent


Percentage of workers working in this county: 80.9%
Number of people working at home: 65 (4.6% of all workers)
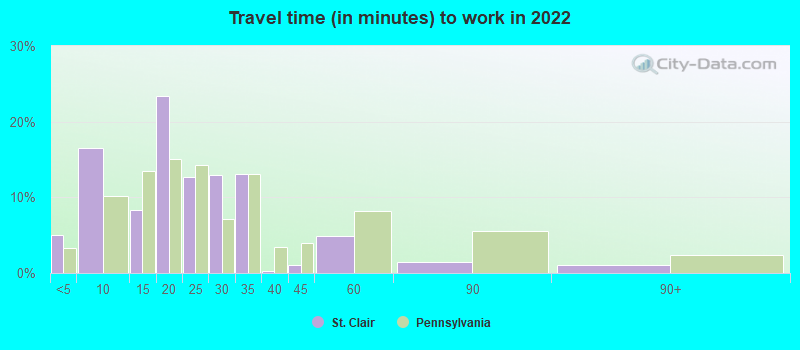
Travel time to work (commute)
- Less than 5 minutes: 75
- 5 to 9 minutes: 184
- 10 to 14 minutes: 132
- 15 to 19 minutes: 381
- 20 to 24 minutes: 159
- 25 to 29 minutes: 45
- 30 to 34 minutes: 103
- 35 to 39 minutes: 39
- 40 to 44 minutes: 58
- 45 to 59 minutes: 77
- 60 to 89 minutes: 72
- 90 or more minutes: 52
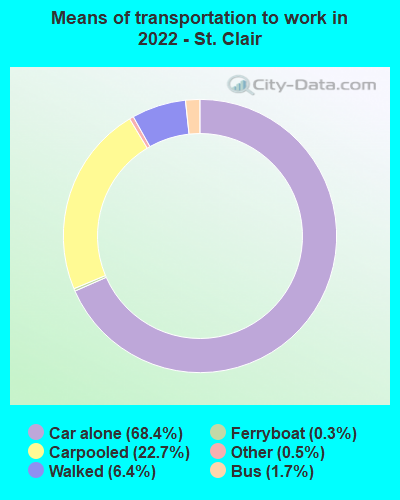
Means of transportation to work:
- Drove a car alone: 1,066 (65.2%)
- Carpooled: 386 (23.6%)
- Bus: 45 (2.8%)
- Ferryboat: 6 (0.4%)
- Taxi: 5 (0.3%)
- Walked: 83 (5.1%)
- Worked at home: 64 (3.9%)

- Unemployment by race in 2022
- Unemployment rate for White non-Hispanic residents
- 0.9%Males
- 1.2%Females

- Year of entry for the foreign-born population in St. Clair, Pennsylvania
- 02010 or later
- 02000 to 2009
- 111990 to 1999
- 01980 to 1989
- 01970 to 1979
- 25Before 1970

First ancestries reported:
- German: 200 (20.4%)
- Polish: 94 (9.6%)
- Lithuanian: 90 (9.2%)
- English: 76 (7.8%)
- Italian: 69 (7.0%)
- Slovak: 63 (6.4%)
- Eastern European: 43 (4.4%)
- Ukrainian: 41 (4.2%)
- Welsh: 40 (4.1%)
- American: 31 (3.2%)
- Irish: 31 (3.2%)
- Carpatho Rusyn: 26 (2.7%)
- European: 26 (2.7%)
- Lebanese: 17 (1.7%)
- Macedonian: 13 (1.3%)
- Dutch: 12 (1.2%)
- Hungarian: 11 (1.1%)
- Russian: 5 (0.5%)
Most common places of birth for foreign-born residents (%):
| St. Clair: | 32.1% (9) |
| Pennsylvania: | 1.5% (13,823) |
| St. Clair: | 28.6% (8) |
| Pennsylvania: | 0.0% (290) |
Place of birth for U.S.-born residents:
- This state: 2,553
- Other state: 142
- Northeast: 34
- Midwest: 28
- South: 39
- West: 33
94.0% of St. Clair residents lived in the same house 1 years ago.
Out of people who lived in different houses, 48.2% lived in this county.
Out of people who lived in different counties, 100.0% lived in Pennsylvania.
| St. Clair: | 94.0% |
| State average: | 89.3% |
Education attainment for males 25 years and older:
- No schooling: 14
- Nursery to 4th grade: 0
- 5th and 6th grade: 0
- 7th and 8th grade: 7
- 9th grade: 0
- 10th grade: 6
- 11th grade: 4
- 12th grade, no diploma: 22
- High school graduate (or equivalency): 521
- Less than 1 year of college: 60
- Some college more than 1 year, no degree: 73
- Associate degree: 90
- Bachelor's degree: 214
- Master's degree: 17
- Professional school degree: 0
- Doctorate degree: 0

Education attainment for females 25 years and older:
- No schooling: 0
- Nursery to 4th grade: 0
- 5th and 6th grade: 0
- 7th and 8th grade: 12
- 9th grade: 0
- 10th grade: 0
- 11th grade: 35
- 12th grade, no diploma: 51
- High school graduate (or equivalency): 544
- Less than 1 year of college: 67
- Some college more than 1 year, no degree: 132
- Associate degree: 107
- Bachelor's degree: 88
- Master's degree: 44
- Professional school degree: 13
- Doctorate degree: 0


Housing units in structures:
- One, detached: 713
- One, attached: 680
- Two: 40
- 3 or 4: 90
- 5 to 9: 10
- 10 to 19: 7
- 20 to 49: 27
Housing units lacking complete kitchen facilities in 2022: 4.6%
House/condo owner moved in on average 20 years ago
Renter moved in on average 7 years ago

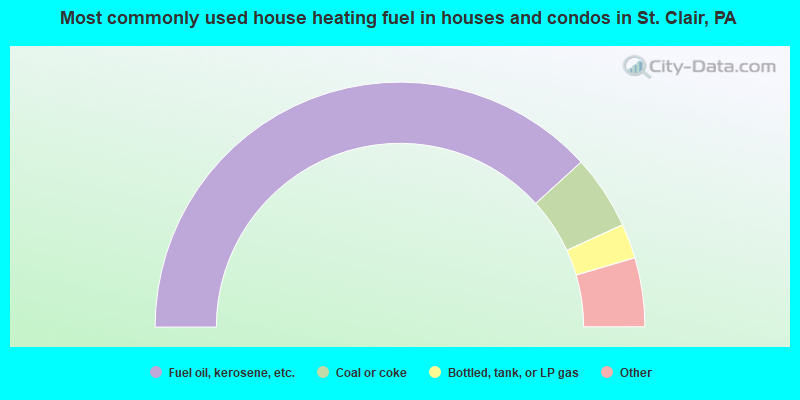
- 76.6%Fuel oil, kerosene, etc.
- 9.8%Coal or coke
- 4.6%Bottled, tank, or LP gas
- 3.6%Utility gas
- 2.3%No fuel used
- 1.8%Electricity
- 1.3%Other fuel
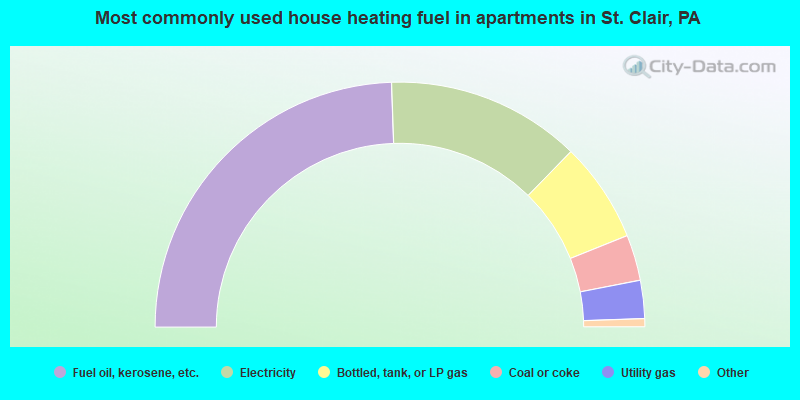
- 49.5%Fuel oil, kerosene, etc.
- 26.0%Electricity
- 13.4%Bottled, tank, or LP gas
- 6.1%Coal or coke
- 5.1%Utility gas
Private vs. public school enrollment:
| Here: | 6.3% |
| Pennsylvania: | 15.7% |
| Here: | 0.0% |
| Pennsylvania: | 13.4% |
| Here: | 0.0% |
| Pennsylvania: | 39.8% |


