St. David, IL (Illinois) Houses and Residents
| St. David: | $64,820 |
| Illinois: | $251,600 |
Total population: 563 (Urban population: 0, Rural population: 605 (7 farm, 598 nonfarm))
Houses: 285 (244 occupied: 237 owner occupied, 10 renter occupied)
| % of renters here: | 4% |
| State: | 33% |
Housing density: 962 houses/condos per square mile
Median price asked for vacant for-sale houses and condos in 2022: $201,803.
Median contract rent in 2022: $487
Median gross rent in St. David, IL in 2022: $818
Housing units in St. David with a mortgage: 84 (1 second mortgage, 0 home equity loan, 0 both second mortgage and home equity loan)
Houses without a mortgage: 0
Median household income for houses/condos with a mortgage: $54,492
Median household income for apartments without a mortgage: $50,205
Median monthly housing costs: $546
Compare current foreclosures near St. David, IL:
| Photo | Address | Area | Beds / Baths | Price | Details |
|---|---|---|---|---|---|

|
#1
N Pear
Topeka, IL 61567
|
- sq. feet
|
1 baths 2 beds |
$39,900
|
show details |

|
#2
Dean Ct
Canton, IL 61520
|
1,406 sq. feet
|
1 baths 3 beds |
show details | |

|
#3
Bellair Drive
Liverpool, IL 61543
|
616 sq. feet
|
1 baths 2 beds |
show details | |

|
#4
County Road 1800 N
Topeka, IL 61567
|
1,113 sq. feet
|
1 baths 3 beds |
show details | |

|
#5
E Olive St
Canton, IL 61520
|
1,800 sq. feet
|
1 baths 4 beds |
show details | |

|
#6
N 7th Ave
Canton, IL 61520
|
- sq. feet
|
- baths - beds |
$23,900
|
show details |

|
#7
S Trivoli Rd
Trivoli, IL 61569
|
2,060 sq. feet
|
1 baths 3 beds |
show details | |

|
#8
S Main St
Canton, IL 61520
|
3,452 sq. feet
|
2 baths 5 beds |
show details | |

|
#9
Grandview Ct
Manito, IL 61546
|
1,008 sq. feet
|
1 baths 3 beds |
show details | |

|
#10
Levee Rd
Manito, IL 61546
|
1,092 sq. feet
|
1 baths 2 beds |
show details |
| Photo | Address | Area | Beds / Baths | Price | Details |
|---|---|---|---|---|---|

|
#11
E Myrtle St
Canton, IL 61520
|
- sq. feet
|
1 baths 2 beds |
show details | |

|
#12
E Chestnut St
Canton, IL 61520
|
1,554 sq. feet
|
1 baths 3 beds |
show details | |

|
#13
Fulton Pl
Canton, IL 61520
|
- sq. feet
|
1 baths 4 beds |
show details | |

|
#14
Haas Ct
Manito, IL 61546
|
1,020 sq. feet
|
1 baths 2 beds |
show details | |

|
#15
S Maple St
Lewistown, IL 61542
|
- sq. feet
|
- baths - beds |
$44,900
|
show details |

|
#16
Cheryl Ct
Glasford, IL 61533
|
977 sq. feet
|
1 baths 2 beds |
show details | |

|
#17
S Kingston Mines Rd
Mapleton, IL 61547
|
1,354 sq. feet
|
1 baths 3 beds |
show details | |

|
#18
S Shryock Rd
Glasford, IL 61533
|
792 sq. feet
|
1 baths 1 beds |
show details | |

|
#19
N 6th Ave
Canton, IL 61520
|
- sq. feet
|
2 baths 3 beds |
show details | |

|
#20
S Madison St
Lewistown, IL 61542
|
- sq. feet
|
- baths - beds |
show details |
| Photo | Address | Area | Beds / Baths | Price | Details |
|---|---|---|---|---|---|

|
#21
N County Highway 2 # M
Smithfield, IL 61477
|
- sq. feet
|
- baths - beds |
show details | |

|
#22
N State Highway 78
Canton, IL 61520
|
- sq. feet
|
- baths - beds |
show details | |

|
#23
S Cunningham Rd
Farmington, IL 61531
|
- sq. feet
|
- baths - beds |
show details | |

|
#24
W Main St
Glasford, IL 61533
|
- sq. feet
|
- baths - beds |
show details | |

|
#25
E Main St
Glasford, IL 61533
|
- sq. feet
|
- baths - beds |
show details | |

|
#26
E Raymond St
Havana, IL 62644
|
- sq. feet
|
- baths - beds |
show details | |

|
#27
W Fort St
Farmington, IL 61531
|
- sq. feet
|
- baths - beds |
show details | |

|
#28
S Glasford Rd
Glasford, IL 61533
|
- sq. feet
|
- baths - beds |
show details | |

|
#29
E Vernon St
Farmington, IL 61531
|
- sq. feet
|
- baths - beds |
show details | |

|
#30
E Railroad St
Farmington, IL 61531
|
- sq. feet
|
- baths - beds |
show details |
| Photo | Address | Area | Beds / Baths | Price | Details |
|---|---|---|---|---|---|

|
#31
E Cr 2300n
Havana, IL 62644
|
- sq. feet
|
- baths - beds |
show details | |

|
#32
S 3rd St
Cuba, IL 61427
|
- sq. feet
|
- baths - beds |
show details | |

|
#33
W Main St
Ellisville, IL 61431
|
- sq. feet
|
- baths - beds |
show details | |

|
#34
N 2nd Ave
Canton, IL 61520
|
- sq. feet
|
- baths - beds |
show details | |

|
#35
W Vine St
Canton, IL 61520
|
- sq. feet
|
- baths - beds |
show details | |

|
#36
N 6th Ave
Canton, IL 61520
|
- sq. feet
|
- baths - beds |
show details | |

|
#37
S 6th Ave
Canton, IL 61520
|
- sq. feet
|
- baths - beds |
show details | |

|
#38
Old West Vine St
Canton, IL 61520
|
- sq. feet
|
- baths - beds |
show details | |

|
#39
E Spruce St
Canton, IL 61520
|
- sq. feet
|
- baths - beds |
show details | |

|
#40
E Olive St
Canton, IL 61520
|
- sq. feet
|
- baths - beds |
show details |
| Photo | Address | Area | Beds / Baths | Price | Details |
|---|---|---|---|---|---|

|
#41
N 8th Ave
Canton, IL 61520
|
- sq. feet
|
- baths - beds |
show details | |

|
#42
N 7th Ave
Canton, IL 61520
|
- sq. feet
|
- baths - beds |
show details | |

|
#43
E Delaware Cir
Cuba, IL 61427
|
- sq. feet
|
- baths - beds |
show details | |

|
#44
E Myrtle St
Canton, IL 61520
|
- sq. feet
|
- baths - beds |
show details | |

|
#45
S 1st Ave
Canton, IL 61520
|
- sq. feet
|
- baths - beds |
show details | |

|
#46
S Park Ave
Manito, IL 61546
|
- sq. feet
|
- baths - beds |
show details | |

|
#47
S Main St
Canton, IL 61520
|
- sq. feet
|
- baths - beds |
show details | |

|
#48
E Meadow Lawn St
Manito, IL 61546
|
- sq. feet
|
- baths - beds |
show details | |

|
#49
E Elm St
Canton, IL 61520
|
- sq. feet
|
- baths - beds |
show details | |

|
Check over 1 million property listings on Foreclosure.com!
|
browse all offers | |||


 | moving to Canton, IL (8 replies) |

Median year apartment built: 1955
Household type by relationship:
Households: 532- Male householders: 126 (52 living alone), Female householders: 113 (25 living alone)
119 spouses (119 opposite-sex spouses), 16 unmarried partners, (16 opposite-sex unmarried partners), 130 children (118 natural, 0 adopted, 11 stepchildren), 16 grandchildren, 0 brothers or sisters, 2 parents, 0 foster children, 1 other relatives, 4 non-relatives
Size of family households: 74 2-persons, 55 3-persons, 21 4-persons, 1 5-persons.
Size of nonfamily households: 82 1-person, 14 2-persons.
54 married couples with children.
20 single-parent households (11 men, 9 women).
99.0% of residents of St. David speak English at home.
0.8% of residents speak Spanish at home (50% speak English very well, 50% speak English not well).
Foreign born population: 1 (0.2%)
(0.0% of them are naturalized citizens)
| Here: | 5.7 |
| State: | 6.4 |
| Here: | 5.4 |
| State: | 4.1 |

- Bedrooms in owner-occupied houses and condos in St. David, Illinois
- 0no bedroom
- 191 bedroom
- 832 bedrooms
- 1153 bedrooms
- 144 bedrooms
- 55+ bedrooms

- Bedrooms in renter-occupied apartments in St. David, Illinois
- 0no bedroom
- 21 bedroom
- 42 bedrooms
- 43 bedrooms
- 04 bedrooms
- 05+ bedrooms

- Cars and other vehicles available in St. David in owner-occupied houses/condos
- 0no vehicle
- 861 vehicle
- 1102 vehicles
- 233 vehicles
- 164 vehicles
- 15+ vehicles

- Cars and other vehicles available in St. David in renter-occupied apartments
- 2no vehicle
- 41 vehicle
- 42 vehicles
- 03 vehicles
- 04 vehicles
- 05+ vehicles

- Rooms in owner-occupied houses in St. David, Illinois
- 01 room
- 52 rooms
- 03 rooms
- 474 rooms
- 535 rooms
- 586 rooms
- 287 rooms
- 128 rooms
- 349+ rooms

- Rooms in renter-occupied apartments in St. David, Illinois
- 01 room
- 02 rooms
- 03 rooms
- 24 rooms
- 35 rooms
- 46 rooms
- 17 rooms
- 08 rooms
- 09+ rooms


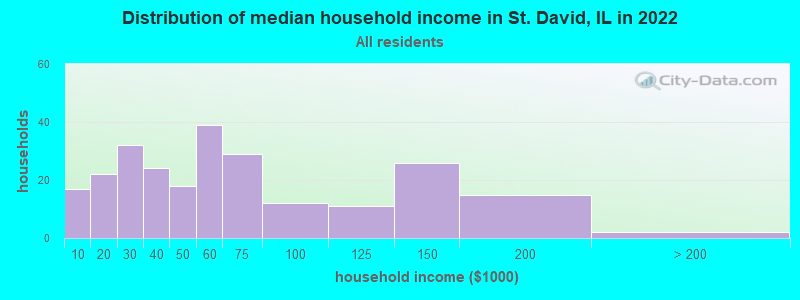
St. David, IL household income distribution

- 17Less than $10,000
- 22$10,000 to $19,999
- 32$20,000 to $29,999
- 24$30,000 to $39,999
- 18$40,000 to $49,999
- 39$50,000 to $59,999
- 29$60,000 to $74,999
- 12$75,000 to $99,999
- 11$100,000 to $124,999
- 26$125,000 to $149,999
- 15$150,000 to $199,999
- 2$200,000 or more
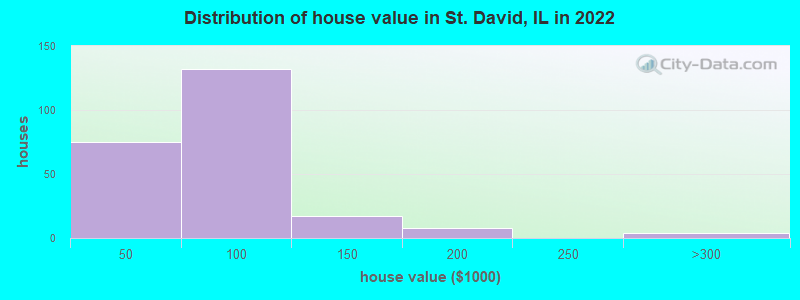
Home value of owner - occupied houses in 2022 in St. David, IL
-
- 15$10,000 to $14,999
- 8$15,000 to $19,999
- 2$20,000 to $24,999
- 29$25,000 to $29,999
- 11$30,000 to $34,999
- 8$40,000 to $49,999
- 28$50,000 to $59,999
- 41$60,000 to $69,999
- 17$70,000 to $79,999
- 20$80,000 to $89,999
- 15$90,000 to $99,999
- 10$100,000 to $124,999
- 6$125,000 to $149,999
- 8$150,000 to $174,999
- 3$250,000 to $299,999
- 1$400,000 to $499,999
Rent paid by renters in 2022 in St. David, IL
-
- 2$200 to $249
- 2$450 to $499
- 2$500 to $549
- 1$700 to $749
- 1No cash rent


Percentage of workers working in this county: 68.6%
Number of people working at home: 28 (11.7% of all workers)
Travel time to work (commute)
- Less than 5 minutes: 1
- 5 to 9 minutes: 26
- 10 to 14 minutes: 46
- 15 to 19 minutes: 32
- 20 to 24 minutes: 4
- 25 to 29 minutes: 0
- 30 to 34 minutes: 10
- 35 to 39 minutes: 0
- 40 to 44 minutes: 12
- 45 to 59 minutes: 50
- 60 to 89 minutes: 21
- 90 or more minutes: 0
Means of transportation to work:
- Drove a car alone: 193 (81.1%)
- Carpooled: 30 (12.6%)
- Motorcycle: 2 (0.8%)
- Walked: 4 (1.7%)
- Other means: 5 (2.1%)
- Worked at home: 4 (1.7%)

- Unemployment by race in 2022
- Unemployment rate for White non-Hispanic residents
- 1.1%Males

- Year of entry for the foreign-born population in St. David, Illinois
- 02010 or later
- 02000 to 2009
- 01990 to 1999
- 31980 to 1989
- 01970 to 1979
- 1Before 1970

First ancestries reported:
- German: 49 (23.4%)
- English: 35 (16.7%)
- American: 22 (10.5%)
- Croatian: 13 (6.2%)
- Yugoslavian: 12 (5.7%)
- Irish: 10 (4.8%)
- European: 6 (2.9%)
- Scotch-Irish: 3 (1.4%)
- Italian: 2 (1.0%)
- Austrian: 1 (0.5%)
- Danish: 1 (0.5%)
- Dutch: 1 (0.5%)
- Welsh: 1 (0.5%)
Most common places of birth for foreign-born residents (%):
Place of birth for U.S.-born residents:
- This state: 492
- Other state: 35
- Northeast: 0
- Midwest: 5
- South: 29
- West: 0
93.2% of St. David residents lived in the same house 1 years ago.
Out of people who lived in different houses, 27.1% lived in this county.
Out of people who lived in different counties, 100.0% lived in Illinois.
| St. David: | 93.2% |
| State average: | 88.3% |
Education attainment for males 25 years and older:
- No schooling: 0
- Nursery to 4th grade: 0
- 5th and 6th grade: 0
- 7th and 8th grade: 0
- 9th grade: 5
- 10th grade: 6
- 11th grade: 6
- 12th grade, no diploma: 0
- High school graduate (or equivalency): 108
- Less than 1 year of college: 12
- Some college more than 1 year, no degree: 45
- Associate degree: 5
- Bachelor's degree: 13
- Master's degree: 4
- Professional school degree: 0
- Doctorate degree: 0

Education attainment for females 25 years and older:
- No schooling: 0
- Nursery to 4th grade: 0
- 5th and 6th grade: 0
- 7th and 8th grade: 4
- 9th grade: 0
- 10th grade: 0
- 11th grade: 4
- 12th grade, no diploma: 12
- High school graduate (or equivalency): 31
- Less than 1 year of college: 6
- Some college more than 1 year, no degree: 46
- Associate degree: 25
- Bachelor's degree: 29
- Master's degree: 20
- Professional school degree: 2
- Doctorate degree: 0


Housing units in structures:
- One, detached: 267
- One, attached: 2
- 3 or 4: 2
- Mobile homes: 14
Housing units lacking complete kitchen facilities in 2022: 3.5%
House/condo owner moved in on average 12 years ago
Renter moved in on average 8 years ago

Private vs. public school enrollment:
| Here: | 0.0% |
| Illinois: | 13.3% |
| Here: | 0.0% |
| Illinois: | 9.9% |
| Here: | 0.0% |
| Illinois: | 27.4% |


