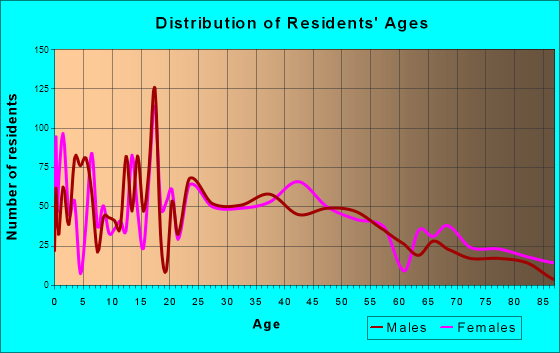
St. Johns, MI (Michigan) Houses and Residents
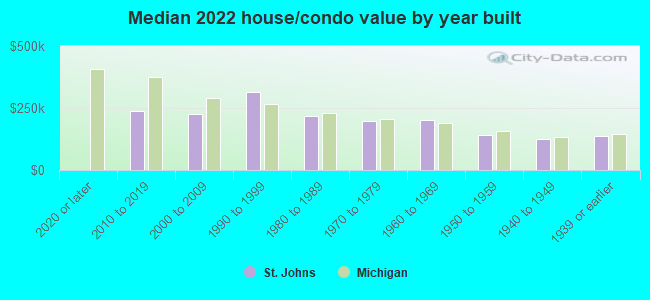
| St. Johns: | $165,282 |
| Michigan: | $224,400 |
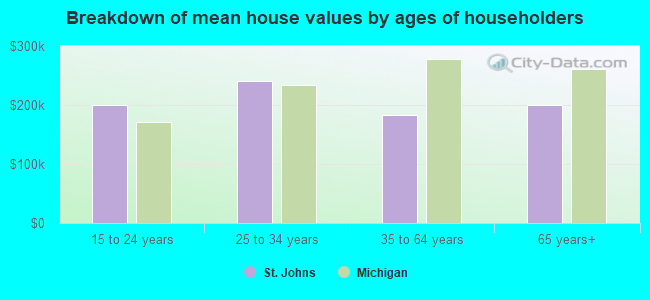
Mean price in 2022:
Detached houses: $201,052
Here: $201,052 State: $280,038 Townhouses or other attached units: $188,552
Here: $188,552 State: $239,520 Mobile homes: $29,031
Here: $29,031 State: $72,868
Total population: 7,971 (Urban population: 7,157 (all inside urban clusters), Rural population: 127 (all nonfarm))
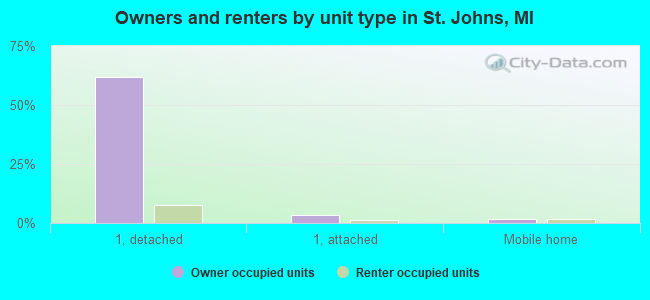
Houses: 3,412 (3,135 occupied: 2,198 owner occupied, 885 renter occupied)
| % of renters here: | 29% |
| State: | 27% |
Housing density: 870 houses/condos per square mile
Median price asked for vacant for-sale houses and condos in 2022: $406,034.
Median contract rent in 2022: $736 (lower quartile is $566, upper quartile is $902)
Median rent asked for vacant for-rent units in 2022: $1,316
Median gross rent in St. Johns, MI in 2022: $877
Housing units in St. Johns with a mortgage: 1,340 (150 second mortgage, 0 home equity loan, 137 both second mortgage and home equity loan)
Houses without a mortgage: 70
Median household income for houses/condos with a mortgage: $83,058
Median household income for apartments without a mortgage: $55,347
Median monthly housing costs: $922
Compare current foreclosures near St. Johns, MI:
| Photo | Address | Area | Beds / Baths | Price | Details |
|---|---|---|---|---|---|

|
#1
W Sheridan Rd
Lansing, MI 48906
|
1,295 sq. feet
|
2 baths 2 beds |
$57,600
|
show details |

|
#2
W Howe Rd
Eagle, MI 48822
|
1,709 sq. feet
|
2 baths 4 beds |
$299,900
|
show details |

|
#3
W Wieland Rd
Lansing, MI 48906
|
- sq. feet
|
1 baths 3 beds |
show details | |

|
#4
Floral Ave
Saint Johns, MI 48879
|
1,560 sq. feet
|
1 baths 3 beds |
show details | |

|
#5
Wilson St
Dewitt, MI 48820
|
3,214 sq. feet
|
3 baths 4 beds |
show details | |

|
#6
Wacousta Rd
Grand Ledge, MI 48837
|
1,716 sq. feet
|
1 baths 3 beds |
show details | |

|
#7
Hylewood Ave
Lansing, MI 48906
|
824 sq. feet
|
1 baths 2 beds |
show details | |

|
#8
Pingree Rd
Middleton, MI 48856
|
1,442 sq. feet
|
1 baths 3 beds |
show details | |

|
#9
S Hinman Rd
Eagle, MI 48822
|
2,496 sq. feet
|
1 baths 2 beds |
show details | |

|
#10
Church St
Laingsburg, MI 48848
|
1,548 sq. feet
|
1 baths 4 beds |
show details |
| Photo | Address | Area | Beds / Baths | Price | Details |
|---|---|---|---|---|---|

|
#11
Wilson St
Dewitt, MI 48820
|
4,322 sq. feet
|
3 baths 4 beds |
show details | |

|
#12
E Front St
Ovid, MI 48866
|
1,400 sq. feet
|
1 baths 3 beds |
show details | |

|
#13
Ducharme Dr
Dewitt, MI 48820
|
1,640 sq. feet
|
2 baths 3 beds |
show details | |

|
#14
Country Farm Ln
Laingsburg, MI 48848
|
2,263 sq. feet
|
2 baths 4 beds |
show details | |

|
#15
W Fairfield Ave
Lansing, MI 48906
|
1,080 sq. feet
|
1 baths 3 beds |
show details | |

|
#16
Biltmore Blvd
Lansing, MI 48906
|
1,165 sq. feet
|
1 baths 3 beds |
show details | |

|
#17
Westview Dr
Laingsburg, MI 48848
|
1,040 sq. feet
|
1 baths 3 beds |
show details | |

|
#18
Wood Rd
Dewitt, MI 48820
|
1,188 sq. feet
|
1 baths 3 beds |
show details | |

|
#19
Upton Rd
Laingsburg, MI 48848
|
1,218 sq. feet
|
1 baths 3 beds |
show details | |

|
#20
W State Rd
Lansing, MI 48906
|
1,079 sq. feet
|
1 baths 2 beds |
show details |
| Photo | Address | Area | Beds / Baths | Price | Details |
|---|---|---|---|---|---|

|
#21
W Herbison Rd
Dewitt, MI 48820
|
1,760 sq. feet
|
1 baths 3 beds |
show details | |

|
#22
W Kent St
Fowler, MI 48835
|
1,330 sq. feet
|
1 baths 3 beds |
show details | |

|
#23
W Clinton St
Ovid, MI 48866
|
960 sq. feet
|
1 baths 3 beds |
show details | |

|
#24
Westwind Dr
Dewitt, MI 48820
|
1,544 sq. feet
|
2 baths 3 beds |
show details | |

|
#25
Springdale Dr
Lansing, MI 48906
|
2,976 sq. feet
|
2 baths 4 beds |
show details | |

|
#26
E Baldwin St
Saint Johns, MI 48879
|
840 sq. feet
|
1 baths 2 beds |
show details | |

|
#27
S Morton St
Saint Johns, MI 48879
|
1,560 sq. feet
|
1 baths 3 beds |
show details | |

|
#28
N Lansing St
Saint Johns, MI 48879
|
874 sq. feet
|
1 baths 2 beds |
show details | |

|
#29
W Gibbs St
Saint Johns, MI 48879
|
792 sq. feet
|
1 baths 1 beds |
show details | |

|
#30
Coolidge St
Lansing, MI 48906
|
1,484 sq. feet
|
2 baths 3 beds |
show details |
| Photo | Address | Area | Beds / Baths | Price | Details |
|---|---|---|---|---|---|

|
#31
W Howe Rd
Eagle, MI 48822
|
1,712 sq. feet
|
2 baths 3 beds |
show details | |

|
#32
Rheamount Ave
Lansing, MI 48906
|
761 sq. feet
|
1 baths 2 beds |
show details | |

|
#33
S Chandler Rd
Saint Johns, MI 48879
|
2,496 sq. feet
|
2 baths 3 beds |
show details | |

|
#34
Shepardsville Rd
Laingsburg, MI 48848
|
1,464 sq. feet
|
2 baths 3 beds |
show details | |

|
#35
Gary St
Lansing, MI 48906
|
1,754 sq. feet
|
2 baths 5 beds |
show details | |

|
#36
Cumberland Rd
Lansing, MI 48906
|
1,346 sq. feet
|
1 baths 3 beds |
show details | |

|
#37
S Pline Rd
Pewamo, MI 48873
|
1,208 sq. feet
|
2 baths 3 beds |
show details | |

|
#38
E Jason Rd
Saint Johns, MI 48879
|
2,977 sq. feet
|
2 baths 3 beds |
show details | |

|
#39
E Island Rd
Elsie, MI 48831
|
1,352 sq. feet
|
2 baths 3 beds |
show details | |

|
#40
Wesley Pl
Lansing, MI 48906
|
1,314 sq. feet
|
1 baths 3 beds |
show details |
| Photo | Address | Area | Beds / Baths | Price | Details |
|---|---|---|---|---|---|

|
#41
Watson Rd
Bath, MI 48808
|
2,090 sq. feet
|
1 baths - beds |
show details | |

|
#42
Ann Dr
Bath, MI 48808
|
1,495 sq. feet
|
1 baths - beds |
show details | |

|
#43
Ann Dr
Bath, MI 48808
|
1,440 sq. feet
|
1 baths - beds |
show details | |

|
#44
S Mead St
Saint Johns, MI 48879
|
4,110 sq. feet
|
2 baths - beds |
show details | |

|
#45
W Paulson St
Lansing, MI 48906
|
1,790 sq. feet
|
2 baths - beds |
show details | |

|
#46
Rosemont St
Bath, MI 48808
|
748 sq. feet
|
1 baths - beds |
show details | |

|
#47
W Pleasant St
Hubbardston, MI 48845
|
1,258 sq. feet
|
1 baths - beds |
show details | |

|
#48
Marquette St
Lansing, MI 48906
|
5,940 sq. feet
|
1 baths - beds |
show details | |

|
#49
Creston Ave
Lansing, MI 48906
|
1,319 sq. feet
|
1 baths - beds |
show details | |

|
Check over 1 million property listings on Foreclosure.com!
|
browse all offers | |||


 | Detroit Newbie! Are any of these homes in good areas? (35 replies) |
| I feel like Royal Oak should be the 2nd largest city in the state. (24 replies) |
| Grand Ledge, Dewitt, or St. Johns: Best School System? (5 replies) |
| Moving to Lansing area - what are good cities to look for housing? (11 replies) |
| What is Metro Detroit's suburbs like (50 replies) |
| Relocating to Lansing (9 replies) |
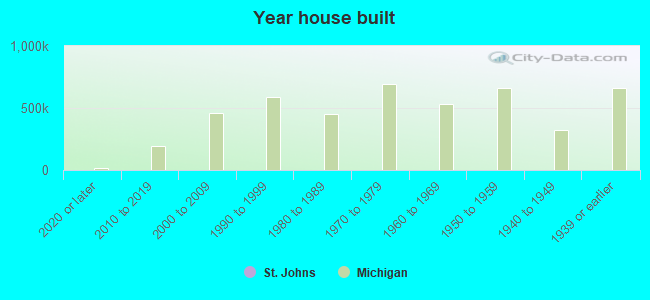
Median year apartment built: 1975
Household type by relationship:
Households: 7,759- Male householders: 1,372 (366 living alone), Female householders: 1,735 (770 living alone)
1,359 spouses (1,359 opposite-sex spouses), 164 unmarried partners, (164 opposite-sex unmarried partners), 2,142 children (1,950 natural, 88 adopted, 103 stepchildren), 335 grandchildren, 69 brothers or sisters, 104 parents, 26 foster children, 75 other relatives, 23 non-relatives
- In group quarters: 351
Size of family households: 951 2-persons, 325 3-persons, 246 4-persons, 145 5-persons, 38 6-persons, 81 7-or-more-persons.
Size of nonfamily households: 1,351 1-person, 39 2-persons, 4 3-persons.
796 married couples with children.
738 single-parent households (128 men, 610 women).
98.4% of residents of St. Johns speak English at home.
0.2% of residents speak Spanish at home (73% speak English very well, 27% speak English not well).
0.9% of residents speak other Indo-European language at home (100% speak English very well).
0.2% of residents speak Asian or Pacific Island language at home (45% speak English very well, 55% speak English well).
0.1% of residents speak other language at home (100% speak English very well).
Foreign born population: 106 (1.4%)
(83.0% of them are naturalized citizens)
| Here: | 6.7 |
| State: | 6.5 |
| Here: | 4.6 |
| State: | 4.3 |
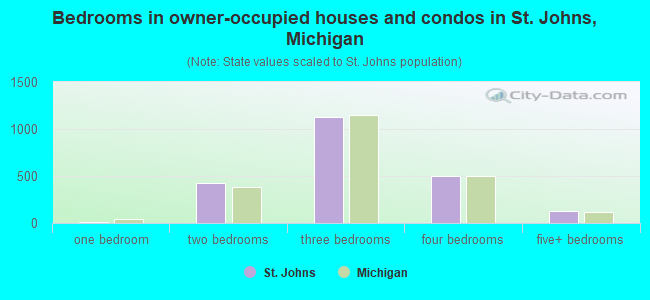
- Bedrooms in owner-occupied houses and condos in St. Johns, Michigan
- 0no bedroom
- 141 bedroom
- 4232 bedrooms
- 1,1293 bedrooms
- 5024 bedrooms
- 1305+ bedrooms
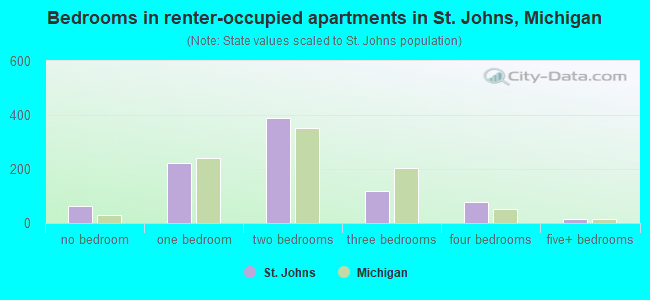
- Bedrooms in renter-occupied apartments in St. Johns, Michigan
- 64no bedroom
- 2211 bedroom
- 3882 bedrooms
- 1203 bedrooms
- 774 bedrooms
- 165+ bedrooms
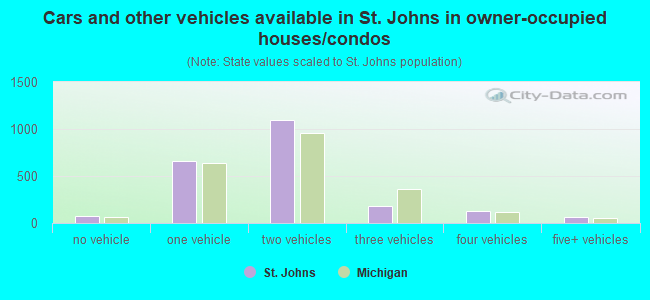
- Cars and other vehicles available in St. Johns in owner-occupied houses/condos
- 70no vehicle
- 6581 vehicle
- 1,0962 vehicles
- 1863 vehicles
- 1244 vehicles
- 655+ vehicles
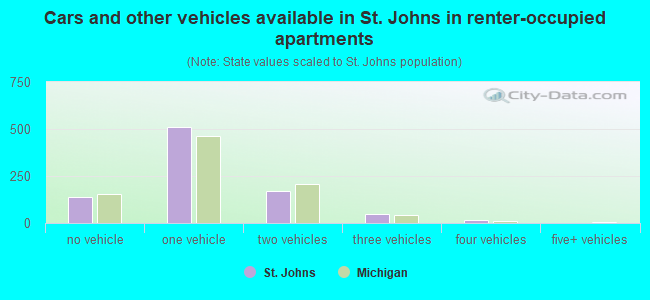
- Cars and other vehicles available in St. Johns in renter-occupied apartments
- 140no vehicle
- 5111 vehicle
- 1692 vehicles
- 503 vehicles
- 164 vehicles
- 05+ vehicles
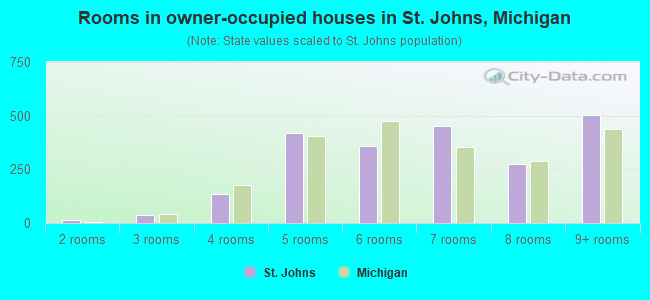
- Rooms in owner-occupied houses in St. Johns, Michigan
- 01 room
- 142 rooms
- 383 rooms
- 1344 rooms
- 4205 rooms
- 3586 rooms
- 4537 rooms
- 2778 rooms
- 5049+ rooms
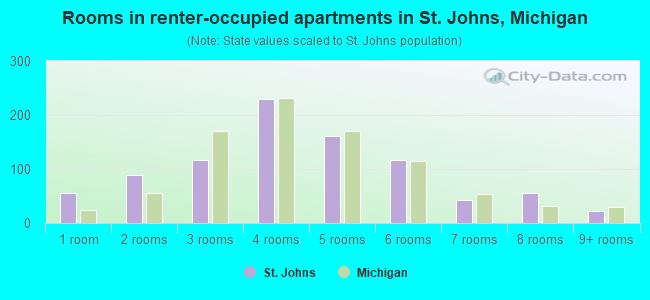
- Rooms in renter-occupied apartments in St. Johns, Michigan
- 561 room
- 882 rooms
- 1163 rooms
- 2304 rooms
- 1615 rooms
- 1166 rooms
- 427 rooms
- 558 rooms
- 239+ rooms
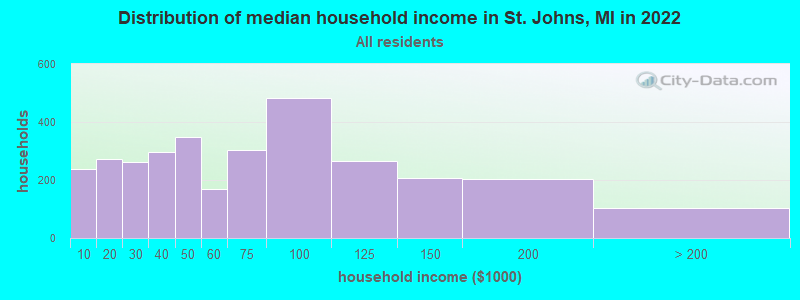
St. Johns, MI household income distribution

- 238Less than $10,000
- 272$10,000 to $19,999
- 262$20,000 to $29,999
- 298$30,000 to $39,999
- 347$40,000 to $49,999
- 168$50,000 to $59,999
- 304$60,000 to $74,999
- 484$75,000 to $99,999
- 267$100,000 to $124,999
- 206$125,000 to $149,999
- 203$150,000 to $199,999
- 103$200,000 or more
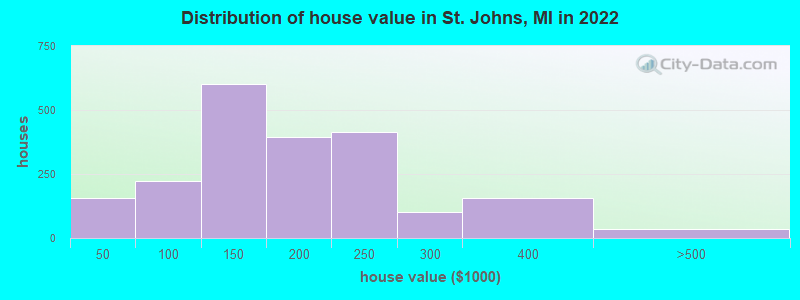
Home value of owner - occupied houses in 2022 in St. Johns, MI
-
- 19Less than $10,000
- 33$10,000 to $14,999
- 68$15,000 to $19,999
- 23$20,000 to $24,999
- 10$40,000 to $49,999
- 18$50,000 to $59,999
- 24$60,000 to $69,999
- 12$70,000 to $79,999
- 80$80,000 to $89,999
- 74$90,000 to $99,999
- 229$100,000 to $124,999
- 373$125,000 to $149,999
- 205$150,000 to $174,999
- 190$175,000 to $199,999
- 414$200,000 to $249,999
- 102$250,000 to $299,999
- 157$300,000 to $399,999
- 34$400,000 to $499,999
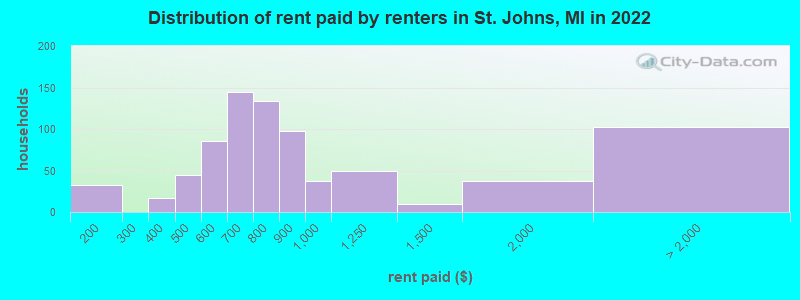
Rent paid by renters in 2022 in St. Johns, MI
-
- 33$100 to $149
- 17$350 to $399
- 43$450 to $499
- 35$500 to $549
- 49$550 to $599
- 43$600 to $649
- 101$650 to $699
- 86$700 to $749
- 46$750 to $799
- 97$800 to $899
- 36$900 to $999
- 50$1,000 to $1,249
- 10$1,250 to $1,499
- 36$1,500 to $1,999
- 102No cash rent
Percentage of workers working in this county: 61.4%
Number of people working at home: 637 (17.5% of all workers)
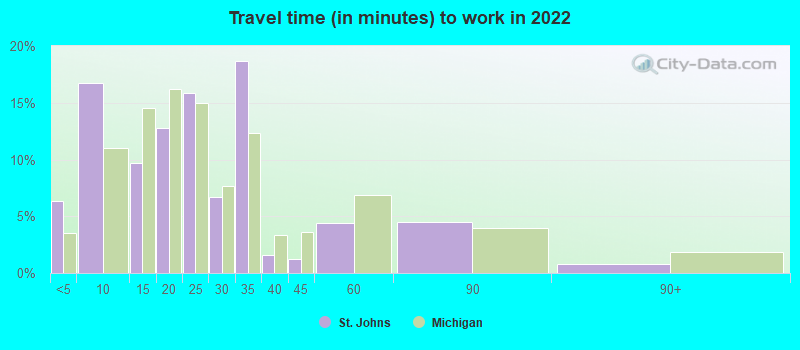
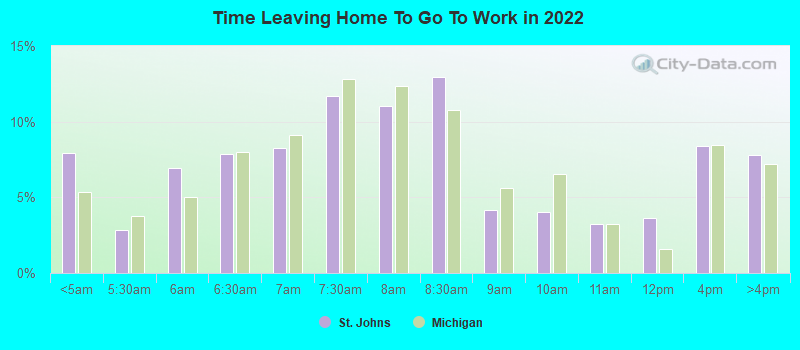
Travel time to work (commute)
- Less than 5 minutes: 364
- 5 to 9 minutes: 659
- 10 to 14 minutes: 162
- 15 to 19 minutes: 158
- 20 to 24 minutes: 273
- 25 to 29 minutes: 389
- 30 to 34 minutes: 640
- 35 to 39 minutes: 62
- 40 to 44 minutes: 54
- 45 to 59 minutes: 83
- 60 to 89 minutes: 114
- 90 or more minutes: 40
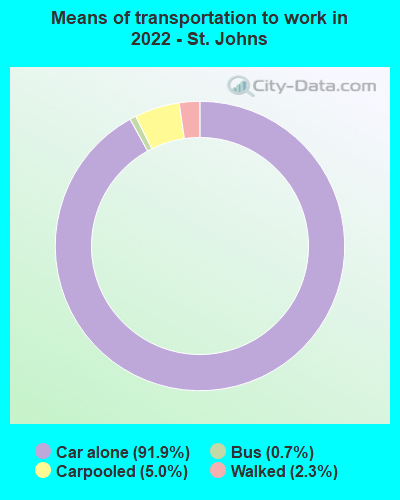
Means of transportation to work:
- Drove a car alone: 4,056 (79.9%)
- Carpooled: 224 (4.4%)
- Bus: 24 (0.5%)
- Taxi: 2 (0.0%)
- Walked: 104 (2.0%)
- Worked at home: 637 (12.5%)
- Unemployment by race in 2022
- Unemployment rate for White non-Hispanic residents
- 0.3%Males
- 6.1%Females
- Unemployment rate for Black residents
- 100.0%Females
- Unemployment rate for other race residents
- 100.0%Females
- Unemployment rate for Hispanic or Latino residents
- 46.0%Females
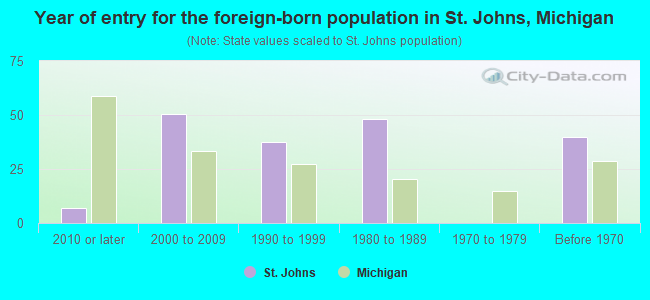
- Year of entry for the foreign-born population in St. Johns, Michigan
- 72010 or later
- 502000 to 2009
- 381990 to 1999
- 481980 to 1989
- 01970 to 1979
- 40Before 1970
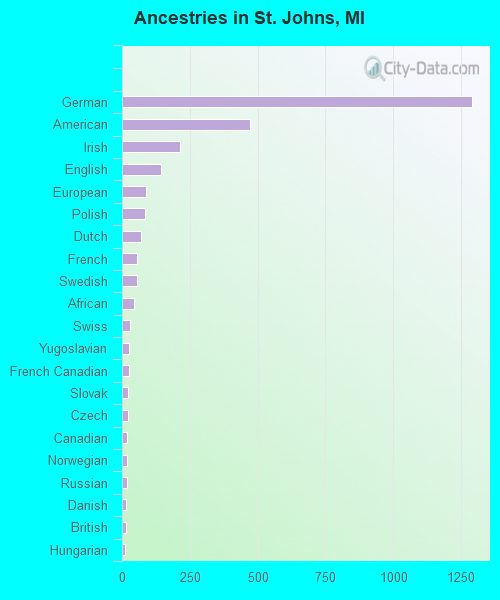
First ancestries reported:
- German: 1,289 (40.0%)
- American: 471 (14.6%)
- Irish: 213 (6.6%)
- English: 144 (4.5%)
- European: 88 (2.7%)
- Polish: 84 (2.6%)
- Dutch: 69 (2.1%)
- French: 54 (1.7%)
- Swedish: 54 (1.7%)
- African: 44 (1.4%)
- Swiss: 29 (0.9%)
- Yugoslavian: 27 (0.8%)
- French Canadian: 24 (0.7%)
- Slovak: 22 (0.7%)
- Czech: 21 (0.7%)
- Canadian: 19 (0.6%)
- Norwegian: 18 (0.6%)
- Russian: 18 (0.6%)
- Danish: 16 (0.5%)
- British: 15 (0.5%)
- Hungarian: 12 (0.4%)
- Scottish: 11 (0.3%)
- Finnish: 4 (0.1%)
Most common places of birth for foreign-born residents (%):
| St. Johns: | 30.6% (37) |
| Michigan: | 5.0% (35,052) |
| St. Johns: | 28.9% (35) |
| Michigan: | 0.9% (6,326) |
| St. Johns: | 10.7% (13) |
| Michigan: | 2.8% (19,112) |
| St. Johns: | 10.7% (13) |
| Michigan: | 2.3% (16,126) |
| St. Johns: | 4.1% (5) |
| Michigan: | 0.0% (333) |
| St. Johns: | 4.1% (5) |
| Michigan: | 0.5% (3,798) |
| St. Johns: | 3.3% (4) |
| Michigan: | 4.9% (34,295) |
| St. Johns: | 2.5% (3) |
| Michigan: | 11.1% (77,240) |
Place of birth for U.S.-born residents:
- This state: 6,804
- Other state: 853
- Northeast: 37
- Midwest: 425
- South: 229
- West: 106
84.8% of St. Johns residents lived in the same house 1 years ago.
Out of people who lived in different houses, 35.4% lived in this county.
Out of people who lived in different counties, 54.2% lived in Michigan.
| St. Johns: | 84.8% |
| State average: | 88.4% |
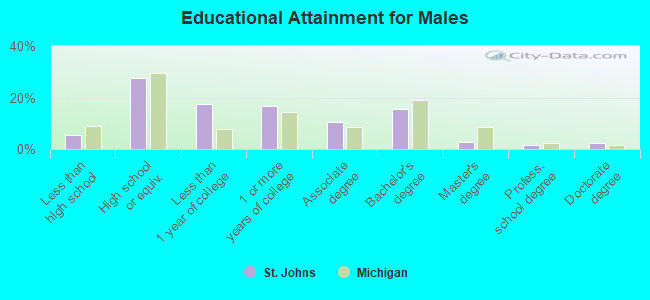
Education attainment for males 25 years and older:
- No schooling: 17
- Nursery to 4th grade: 0
- 5th and 6th grade: 0
- 7th and 8th grade: 4
- 9th grade: 4
- 10th grade: 75
- 11th grade: 18
- 12th grade, no diploma: 9
- High school graduate (or equivalency): 665
- Less than 1 year of college: 419
- Some college more than 1 year, no degree: 402
- Associate degree: 252
- Bachelor's degree: 370
- Master's degree: 69
- Professional school degree: 37
- Doctorate degree: 57
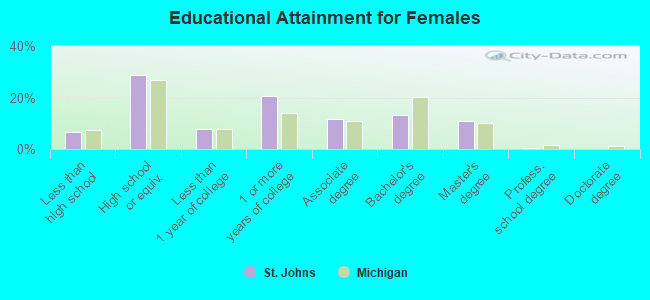
Education attainment for females 25 years and older:
- No schooling: 9
- Nursery to 4th grade: 0
- 5th and 6th grade: 0
- 7th and 8th grade: 56
- 9th grade: 27
- 10th grade: 9
- 11th grade: 16
- 12th grade, no diploma: 79
- High school graduate (or equivalency): 855
- Less than 1 year of college: 230
- Some college more than 1 year, no degree: 612
- Associate degree: 345
- Bachelor's degree: 392
- Master's degree: 316
- Professional school degree: 12
- Doctorate degree: 0
Housing units in structures:
- One, detached: 2,374
- One, attached: 131
- Two: 51
- 3 or 4: 172
- 5 to 9: 195
- 10 to 19: 121
- 20 to 49: 123
- 50 or more: 106
- Mobile homes: 132
Median worth of mobile homes: $14,464
Housing units lacking complete kitchen facilities in 2022: 1.4%
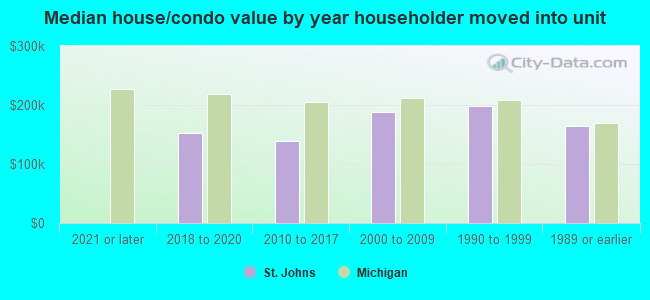
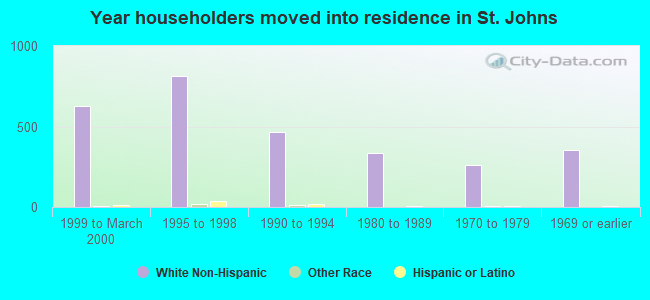
House/condo owner moved in on average 12 years ago
Renter moved in on average 3 years ago
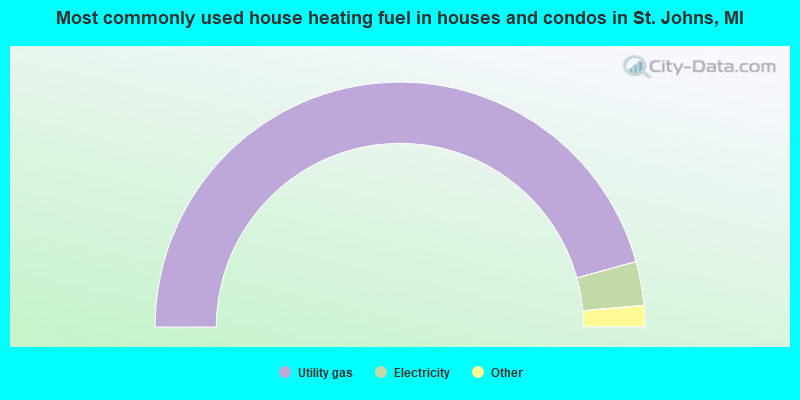
- 91.4%Utility gas
- 5.8%Electricity
- 1.4%Bottled, tank, or LP gas
- 0.9%Fuel oil, kerosene, etc.
- 0.5%Wood
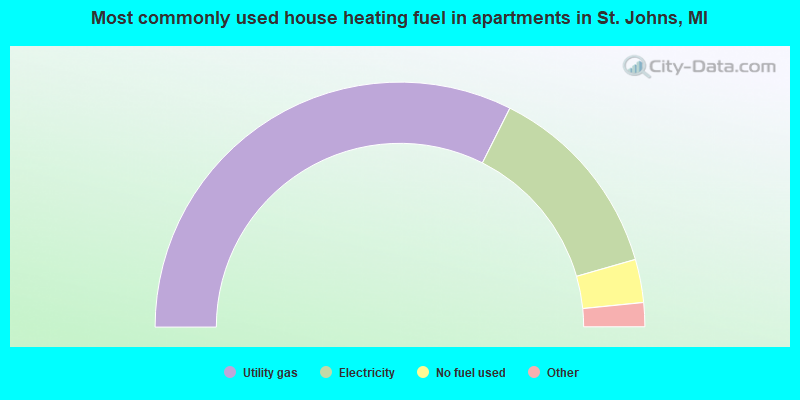
- 64.9%Utility gas
- 26.3%Electricity
- 5.7%No fuel used
- 2.1%Bottled, tank, or LP gas
- 0.9%Other fuel
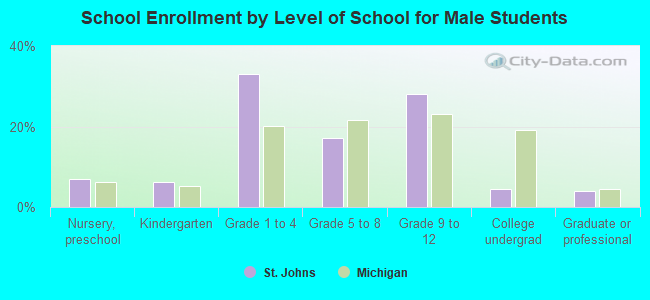
Private vs. public school enrollment:
| Here: | 12.1% |
| Michigan: | 12.4% |
| Here: | 3.1% |
| Michigan: | 9.8% |
| Here: | 4.8% |
| Michigan: | 14.9% |