St. Joseph, IL (Illinois) Houses and Residents
| St. Joseph: | $239,313 |
| Illinois: | $251,600 |
Mean price in 2022:
Detached houses: $255,177
Here: $255,177 State: $310,164
Total population: 4,082 (Urban population: 2,924 (all inside urban clusters), Rural population: 0)
Houses: 1,522 (1,522 occupied: 1,315 owner occupied, 218 renter occupied)
| % of renters here: | 14% |
| State: | 33% |
Housing density: 1,344 houses/condos per square mile
Median price asked for vacant for-sale houses and condos in 2022 in this county: $54,726.
Median contract rent in 2022: $746 (lower quartile is $612, upper quartile is $824)
Median rent asked for vacant for-rent units in 2022: $864
Median gross rent in St. Joseph, IL in 2022: $906
Housing units in St. Joseph with a mortgage: 836 (20 second mortgage, 0 home equity loan, 22 both second mortgage and home equity loan)
Houses without a mortgage: 0
Median household income for houses/condos with a mortgage: $119,912
Median household income for apartments without a mortgage: $91,430
Median monthly housing costs: $1,267
Compare current foreclosures near St. Joseph, IL:
| Photo | Address | Area | Beds / Baths | Price | Details |
|---|---|---|---|---|---|

|
#1
S Main St
Gifford, IL 61847
|
2,200 sq. feet
|
2 baths 4 beds |
$165,000
|
show details |

|
#2
W Bradley Ave
Champaign, IL 61820
|
1,202 sq. feet
|
1 baths 2 beds |
$139,000
|
show details |

|
#3
E Grove Ave
Rantoul, IL 61866
|
800 sq. feet
|
1 baths 2 beds |
show details | |

|
#4
W Hill St
Champaign, IL 61820
|
918 sq. feet
|
2 baths - beds |
show details | |

|
#5
N Vermilion Ave
Allerton, IL 61810
|
1,560 sq. feet
|
2 baths 3 beds |
show details | |

|
#6
W Holden St
Tolono, IL 61880
|
1,104 sq. feet
|
1 baths 3 beds |
show details | |

|
#7
E Marshall St
Tolono, IL 61880
|
2,060 sq. feet
|
2 baths - beds |
show details | |

|
#8
E Illinois St
Urbana, IL 61801
|
1,104 sq. feet
|
1 baths - beds |
show details | |

|
#9
Harmon St
Urbana, IL 61801
|
1,530 sq. feet
|
2 baths - beds |
show details | |

|
#10
Golfview Dr
Urbana, IL 61801
|
2,182 sq. feet
|
3 baths - beds |
show details |
| Photo | Address | Area | Beds / Baths | Price | Details |
|---|---|---|---|---|---|

|
#11
W Reynolds St
Tolono, IL 61880
|
1,568 sq. feet
|
1 baths - beds |
show details | |

|
#12
Waverly Dr
Champaign, IL 61821
|
3,274 sq. feet
|
3 baths - beds |
show details | |

|
#13
W Beardsley Ave
Champaign, IL 61820
|
977 sq. feet
|
2 baths - beds |
show details | |

|
#14
W Columbia Ave
Champaign, IL 61821
|
816 sq. feet
|
1 baths - beds |
show details | |

|
#15
Provine Cir
Urbana, IL 61801
|
1,093 sq. feet
|
3 baths - beds |
show details | |

|
#16
W Bradley Ave
Champaign, IL 61821
|
1,154 sq. feet
|
1 baths - beds |
show details | |

|
#17
Holly Hill Dr
Champaign, IL 61821
|
972 sq. feet
|
1 baths - beds |
show details | |

|
#18
County Road 1800 E
Philo, IL 61864
|
1,462 sq. feet
|
1 baths - beds |
show details | |

|
#19
Greenbriar Dr
Champaign, IL 61820
|
768 sq. feet
|
1 baths - beds |
show details | |

|
#20
W Springfield Ave
Champaign, IL 61821
|
754 sq. feet
|
2 baths - beds |
show details |
| Photo | Address | Area | Beds / Baths | Price | Details |
|---|---|---|---|---|---|

|
#21
Philo Rd
Urbana, IL 61801
|
800 sq. feet
|
2 baths - beds |
show details | |

|
#22
Devonshire Dr
Champaign, IL 61821
|
2,706 sq. feet
|
3 baths - beds |
show details | |

|
#23
W Beardsley Ave
Champaign, IL 61821
|
864 sq. feet
|
2 baths - beds |
show details | |

|
#24
Burlison Dr
Urbana, IL 61801
|
1,539 sq. feet
|
2 baths - beds |
show details | |

|
#25
E Columbia Ave
Champaign, IL 61820
|
1,248 sq. feet
|
1 baths - beds |
show details | |

|
#26
Fairview Dr
Champaign, IL 61820
|
880 sq. feet
|
1 baths - beds |
show details | |

|
#27
W Green St
Champaign, IL 61820
|
1,131 sq. feet
|
2 baths - beds |
show details | |

|
#28
W Bradley Ave
Champaign, IL 61820
|
796 sq. feet
|
1 baths - beds |
show details | |

|
#29
S John St
Thomasboro, IL 61878
|
3,100 sq. feet
|
4 baths - beds |
show details | |

|
#30
W Harvard St
Champaign, IL 61820
|
928 sq. feet
|
1 baths - beds |
show details |
| Photo | Address | Area | Beds / Baths | Price | Details |
|---|---|---|---|---|---|

|
#31
Crestview Dr
Champaign, IL 61822
|
1,408 sq. feet
|
3 baths - beds |
show details | |

|
#32
County Road 600 N
Sidney, IL 61877
|
560 sq. feet
|
1 baths - beds |
show details | |

|
#33
N Mckinley Ave
Champaign, IL 61821
|
648 sq. feet
|
1 baths - beds |
show details | |

|
#34
W Vine St
Champaign, IL 61820
|
1,344 sq. feet
|
2 baths - beds |
show details | |

|
#35
N 8th St
Saint Joseph, IL 61873
|
768 sq. feet
|
1 baths - beds |
show details | |

|
#36
Ellis Dr
Urbana, IL 61801
|
864 sq. feet
|
1 baths - beds |
show details | |

|
#37
W Eads St
Urbana, IL 61801
|
1,267 sq. feet
|
2 baths - beds |
show details | |

|
#38
W Nevada St
Urbana, IL 61801
|
867 sq. feet
|
2 baths - beds |
show details | |

|
#39
Garden Hills Dr
Champaign, IL 61821
|
1,479 sq. feet
|
1 baths - beds |
show details | |

|
#40
W Beardsley Ave
Champaign, IL 61821
|
1,012 sq. feet
|
1 baths - beds |
show details |
| Photo | Address | Area | Beds / Baths | Price | Details |
|---|---|---|---|---|---|

|
#41
Garden Hills Dr
Champaign, IL 61821
|
1,036 sq. feet
|
1 baths - beds |
show details | |

|
#42
S Glover Ave
Urbana, IL 61802
|
1,008 sq. feet
|
1 baths - beds |
show details | |

|
#43
Cambridge Dr
Champaign, IL 61821
|
1,316 sq. feet
|
1 baths - beds |
show details | |

|
#44
N West St
Homer, IL 61849
|
1,196 sq. feet
|
1 baths - beds |
show details | |

|
#45
Hollycrest Dr
Champaign, IL 61821
|
1,062 sq. feet
|
2 baths - beds |
show details | |

|
#46
S Sunny Ln
Urbana, IL 61802
|
1,260 sq. feet
|
2 baths - beds |
show details | |

|
#47
Oak Pl
Rantoul, IL 61866
|
2,087 sq. feet
|
2 baths - beds |
show details | |

|
#48
Parkdale Dr
Champaign, IL 61821
|
1,350 sq. feet
|
1 baths - beds |
show details | |

|
#49
S Scottswood Dr
Urbana, IL 61802
|
1,188 sq. feet
|
1 baths - beds |
show details | |

|
Check over 1 million property listings on Foreclosure.com!
|
browse all offers | |||


 | Favorite Day Trip out of Chicago? (21 replies) |
| Champaign-Urbana relocation (16 replies) |
| Looking for a home rental with a pitbull in Champain/Urbana and surrounding area (2 replies) |
| Moving to St. Joseph/Mahomet (6 replies) |
| Roycemoore and The Academy at St Joan of Arc Elementary (7 replies) |
| Does Cabrini Green Still Exist to ANY Extent? (82 replies) |

Median year apartment built: 1982
Household type by relationship:
Households: 3,931- Male householders: 614 (135 living alone), Female householders: 880 (336 living alone)
813 spouses (813 opposite-sex spouses), 48 unmarried partners, (31 opposite-sex unmarried partners), 1,380 children (1,250 natural, 67 adopted, 63 stepchildren), 0 grandchildren, 65 brothers or sisters, 0 parents, 0 foster children, 86 other relatives, 30 non-relatives
- In group quarters: 15
Size of family households: 356 2-persons, 271 3-persons, 260 4-persons, 58 5-persons, 34 6-persons.
Size of nonfamily households: 499 1-person, 41 2-persons.
957 married couples with children.
166 single-parent households (31 men, 135 women).
94.8% of residents of St. Joseph speak English at home.
2.3% of residents speak Spanish at home (93% speak English very well, 7% speak English well).
2.3% of residents speak Asian or Pacific Island language at home (58% speak English very well, 8% speak English well, 34% speak English not well).
Foreign born population: 81 (2.1%)
(29.6% of them are naturalized citizens)
| Here: | 7.3 |
| State: | 6.4 |
| Here: | 4.6 |
| State: | 4.1 |

- Bedrooms in owner-occupied houses and condos in St. Joseph, Illinois
- 0no bedroom
- 01 bedroom
- 142 bedrooms
- 6323 bedrooms
- 3704 bedrooms
- 3005+ bedrooms

- Bedrooms in renter-occupied apartments in St. Joseph, Illinois
- 15no bedroom
- 531 bedroom
- 892 bedrooms
- 423 bedrooms
- 184 bedrooms
- 05+ bedrooms

- Cars and other vehicles available in St. Joseph in owner-occupied houses/condos
- 0no vehicle
- 2531 vehicle
- 5772 vehicles
- 4253 vehicles
- 614 vehicles
- 05+ vehicles

- Cars and other vehicles available in St. Joseph in renter-occupied apartments
- 15no vehicle
- 1161 vehicle
- 872 vehicles
- 03 vehicles
- 04 vehicles
- 05+ vehicles

- Rooms in owner-occupied houses in St. Joseph, Illinois
- 01 room
- 02 rooms
- 03 rooms
- 644 rooms
- 1425 rooms
- 2656 rooms
- 2627 rooms
- 2518 rooms
- 3339+ rooms

- Rooms in renter-occupied apartments in St. Joseph, Illinois
- 151 room
- 142 rooms
- 393 rooms
- 324 rooms
- 865 rooms
- 186 rooms
- 07 rooms
- 138 rooms
- 09+ rooms


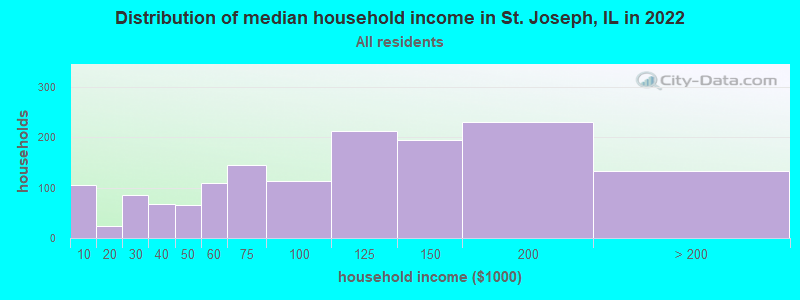
St. Joseph, IL household income distribution

- 105Less than $10,000
- 24$10,000 to $19,999
- 85$20,000 to $29,999
- 68$30,000 to $39,999
- 66$40,000 to $49,999
- 109$50,000 to $59,999
- 145$60,000 to $74,999
- 113$75,000 to $99,999
- 212$100,000 to $124,999
- 195$125,000 to $149,999
- 230$150,000 to $199,999
- 132$200,000 or more
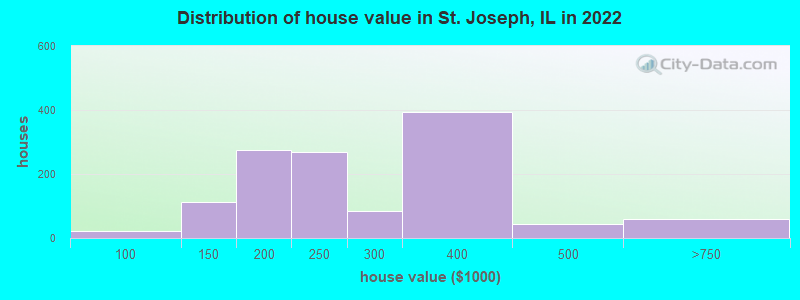
Home value of owner - occupied houses in 2022 in St. Joseph, IL
-
- 13$70,000 to $79,999
- 9$90,000 to $99,999
- 18$100,000 to $124,999
- 95$125,000 to $149,999
- 114$150,000 to $174,999
- 159$175,000 to $199,999
- 269$200,000 to $249,999
- 84$250,000 to $299,999
- 394$300,000 to $399,999
- 43$400,000 to $499,999
- 58$500,000 to $749,999
Rent paid by renters in 2022 in St. Joseph, IL
-
- 60$350 to $399
- 41$600 to $649
- 15$700 to $749
- 45$750 to $799
- 62$800 to $899
- 10$900 to $999
- 16No cash rent


Percentage of workers working in this county: 84.5%
Number of people working at home: 510 (25.6% of all workers)
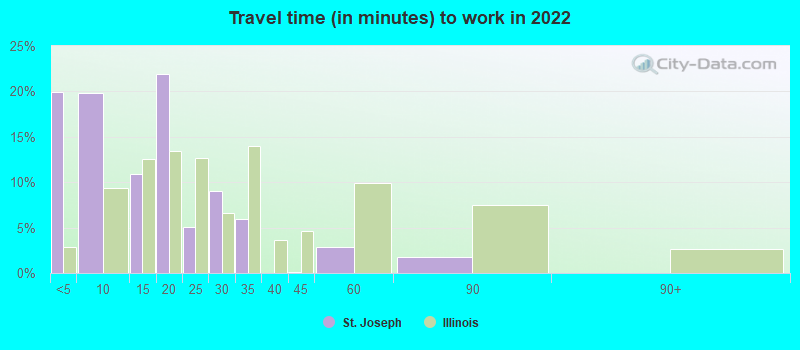
Travel time to work (commute)
- Less than 5 minutes: 67
- 5 to 9 minutes: 72
- 10 to 14 minutes: 127
- 15 to 19 minutes: 236
- 20 to 24 minutes: 301
- 25 to 29 minutes: 232
- 30 to 34 minutes: 186
- 35 to 39 minutes: 29
- 40 to 44 minutes: 39
- 45 to 59 minutes: 105
- 60 to 89 minutes: 34
- 90 or more minutes: 4
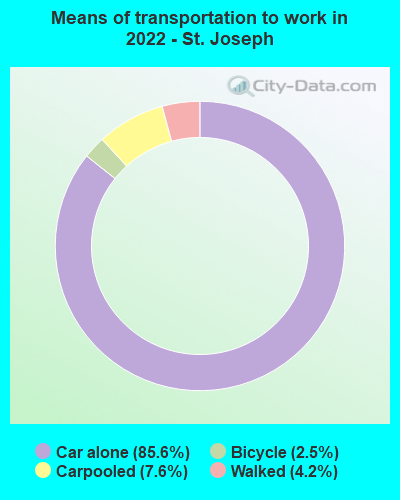
Means of transportation to work:
- Drove a car alone: 474 (51.2%)
- Carpooled: 41 (4.4%)
- Bicycle: 11 (1.2%)
- Walked: 21 (2.3%)
- Worked at home: 510 (55.1%)

- Unemployment by race in 2022
- Unemployment rate for White non-Hispanic residents
- 2.3%Males

- Year of entry for the foreign-born population in St. Joseph, Illinois
- 172010 or later
- 472000 to 2009
- 01990 to 1999
- 01980 to 1989
- 61970 to 1979
- 12Before 1970

First ancestries reported:
- German: 459 (29.6%)
- English: 199 (12.8%)
- Irish: 155 (10.0%)
- American: 153 (9.9%)
- Italian: 103 (6.6%)
- French: 65 (4.2%)
- European: 34 (2.2%)
- Polish: 17 (1.1%)
- Swiss: 15 (1.0%)
- Welsh: 12 (0.8%)
- Belgian: 9 (0.6%)
- Swedish: 9 (0.6%)
- British: 8 (0.5%)
- Scottish: 4 (0.3%)
Most common places of birth for foreign-born residents (%):
| St. Joseph: | 65.8% (50) |
| Illinois: | 4.1% (74,364) |
| St. Joseph: | 13.2% (10) |
| Illinois: | 0.0% (775) |
| St. Joseph: | 9.2% (7) |
| Illinois: | 0.6% (10,943) |
| St. Joseph: | 7.9% (6) |
| Illinois: | 0.5% (8,551) |
Place of birth for U.S.-born residents:
- This state: 3,044
- Other state: 659
- Northeast: 40
- Midwest: 401
- South: 169
- West: 51
91.5% of St. Joseph residents lived in the same house 1 years ago.
Out of people who lived in different houses, 44.1% lived in this county.
Out of people who lived in different counties, 100.0% lived in Illinois.
| St. Joseph: | 91.5% |
| State average: | 88.3% |
Education attainment for males 25 years and older:
- No schooling: 0
- Nursery to 4th grade: 0
- 5th and 6th grade: 0
- 7th and 8th grade: 0
- 9th grade: 0
- 10th grade: 0
- 11th grade: 0
- 12th grade, no diploma: 0
- High school graduate (or equivalency): 320
- Less than 1 year of college: 93
- Some college more than 1 year, no degree: 154
- Associate degree: 139
- Bachelor's degree: 314
- Master's degree: 59
- Professional school degree: 40
- Doctorate degree: 0

Education attainment for females 25 years and older:
- No schooling: 0
- Nursery to 4th grade: 0
- 5th and 6th grade: 0
- 7th and 8th grade: 0
- 9th grade: 0
- 10th grade: 1
- 11th grade: 0
- 12th grade, no diploma: 0
- High school graduate (or equivalency): 321
- Less than 1 year of college: 93
- Some college more than 1 year, no degree: 244
- Associate degree: 266
- Bachelor's degree: 266
- Master's degree: 241
- Professional school degree: 9
- Doctorate degree: 0


Housing units in structures:
- One, detached: 1,365
- One, attached: 29
- Two: 12
- 3 or 4: 61
- 10 to 19: 54
House/condo owner moved in on average 11 years ago
Renter moved in on average 4 years ago

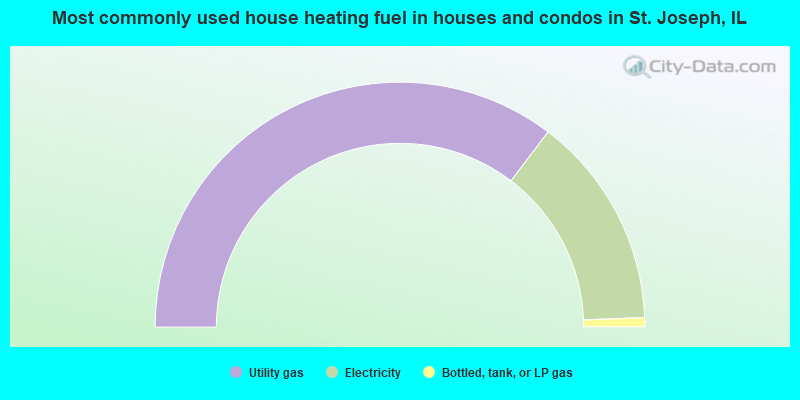
- 70.6%Utility gas
- 28.1%Electricity
- 1.2%Bottled, tank, or LP gas
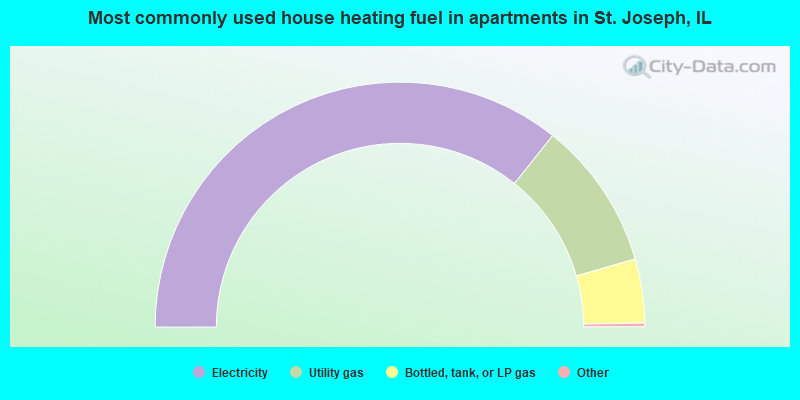
- 71.8%Electricity
- 19.7%Utility gas
- 8.5%Bottled, tank, or LP gas
Private vs. public school enrollment:
| Here: | 12.2% |
| Illinois: | 13.3% |
| Here: | 0.0% |
| Illinois: | 9.9% |
| Here: | 0.0% |
| Illinois: | 27.4% |


