St. Louis Park, MN (Minnesota) Houses and Residents
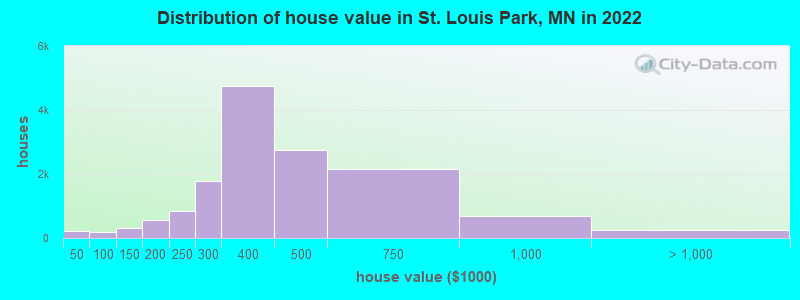
Estimated median house or condo value in 2022: $376,995 (it was $131,900 in 2000 )
St. Louis Park:
$376,995Minnesota:
$314,600
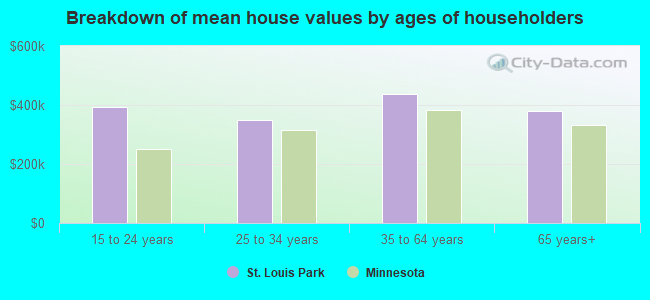
Lower value quartile - upper value quartile: $295,452 - $511,153Mean price in 2022: Detached houses: $437,183 Here:
$437,183State:
$374,552
Townhouses or other attached units: $330,813 Here:
$330,813State:
$312,049
In 2-unit structures: $388,756 Here:
$388,756State:
$323,045
In 3-to-4-unit structures: $239,280 Here:
$239,280State:
$238,971
In 5-or-more-unit structures: $255,967 Here:
$255,967State:
$258,516
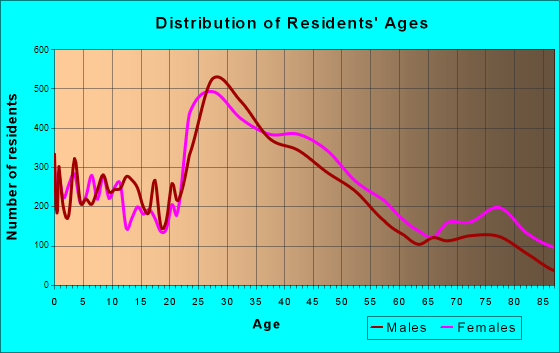
Total population: 47,502 (Urban population: 44,120, Rural population: 0)
Houses: 25,766 (24,721 occupied: 14,503 owner occupied, 10,188 renter occupied )
% of renters here:
41%State:
28%
Housing density: 2,407 houses/condos per square mile
Median price asked for vacant for-sale houses and condos in 2022: $226,917.
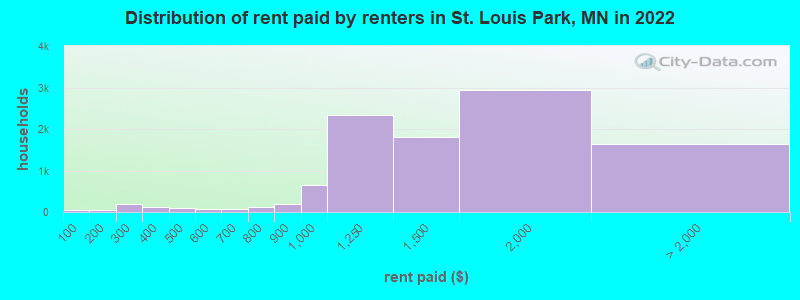
Median contract rent in 2022: $1,392 (lower quartile is $1,096, upper quartile is $1,808)
Median rent asked for vacant for-rent units in 2022: $2,454
Median gross rent in St. Louis Park, MN in 2022: $1,506
Housing units in St. Louis Park with a mortgage: 9,770 (1,009 second mortgage, 3 home equity loan, 825 both second mortgage and home equity loan )Houses without a mortgage: 183
Median household income for houses/condos with a mortgage: $137,894
Median household income for apartments without a mortgage: $76,486
Median monthly housing costs: $1,578
Data:
Median house or condo value ($)
Median house or condo value ($ change since 2000)
Median house or condo value ($) - White
Median house or condo value ($) - Black or African American
Median house or condo value ($) - Asian
Median house or condo value ($) - Hispanic or Latino
Median house or condo value ($) - American Indian and Alaska Native
Median house or condo value ($) - Multirace
Median house or condo value ($) - Other Race
Median price asked for mobile homes ($)
Household density (households per square mile)
Mean house or condo value by units in structure - 1, detached ($)
Mean house or condo value by units in structure - 1, attached ($)
Mean house or condo value by units in structure - 2 ($)
Mean house or condo value by units in structure by units in structure - 3 or 4 ($)
Mean house or condo value by units in structure - 5 or more ($)
Mean house or condo value by units in structure - Boat, RV, van, etc. ($)
Mean house or condo value by units in structure - Mobile home ($)
Median contract rent ($)
Median contract rent - Lower quartile ($)
Median contract rent - Upper quartile ($)
Median gross rent ($)
Urban houses (%)
Rural houses (%)
Houses occupied (%)
Houses occupied (% change since 2000)
Houses owner occupied (%)
Houses owner occupied (% change since 2000)
Houses renter occupied (%)
Houses renter occupied (% change since 2000)
Vacant housing units - For rent (%)
Vacant housing units - For rent (% change since 2000)
Vacant housing units - For sale only (%)
Vacant housing units - For sale only (% change since 2000)
Vacant housing units - Rented or sold, not occupied (%)
Vacant housing units - Rented or sold, not occupied (% change since 2000)
Vacant housing units - For seasonal, recreational, or occasional use (%)
Vacant housing units - For seasonal, recreational, or occasional use (% change since 2000)
Vacant housing units - For migrant workers (%)
Vacant housing units - For migrant workers (% change since 2000)
Vacant housing units - Other vacant (%)
Vacant housing units - Other vacant (% change since 2000)
Median monthly housing costs ($)
Median household income for houses/condos with a mortgage ($)
Median household income for houses/condos without a mortgage ($)
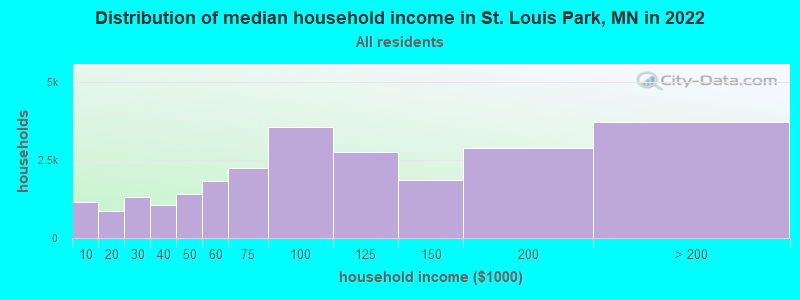
Median household income ($)
Median household income ($) - White
Median household income ($) - Black or African American
Median household income ($) - Asian
Median household income ($) - Hispanic or Latino
Median household income ($) - American Indian and Alaska Native
Median household income ($) - Multirace
Median household income ($) - Other Race
Mortgage status - with mortgage (%)
Mortgage status - with second mortgage (%)
Mortgage status - with home equity loan (%)
Mortgage status - with both second mortgage and home equity loan (%)
Mortgage status - without a mortgage (%)
Median year house/condo built
Median year apartment built
Household type by relationship - Male householder living alone (%)
Household type by relationship - Male householder not living alone (%)
Household type by relationship - Female householder living alone (%)
Household type by relationship - Female householder not living alone (%)
Household type by relationship - Opposite-Sex spouse (%)
Household type by relationship - Same-Sex spouse (%)
Household type by relationship - Opposite-Sex unmarried partner (%)
Household type by relationship - Same-Sex unmarried partner (%)
Household type by relationship - In group quarters (%)
Size of family households - 2-person household (%)
Size of family households - 3-person household (%)
Size of family households - 4-person household (%)
Size of family households - 5-person household (%)
Size of family households - 6-person household (%)
Size of family households - 7-or-more-person household (%)
Size of nonfamily households - 1-person household (%)
Size of nonfamily households - 2-person household (%)
Size of nonfamily households - 3-person household (%)
Size of nonfamily households - 4-person household (%)
Size of nonfamily households - 5-person household (%)
Size of nonfamily households - 6-person household (%)
Size of nonfamily households - 7-or-moreperson household (%)
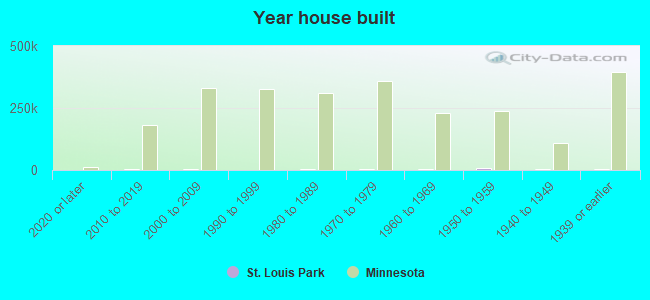
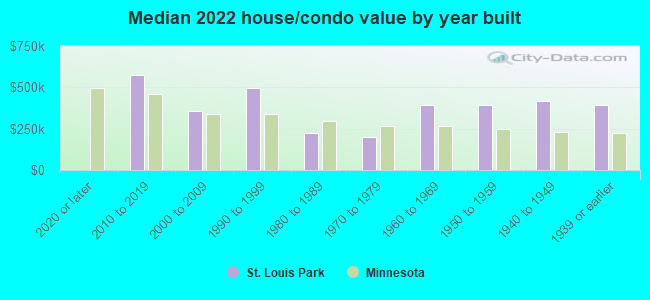
Year house built - Built 2010 or later (%)
Year house built - Built 2000 to 2009 (%)
Year house built - Built 1990 to 1999 (%)
Year house built - Built 1980 to 1989 (%)
Year house built - Built 1970 to 1979 (%)
Year house built - Built 1960 to 1969 (%)
Year house built - Built 1950 to 1959 (%)
Year house built - Built 1940 to 1949 (%)
Year house built - Built 1939 or earlier (%)
Median number of rooms in houses and condos
Median number of rooms in apartments
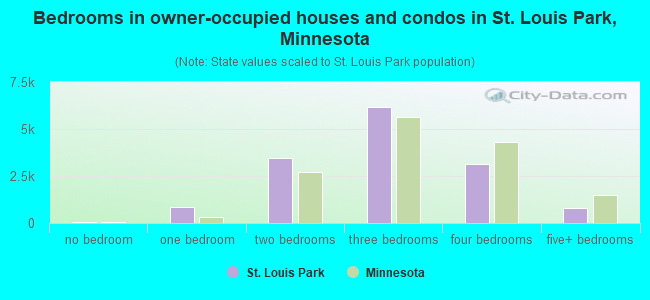
Median number of bedrooms in owner occupied houses
Mean number of bedrooms in owner occupied houses
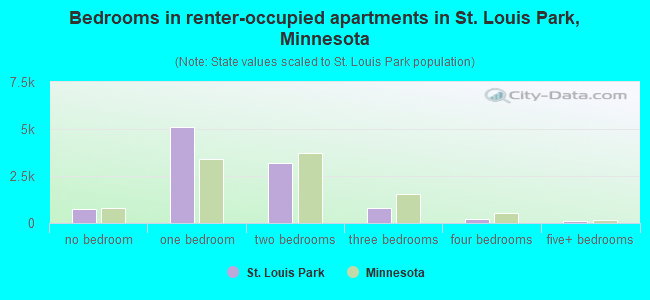
Median number of bedrooms in renter occupied houses
Mean number of bedrooms in renter occupied houses
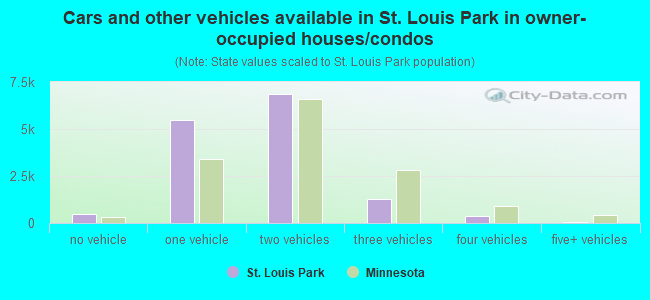
Median number of vehichles in owner occupied houses
Mean number of vehichles in owner occupied houses
Median number of vehichles in renter occupied houses
Mean number of vehichles in renter occupied houses
Rooms in owner-occupied houses - 1 room (%)
Rooms in owner-occupied houses - 2 rooms (%)
Rooms in owner-occupied houses - 3 rooms (%)
Rooms in owner-occupied houses - 4 rooms (%)
Rooms in owner-occupied houses - 5 rooms (%)
Rooms in owner-occupied houses - 6 rooms (%)
Rooms in owner-occupied houses - 7 rooms (%)
Rooms in owner-occupied houses - 8 rooms (%)
Rooms in owner-occupied houses - 9+ rooms (%)
Rooms in renter-occupied houses - 1 room (%)
Rooms in renter-occupied houses - 2 rooms (%)
Rooms in renter-occupied houses - 3 rooms (%)
Rooms in renter-occupied houses - 4 rooms (%)
Rooms in renter-occupied houses - 5 rooms (%)
Rooms in renter-occupied houses - 6 rooms (%)
Rooms in renter-occupied houses - 7 rooms (%)
Rooms in renter-occupied houses - 8 rooms (%)
Rooms in renter-occupied houses - 9+ rooms (%)
Bedrooms in owner-occupied houses - no bedrooms (%)
Bedrooms in owner-occupied houses - 1 bedroom (%)
Bedrooms in owner-occupied houses - 2 bedrooms (%)
Bedrooms in owner-occupied houses - 3 bedrooms (%)
Bedrooms in owner-occupied houses - 4 bedrooms (%)
Bedrooms in owner-occupied houses - 5+ bedrooms (%)
Bedrooms in renter-occupied houses - no bedrooms (%)
Bedrooms in renter-occupied houses - 1 bedroom (%)
Bedrooms in renter-occupied houses - 2 bedrooms (%)
Bedrooms in renter-occupied houses - 3 bedrooms (%)
Bedrooms in renter-occupied houses - 4 bedrooms (%)
Bedrooms in renter-occupied houses - 5+ bedrooms (%)
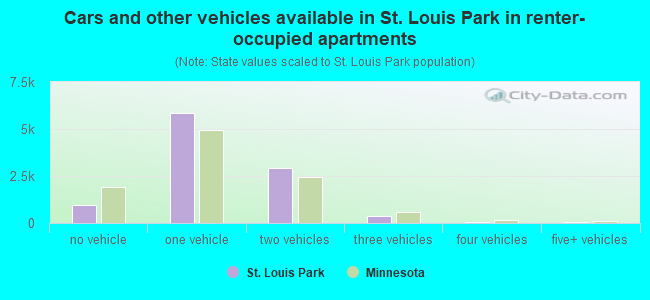
Vehicles available in owner-occupied houses - no vehicle available (%)
Vehicles available in owner-occupied houses - 1 vehicle available(%)
Vehicles available in owner-occupied houses - 2 Vehicles available (%)
Vehicles available in owner-occupied houses - 3 Vehicles available (%)
Vehicles available in owner-occupied houses - 4 Vehicles available (%)
Vehicles available in owner-occupied houses - 5+ Vehicles available (%)
Vehicles available in renter-occupied houses - no vehicle available (%)
Vehicles available in renter-occupied houses - 1 vehicle available (%)
Vehicles available in renter-occupied houses - 2 Vehicles available (%)
Vehicles available in renter-occupied houses - 3 Vehicles available (%)
Vehicles available in renter-occupied houses - 4 Vehicles available (%)
Vehicles available in renter-occupied houses - 5+ Vehicles available (%)
Housing units in structures - 1, detached (%)
Housing units in structures - 1, attached (%)
Housing units in structures - 2 (%)
Housing units in structures - 3 or 4 (%)
Housing units in structures - 5 to 9 (%)
Housing units in structures - 10 to 19 (%)
Housing units in structures - 20 to 49 (%)
Housing units in structures - 50 or more (%)
Housing units in structures - Mobile home (%)
Housing units in structures - Boat, RV, van, etc. (%)
Housing units in structures - Owners - 1, detached (%)
Housing units in structures - Owners - 1, attached (%)
Housing units in structures - Owners - 2 (%)
Housing units in structures - Owners - 3 or 4 (%)
Housing units in structures - Owners - 5 to 9 (%)
Housing units in structures - Owners - 10 to 19 (%)
Housing units in structures - Owners - 20 to 49 (%)
Housing units in structures - Owners - 50 or more (%)
Housing units in structures - Owners - Mobile home (%)
Housing units in structures - Owners - Boat, RV, van, etc. (%)
Housing units in structures - Renters - 1, detached (%)
Housing units in structures - Renters - 1, attached (%)
Housing units in structures - Renters - 2 (%)
Housing units in structures - Renters - 3 or 4 (%)
Housing units in structures - Renters - 5 to 9 (%)
Housing units in structures - Renters - 10 to 19 (%)
Housing units in structures - Renters - 20 to 49 (%)
Housing units in structures - Renters - 50 or more (%)
Housing units in structures - Renters - Mobile home (%)
Housing units in structures - Renters - Boat, RV, van, etc. (%)
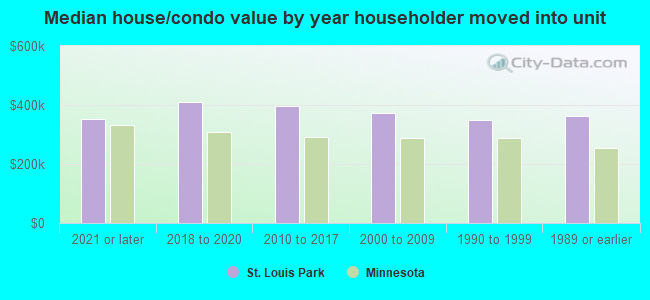
House/condo owner moved in on average (years ago)
Renter moved in on average (years ago)
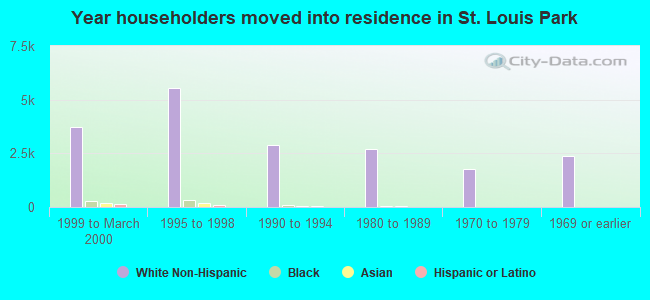
Year householder moved into unit - Moved in 1999 to March 2000 (%)
Year householder moved into unit - Moved in 1999 to March 2000 (%) - White
Year householder moved into unit - Moved in 1999 to March 2000 (%) - Black or African American
Year householder moved into unit - Moved in 1999 to March 2000 (%) - Asian
Year householder moved into unit - Moved in 1999 to March 2000 (%) - Hispanic or Latino
Year householder moved into unit - Moved in 1999 to March 2000 (%) - American Indian and Alaska Native
Year householder moved into unit - Moved in 1999 to March 2000 (%) - Multirace
Year householder moved into unit - Moved in 1999 to March 2000 (%) - Other Race
Year householder moved into unit - Moved in 1995 to 1998 (%)
Year householder moved into unit - Moved in 1995 to 1998 (%) - White
Year householder moved into unit - Moved in 1995 to 1998 (%) - Black or African American
Year householder moved into unit - Moved in 1995 to 1998 (%) - Asian
Year householder moved into unit - Moved in 1995 to 1998 (%) - Hispanic or Latino
Year householder moved into unit - Moved in 1995 to 1998 (%) - American Indian and Alaska Native
Year householder moved into unit - Moved in 1995 to 1998 (%) - Multirace
Year householder moved into unit - Moved in 1995 to 1998 (%) - Other Race
Year householder moved into unit - Moved in 1990 to 1994 (%)
Year householder moved into unit - Moved in 1990 to 1994 (%) - White
Year householder moved into unit - Moved in 1990 to 1994 (%) - Black or African American
Year householder moved into unit - Moved in 1990 to 1994 (%) - Asian
Year householder moved into unit - Moved in 1990 to 1994 (%) - Hispanic or Latino
Year householder moved into unit - Moved in 1990 to 1994 (%) - American Indian and Alaska Native
Year householder moved into unit - Moved in 1990 to 1994 (%) - Multirace
Year householder moved into unit - Moved in 1990 to 1994 (%) - Other Race
Year householder moved into unit - Moved in 1980 to 1989 (%)
Year householder moved into unit - Moved in 1980 to 1989 (%) - White
Year householder moved into unit - Moved in 1980 to 1989 (%) - Black or African American
Year householder moved into unit - Moved in 1980 to 1989 (%) - Asian
Year householder moved into unit - Moved in 1980 to 1989 (%) - Hispanic or Latino
Year householder moved into unit - Moved in 1980 to 1989 (%) - American Indian and Alaska Native
Year householder moved into unit - Moved in 1980 to 1989 (%) - Multirace
Year householder moved into unit - Moved in 1980 to 1989 (%) - Other Race
Year householder moved into unit - Moved in 1970 to 1979 (%)
Year householder moved into unit - Moved in 1970 to 1979 (%) - White
Year householder moved into unit - Moved in 1970 to 1979 (%) - Black or African American
Year householder moved into unit - Moved in 1970 to 1979 (%) - Asian
Year householder moved into unit - Moved in 1970 to 1979 (%) - Hispanic or Latino
Year householder moved into unit - Moved in 1970 to 1979 (%) - American Indian and Alaska Native
Year householder moved into unit - Moved in 1970 to 1979 (%) - Multirace
Year householder moved into unit - Moved in 1970 to 1979 (%) - Other Race
Year householder moved into unit - Moved in 1969 or earlier (%)
Year householder moved into unit - Moved in 1969 or earlier (%) - White
Year householder moved into unit - Moved in 1969 or earlier (%) - Black or African American
Year householder moved into unit - Moved in 1969 or earlier (%) - Asian
Year householder moved into unit - Moved in 1969 or earlier (%) - Hispanic or Latino
Year householder moved into unit - Moved in 1969 or earlier (%) - American Indian and Alaska Native
Year householder moved into unit - Moved in 1969 or earlier (%) - Multirace
Year householder moved into unit - Moved in 1969 or earlier (%) - Other Race
Housing units lacking complete plumbing facilities (%)
Housing units lacking complete kitchen facilities (%)
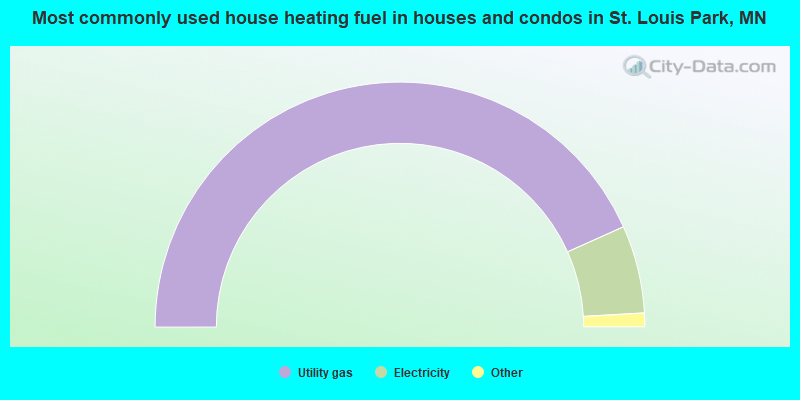
House heating fuel used in houses and condos - Utility gas (%)
House heating fuel used in houses and condos - Bottled, tank, or LP gas (%)
House heating fuel used in houses and condos - Electricity (%)
House heating fuel used in houses and condos - Fuel oil, kerosene, etc. (%)
House heating fuel used in houses and condos - Coal or coke (%)
House heating fuel used in houses and condos - Wood (%)
House heating fuel used in houses and condos - Solar energy (%)
House heating fuel used in houses and condos - Other fuel (%)
House heating fuel used in houses and condos - No fuel used (%)
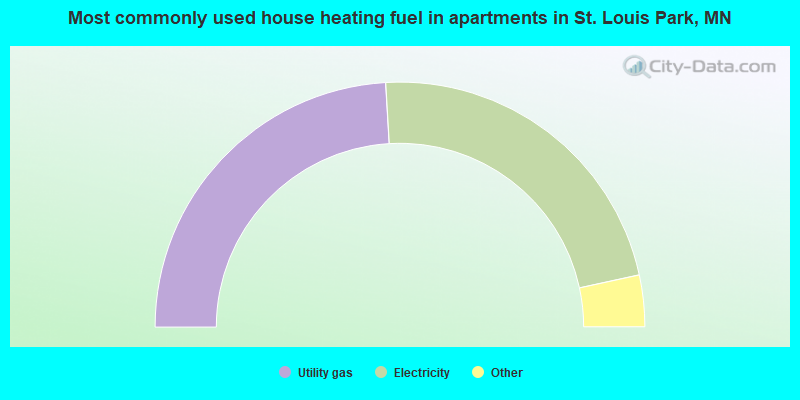
House heating fuel used in apartments - Utility gas (%)
House heating fuel used in apartments - Bottled, tank, or LP gas (%)
House heating fuel used in apartments - Electricity (%)
House heating fuel used in apartments - Fuel oil, kerosene, etc. (%)
House heating fuel used in apartments - Coal or coke (%)
House heating fuel used in apartments - Wood (%)
House heating fuel used in apartments - Solar energy (%)
House heating fuel used in apartments - Other fuel (%)
House heating fuel used in apartments - No fuel used (%)
Median year house/condo built: 1956Median year apartment built: 1983Household type by relationship:
Households: 49,084
Male householders: 11,139 (4,085 living alone ), Female householders: 12,756 (5,932 living alone )8,746 spouses (8,562 opposite-sex spouses ), 2,308 unmarried partners , (2,165 opposite-sex unmarried partners ), 10,060 children (9,757 natural , 147 adopted , 155 stepchildren ), 186 grandchildren , 416 brothers or sisters , 313 parents , 0 foster children , 258 other relatives , 2,121 non-relatives In group quarters: 776
Size of family households: 5,549 2-persons , 2,413 3-persons , 1,874 4-persons , 663 5-persons , 115 6-persons , 106 7-or-more-persons .
Size of nonfamily households: 10,934 1-person , 2,913 2-persons , 249 3-persons , 71 4-persons , 23 5-persons .
6,272 married couples with children. single-parent households (556 men , 1,294 women ).
88.1% of residents of St. Louis Park speak English at home. of residents speak Spanish at home (61% speak English very well , 20% speak English well , 16% speak English not well , 3% don't speak English at all ).of residents speak other Indo-European language at home (60% speak English very well , 9% speak English well , 24% speak English not well , 7% don't speak English at all ).of residents speak Asian or Pacific Island language at home (56% speak English very well , 19% speak English well , 25% speak English not well ).of residents speak other language at home (73% speak English very well , 7% speak English well , 19% speak English not well ).
Foreign born population: 4,331 (8.8%)of them are naturalized citizens )
Median number of rooms in houses and condos:
Median number of rooms in apartments
Owner-occupied Renter-occupied
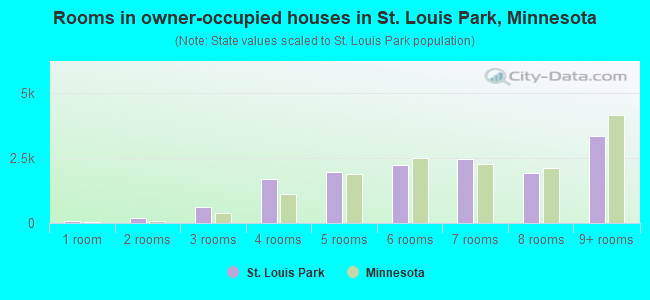
Rooms in owner-occupied houses in St. Louis Park, Minnesota
60 1 room 174 2 rooms 606 3 rooms 1,711 4 rooms 1,977 5 rooms 2,241 6 rooms 2,459 7 rooms 1,925 8 rooms 3,351 9+ rooms
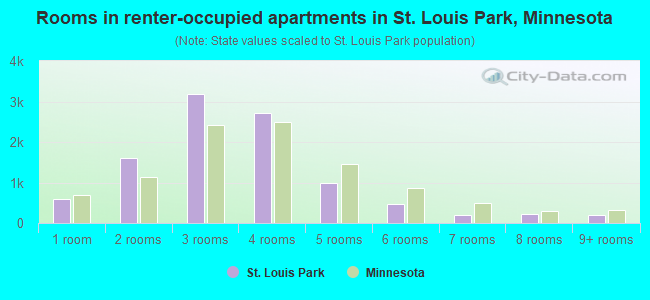
Rooms in renter-occupied apartments in St. Louis Park, Minnesota
595 1 room 1,613 2 rooms 3,193 3 rooms 2,715 4 rooms 989 5 rooms 479 6 rooms 188 7 rooms 213 8 rooms 204 9+ rooms
St. Louis Park, MN household income distribution 1,148 Less than $10,000871 $10,000 to $19,9991,323 $20,000 to $29,9991,051 $30,000 to $39,9991,403 $40,000 to $49,9991,827 $50,000 to $59,9992,237 $60,000 to $74,9993,572 $75,000 to $99,9992,769 $100,000 to $124,9991,846 $125,000 to $149,9992,899 $150,000 to $199,9993,723 $200,000 or more
Home value of owner - occupied houses in 2022 in St. Louis Park, MN 83 Less than $10,00032 $10,000 to $14,9998 $25,000 to $29,99943 $35,000 to $39,99953 $40,000 to $49,99918 $50,000 to $59,99912 $70,000 to $79,99971 $80,000 to $89,99919 $90,000 to $99,999134 $100,000 to $124,999178 $125,000 to $149,999337 $150,000 to $174,999232 $175,000 to $199,999856 $200,000 to $249,9991,770 $250,000 to $299,9994,746 $300,000 to $399,9992,759 $400,000 to $499,9992,162 $500,000 to $749,999686 $750,000 to $999,999179 $1,000,000 to $1,499,9995 $1,500,000 to $1,999,99953 $2,000,000 or moreRent paid by renters in 2022 in St. Louis Park, MN 46 Less than $10042 $150 to $199151 $200 to $24935 $250 to $29956 $300 to $34960 $350 to $39917 $400 to $44982 $450 to $49939 $500 to $54942 $550 to $59910 $600 to $64958 $650 to $69944 $700 to $74969 $750 to $799201 $800 to $899644 $900 to $9992,343 $1,000 to $1,2491,813 $1,250 to $1,4992,945 $1,500 to $1,999865 $2,000 to $2,499405 $2,500 to $2,999134 $3,000 to $3,49951 $3,500 or more172 No cash rent
Percentage of workers working in this county: 87.9%Number of people working at home: 8,258 (27.4% of all workers )
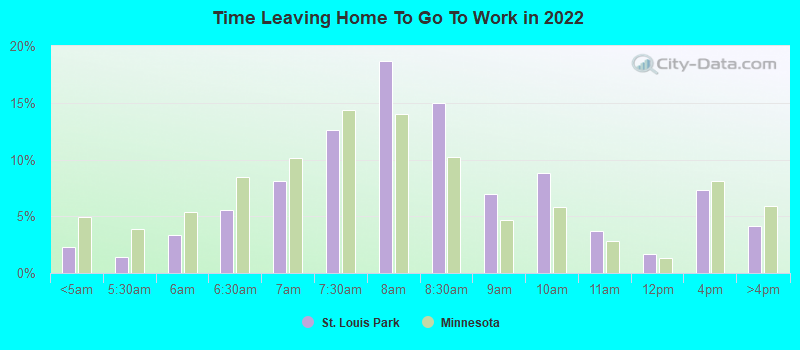
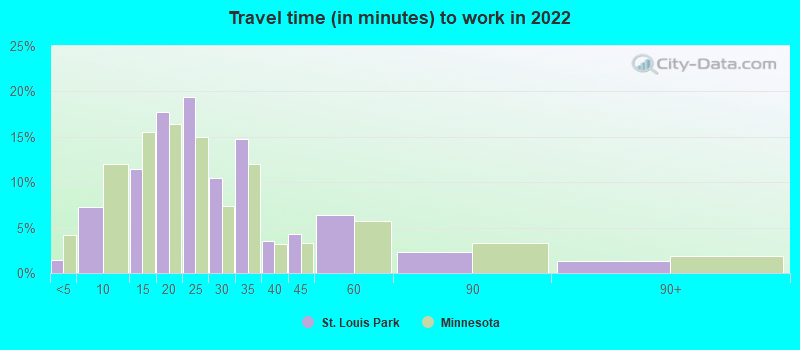
Travel time to work (commute)
Less than 5 minutes: 3435 to 9 minutes: 2,62110 to 14 minutes: 3,62815 to 19 minutes: 4,92320 to 24 minutes: 5,05925 to 29 minutes: 1,76530 to 34 minutes: 2,35735 to 39 minutes: 40840 to 44 minutes: 46445 to 59 minutes: 35960 to 89 minutes: 29090 or more minutes: 262
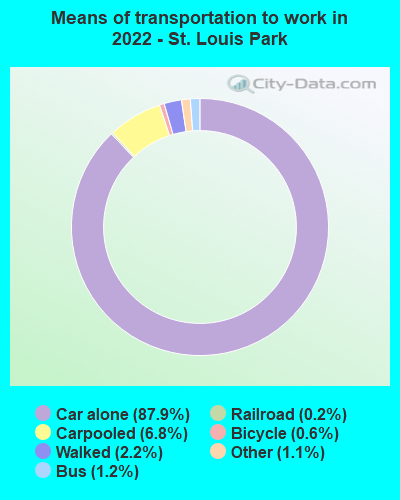
Means of transportation to work:
Drove a car alone: 27,306 (70.9%)Carpooled: 2,092 (5.4%)Bus : 219 (0.6%)Light rail, streetcar or trolley : 78 (0.2%)Taxi: 442 (1.1%)Bicycle: 174 (0.5%)Walked: 656 (1.7%)Worked at home: 8,258 (21.5%)
Unemployment by race in 2022
Unemployment rate for White non-Hispanic residents 2.1% Males1.6% FemalesUnemployment rate for Black residents 2.0% Males3.4% FemalesUnemployment rate for Asian residents 3.0% Males0.5% FemalesUnemployment rate for other race residents 2.1% Males13.3% FemalesUnemployment rate for two or more race residents 5.2% MalesUnemployment rate for Hispanic or Latino residents 13.1% Males2.4% Females
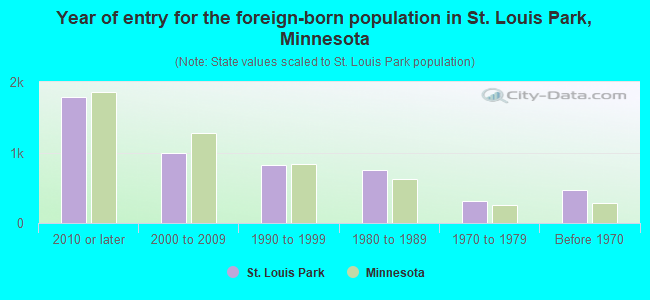
Year of entry for the foreign-born population in St. Louis Park, Minnesota
1,793 2010 or later 986 2000 to 2009 820 1990 to 1999 754 1980 to 1989 314 1970 to 1979 461 Before 1970
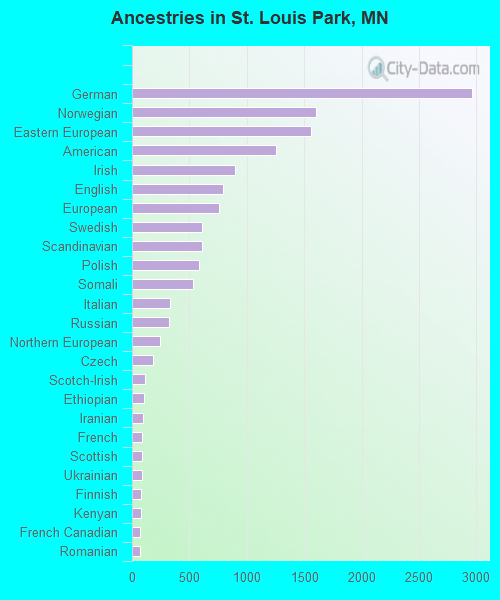
First ancestries reported:
German: 2,962 (15.0%)
Norwegian: 1,600 (8.1%)
Eastern European: 1,563 (7.9%)
American: 1,258 (6.4%)
Irish: 896 (4.5%)
English: 792 (4.0%)
European: 757 (3.8%)
Swedish: 614 (3.1%)
Scandinavian: 611 (3.1%)
Polish: 580 (2.9%)
Somali: 531 (2.7%)
Italian: 330 (1.7%)
Russian: 324 (1.6%)
Northern European: 246 (1.2%)
Czech: 185 (0.9%)
Scotch-Irish: 109 (0.6%)
Ethiopian: 103 (0.5%)
Iranian: 96 (0.5%)
French: 89 (0.4%)
Scottish: 87 (0.4%)
Ukrainian: 87 (0.4%)
Finnish: 81 (0.4%)
Kenyan: 76 (0.4%)
French Canadian: 72 (0.4%)
Romanian: 69 (0.3%)
Nigerian: 68 (0.3%)
Slovene: 67 (0.3%)
Dutch: 58 (0.3%)
Croatian: 55 (0.3%)
Slovak: 55 (0.3%)
Danish: 52 (0.3%)
British: 51 (0.3%)
Greek: 48 (0.2%)
Luxembourger: 42 (0.2%)
Brazilian: 41 (0.2%)
Belgian: 38 (0.2%)
African: 38 (0.2%)
West Indian: 35 (0.2%)
Lebanese: 35 (0.2%)
Latvian: 34 (0.2%)
Canadian: 33 (0.2%)
Carpatho Rusyn: 26 (0.1%)
Haitian: 25 (0.1%)
Lithuanian: 21 (0.1%)
Guyanese: 20 (0.1%)
Bulgarian: 18 (0.09%)
Australian: 17 (0.09%)
German Russian: 17 (0.09%)
Czechoslovakian: 15 (0.08%)
Belizean: 13 (0.07%)
Armenian: 11 (0.06%)
Jordanian: 11 (0.06%)
Israeli: 10 (0.05%)
Moroccan: 9 (0.05%)
Zimbabwean: 9 (0.05%)
Swiss: 9 (0.05%)
Jamaican: 7 (0.04%)
Pennsylvania German: 6 (0.03%)
Austrian: 4 (0.02%)
Welsh: 4 (0.02%)
Hungarian: 2 (0.01%)
Liberian: 2 (0.01%)
Ghanaian: 2 (0.01%)
Most common places of birth for foreign-born residents (%): Somalia St. Louis Park:
6.8% (315)Minnesota:
8.0% (38,461)
India St. Louis Park:
6.3% (293)Minnesota:
6.7% (32,141)
Canada St. Louis Park:
5.8% (269)Minnesota:
2.5% (11,939)
Nepal St. Louis Park:
5.3% (243)Minnesota:
0.6% (3,038)
Ecuador St. Louis Park:
4.9% (227)Minnesota:
1.8% (8,438)
Korea St. Louis Park:
4.6% (211)Minnesota:
2.4% (11,675)
China, excluding Hong Kong and Taiwan St. Louis Park:
4.5% (210)Minnesota:
3.6% (17,119)
Philippines St. Louis Park:
4.3% (198)Minnesota:
2.0% (9,850)
Moldova St. Louis Park:
4.1% (188)Minnesota:
0.4% (1,779)
Kenya St. Louis Park:
4.1% (188)Minnesota:
3.3% (15,701)
Russia St. Louis Park:
3.9% (178)Minnesota:
1.3% (6,329)
Mexico St. Louis Park:
3.8% (175)Minnesota:
12.1% (58,312)
Ukraine St. Louis Park:
2.7% (124)Minnesota:
1.0% (4,646)
Ethiopia St. Louis Park:
2.5% (117)Minnesota:
5.1% (24,630)
Thailand St. Louis Park:
2.5% (116)Minnesota:
4.0% (19,333)
England St. Louis Park:
1.6% (73)Minnesota:
0.5% (2,636)
Germany St. Louis Park:
1.6% (72)Minnesota:
1.4% (6,670)
Belarus St. Louis Park:
1.6% (72)Minnesota:
0.3% (1,358)
Place of birth for U.S.-born residents:
This state: 29,179Other state: 15,118Northeast: 1,882Midwest: 8,840South: 2,778West: 1,679 83.4% of St. Louis Park residents lived in the same house 1 years ago.
Out of people who lived in different houses, 35.0% lived in this county.
Out of people who lived in different counties, 47.0% lived in Minnesota.
St. Louis Park:
83.4%State average:
87.4%
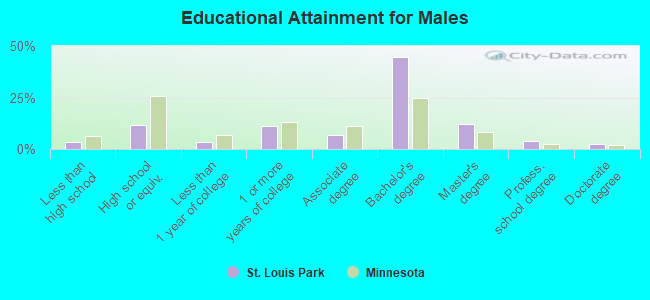
Education attainment for males 25 years and older:
No schooling: 217Nursery to 4th grade: 05th and 6th grade: 07th and 8th grade: 849th grade: 2710th grade: 2111th grade: 1812th grade, no diploma: 225High school graduate (or equivalency): 2,026Less than 1 year of college: 599Some college more than 1 year, no degree: 1,945Associate degree: 1,225Bachelor's degree: 7,827Master's degree: 2,153Professional school degree: 693Doctorate degree: 446
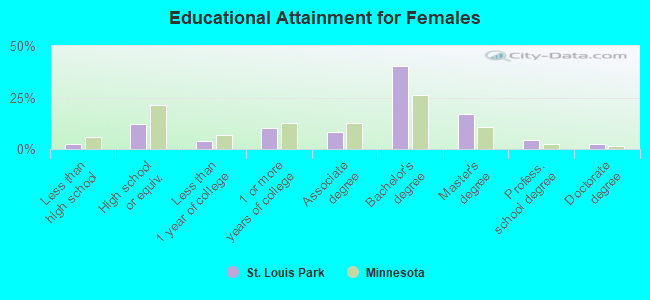
Education attainment for females 25 years and older:
No schooling: 150Nursery to 4th grade: 85th and 6th grade: 127th and 8th grade: 169th grade: 310th grade: 311th grade: 9112th grade, no diploma: 156High school graduate (or equivalency): 2,417Less than 1 year of college: 788Some college more than 1 year, no degree: 2,008Associate degree: 1,606Bachelor's degree: 8,003Master's degree: 3,391Professional school degree: 836Doctorate degree: 482
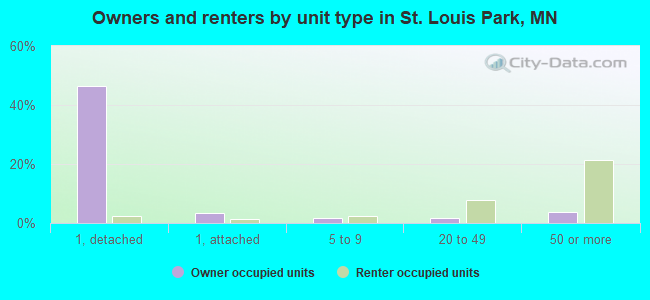
Housing units in structures:
One, detached: 12,474One, attached: 1,362Two: 3323 or 4: 2335 to 9: 1,00910 to 19: 1,66320 to 49: 2,34750 or more: 6,297Mobile homes: 45Housing units lacking complete plumbing facilities in 2022: 0.1%Housing units lacking complete kitchen facilities in 2022: 0.4%House/condo owner moved in on average 11 years ago
Renter moved in on average 1 years ago
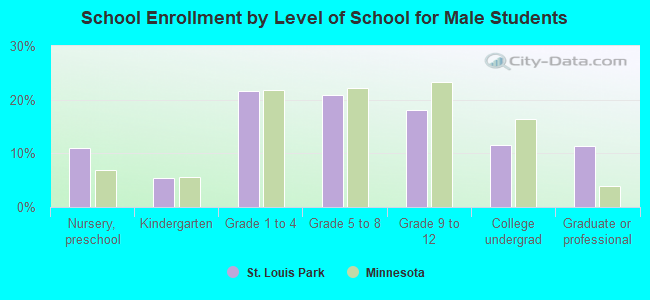
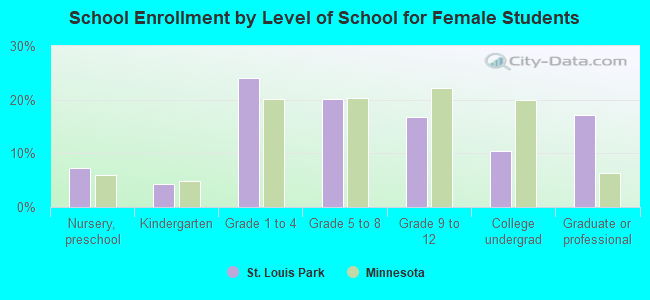
Private vs. public school enrollment:
Students in private schools in grades 1 to 8 (elementary and middle school): 1,029 Here:
26.6%Minnesota:
12.9%
Students in private schools in grades 9 to 12 (high school): 204 Students in private undergraduate colleges: 212 Here:
22.3%Minnesota:
26.2%