St. Lucie, FL (Florida) Houses and Residents
| St. Lucie: | $516,411 |
| Florida: | $354,100 |
Total population: 609 (All urban)
Houses: 391 (321 occupied: 258 owner occupied, 59 renter occupied)
| % of renters here: | 19% |
| State: | 33% |
Housing density: 483 houses/condos per square mile
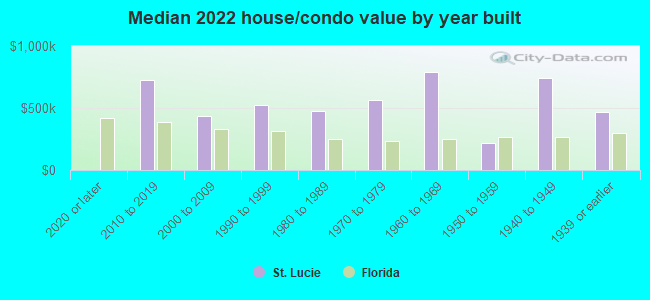
Median price asked for vacant for-sale houses and condos in 2022: $913,763.
Median contract rent in 2022: $962 (lower quartile is $689, upper quartile is $1,531)
Median rent asked for vacant for-rent units in 2022: $2,947
Median gross rent in St. Lucie, FL in 2022: $1,260
Housing units in St. Lucie with a mortgage: 132 (9 second mortgage, 4 home equity loan, 5 both second mortgage and home equity loan)
Houses without a mortgage: 8
Median household income for houses/condos with a mortgage: $90,281
Median household income for apartments without a mortgage: $86,224
Median monthly housing costs: $1,262
Compare current foreclosures near St. Lucie, FL:
| Photo | Address | Area | Beds / Baths | Price | Details |
|---|---|---|---|---|---|

|
#1
Bent Pine Dr
Fort Pierce, FL 34951
|
1,710 sq. feet
|
2 baths 3 beds |
$305,000
|
show details |

|
#2
SW Timber Ridge Tr Unit 1
Vero Beach, FL 32962
|
1,368 sq. feet
|
2 baths 3 beds |
$285,000
|
show details |

|
#3
45th Pl
Vero Beach, FL 32967
|
672 sq. feet
|
1 baths 2 beds |
$94,900
|
show details |

|
#4
N 42nd Cir Apt 205
Vero Beach, FL 32967
|
815 sq. feet
|
1 baths 1 beds |
$200,000
|
show details |

|
#5
34th Ave
Vero Beach, FL 32967
|
- sq. feet
|
1 baths 2 beds |
$42,900
|
show details |

|
#6
2nd Ct SE
Vero Beach, FL 32962
|
- sq. feet
|
1 baths 3 beds |
show details | |

|
#7
Santa Clara Blvd
Fort Pierce, FL 34951
|
1,743 sq. feet
|
2 baths 3 beds |
show details | |

|
#8
Ave
Port Saint Lucie, FL 34983
|
988 sq. feet
|
2 baths 2 beds |
show details | |

|
#9
4th Ln
Vero Beach, FL 32962
|
2,976 sq. feet
|
4 baths 4 beds |
show details | |

|
#10
19th St SW
Vero Beach, FL 32962
|
1,056 sq. feet
|
2 baths 2 beds |
show details |
| Photo | Address | Area | Beds / Baths | Price | Details |
|---|---|---|---|---|---|

|
#11
Loggerhead Pl
Fort Pierce, FL 34949
|
1,824 sq. feet
|
2 baths 4 beds |
show details | |

|
#12
SW Sultan Dr
Port Saint Lucie, FL 34953
|
1,680 sq. feet
|
2 baths 3 beds |
show details | |

|
#13
SW Cleary Ter
Port Saint Lucie, FL 34953
|
1,795 sq. feet
|
2 baths 4 beds |
show details | |

|
#14
St
Port Saint Lucie, FL 34987
|
2,034 sq. feet
|
2 baths 4 beds |
show details | |

|
#15
SW Dinner St
Port Saint Lucie, FL 34953
|
1,172 sq. feet
|
2 baths 3 beds |
show details | |

|
#16
NW Avens St
Port Saint Lucie, FL 34983
|
1,739 sq. feet
|
2 baths 3 beds |
show details | |

|
#17
NW Groveland Ter
Port Saint Lucie, FL 34986
|
2,444 sq. feet
|
3 baths 4 beds |
show details | |

|
#18
SW Salzedo Ave
Port Saint Lucie, FL 34987
|
2,005 sq. feet
|
2 baths 3 beds |
show details | |

|
#19
NW Winfield Dr
Port Saint Lucie, FL 34986
|
2,699 sq. feet
|
3 baths 5 beds |
show details | |

|
#20
NW Jorgensen Rd
Port Saint Lucie, FL 34983
|
913 sq. feet
|
1 baths 2 beds |
show details |
| Photo | Address | Area | Beds / Baths | Price | Details |
|---|---|---|---|---|---|

|
#21
NW Avens St
Port Saint Lucie, FL 34983
|
2,925 sq. feet
|
2 baths 5 beds |
show details | |

|
#22
SW Ember St
Port Saint Lucie, FL 34953
|
1,240 sq. feet
|
2 baths 3 beds |
show details | |

|
#23
NW Avens St
Port Saint Lucie, FL 34983
|
1,232 sq. feet
|
2 baths 3 beds |
show details | |

|
#24
NE Glentry Ave
Port Saint Lucie, FL 34983
|
1,485 sq. feet
|
2 baths 3 beds |
show details | |

|
#25
7th Ln
Vero Beach, FL 32968
|
1,320 sq. feet
|
2 baths 2 beds |
show details | |

|
#26
NW Virginia St
Port Saint Lucie, FL 34983
|
1,456 sq. feet
|
2 baths 3 beds |
show details | |

|
#27
SW Cordova St
Port Saint Lucie, FL 34987
|
1,032 sq. feet
|
2 baths 3 beds |
show details | |

|
#28
NE Genesee Ave
Port Saint Lucie, FL 34983
|
988 sq. feet
|
2 baths 2 beds |
show details | |

|
#29
NW Archer Ave
Port Saint Lucie, FL 34983
|
1,704 sq. feet
|
2 baths 3 beds |
show details | |

|
#30
SW Monterrey Ln
Port Saint Lucie, FL 34953
|
1,908 sq. feet
|
3 baths 4 beds |
show details |
| Photo | Address | Area | Beds / Baths | Price | Details |
|---|---|---|---|---|---|

|
#31
SW Coleman Ave
Port Saint Lucie, FL 34953
|
1,790 sq. feet
|
2 baths 3 beds |
show details | |

|
#32
SW Colorado Ave
Port Saint Lucie, FL 34953
|
1,384 sq. feet
|
2 baths 3 beds |
show details | |

|
#33
SW Colorado Ave
Port Saint Lucie, FL 34953
|
1,986 sq. feet
|
2 baths 3 beds |
show details | |

|
#34
NW Biscayne Dr
Port Saint Lucie, FL 34983
|
1,070 sq. feet
|
2 baths 3 beds |
show details | |

|
#35
SW Starfish Ave
Port Saint Lucie, FL 34984
|
1,135 sq. feet
|
2 baths 3 beds |
show details | |

|
#36
NW Ravenswood Ln
Port Saint Lucie, FL 34983
|
2,236 sq. feet
|
2 baths 4 beds |
show details | |

|
#37
NW Springview Loop
Port Saint Lucie, FL 34986
|
1,912 sq. feet
|
2 baths 3 beds |
show details | |

|
#38
Riomar Dr
Port Saint Lucie, FL 34952
|
1,107 sq. feet
|
2 baths 2 beds |
show details | |

|
#39
NW Brookville Ct
Port Saint Lucie, FL 34986
|
2,265 sq. feet
|
2 baths 3 beds |
show details | |

|
#40
NW Pleasant Grove Way
Port Saint Lucie, FL 34986
|
2,431 sq. feet
|
2 baths 3 beds |
show details |
| Photo | Address | Area | Beds / Baths | Price | Details |
|---|---|---|---|---|---|

|
#41
SE Oxmoor Ter
Port Saint Lucie, FL 34952
|
1,249 sq. feet
|
2 baths 2 beds |
show details | |

|
#42
SW Abbey Ave
Port Saint Lucie, FL 34953
|
1,463 sq. feet
|
2 baths 3 beds |
show details | |

|
#43
SW Estaugh Ave
Port Saint Lucie, FL 34953
|
1,325 sq. feet
|
2 baths 3 beds |
show details | |

|
#44
SE Grand Dr
Port Saint Lucie, FL 34952
|
1,994 sq. feet
|
2 baths 3 beds |
show details | |

|
#45
SE Grand Dr
Port Saint Lucie, FL 34952
|
1,644 sq. feet
|
2 baths 4 beds |
show details | |

|
#46
NW Cornell Ave
Port Saint Lucie, FL 34983
|
912 sq. feet
|
2 baths 2 beds |
show details | |

|
#47
SE Grand Dr
Port Saint Lucie, FL 34952
|
1,644 sq. feet
|
2 baths 4 beds |
show details | |

|
#48
NW Gisela St
Port Saint Lucie, FL 34986
|
1,401 sq. feet
|
2 baths 3 beds |
show details | |

|
#49
NW Cornell Ave
Port Saint Lucie, FL 34983
|
1,171 sq. feet
|
2 baths 3 beds |
show details | |

|
Check over 1 million property listings on Foreclosure.com!
|
browse all offers | |||

 | Apartments in the Port St. Lucie area (4 replies) |
| Port St. Lucie Open House Map (0 replies) |
| Minto homes in Port St. Lucie (0 replies) |
| Buying vs condo vs renting apartment (12 replies) |
| Any Home School Groups in Port St. Lucie (7 replies) |
| Port St. Lucie Renting with dogs and swimming (9 replies) |

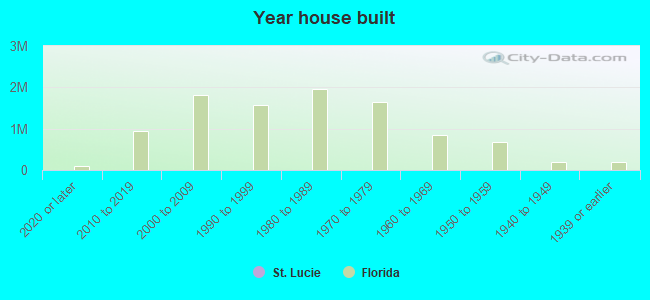
Median year apartment built: 1962
Household type by relationship:
Households: 898- Male householders: 188 (32 living alone), Female householders: 132 (36 living alone)
189 spouses (186 opposite-sex spouses), 38 unmarried partners, (38 opposite-sex unmarried partners), 234 children (202 natural, 4 adopted, 27 stepchildren), 38 grandchildren, 0 brothers or sisters, 13 parents, 0 foster children, 20 other relatives, 40 non-relatives
Size of family households: 113 2-persons, 35 3-persons, 48 4-persons, 9 5-persons, 10 6-persons, 8 7-or-more-persons.
Size of nonfamily households: 72 1-person, 18 2-persons.
146 married couples with children.
12 single-parent households (12 men, 0 women).
95.1% of residents of St. Lucie speak English at home.
2.4% of residents speak Spanish at home (100% speak English very well).
0.2% of residents speak other Indo-European language at home (100% speak English very well).
0.5% of residents speak Asian or Pacific Island language at home (100% speak English very well).
Foreign born population: 22 (2.4%)
(90.9% of them are naturalized citizens)
| Here: | 6.9 |
| State: | 5.9 |
| Here: | 4.5 |
| State: | 4.2 |

- Bedrooms in owner-occupied houses and condos in St. Lucie, Florida
- 3no bedroom
- 31 bedroom
- 392 bedrooms
- 1443 bedrooms
- 594 bedrooms
- 105+ bedrooms
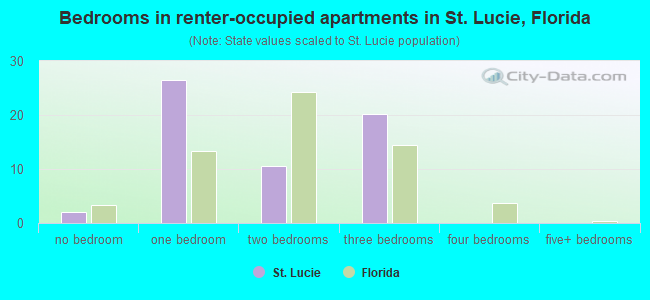
- Bedrooms in renter-occupied apartments in St. Lucie, Florida
- 2no bedroom
- 271 bedroom
- 112 bedrooms
- 203 bedrooms
- 04 bedrooms
- 05+ bedrooms
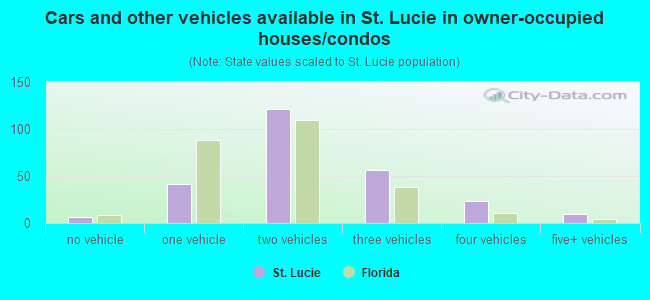
- Cars and other vehicles available in St. Lucie in owner-occupied houses/condos
- 6no vehicle
- 421 vehicle
- 1212 vehicles
- 563 vehicles
- 234 vehicles
- 105+ vehicles
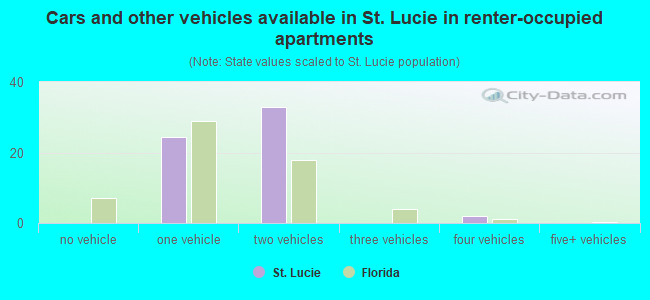
- Cars and other vehicles available in St. Lucie in renter-occupied apartments
- 0no vehicle
- 241 vehicle
- 332 vehicles
- 03 vehicles
- 24 vehicles
- 05+ vehicles
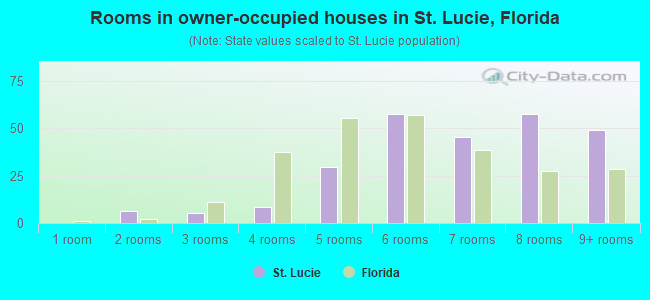
- Rooms in owner-occupied houses in St. Lucie, Florida
- 01 room
- 62 rooms
- 53 rooms
- 84 rooms
- 305 rooms
- 576 rooms
- 467 rooms
- 578 rooms
- 499+ rooms
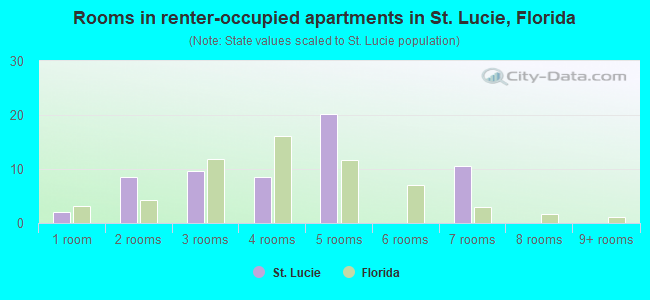
- Rooms in renter-occupied apartments in St. Lucie, Florida
- 21 room
- 82 rooms
- 103 rooms
- 84 rooms
- 205 rooms
- 06 rooms
- 117 rooms
- 08 rooms
- 09+ rooms


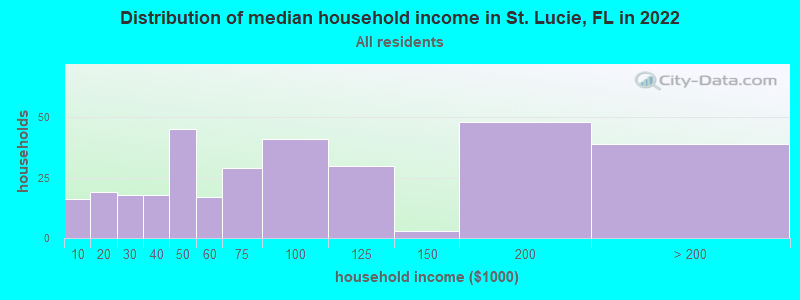
St. Lucie, FL household income distribution

- 16Less than $10,000
- 19$10,000 to $19,999
- 18$20,000 to $29,999
- 18$30,000 to $39,999
- 45$40,000 to $49,999
- 17$50,000 to $59,999
- 29$60,000 to $74,999
- 41$75,000 to $99,999
- 30$100,000 to $124,999
- 3$125,000 to $149,999
- 48$150,000 to $199,999
- 39$200,000 or more
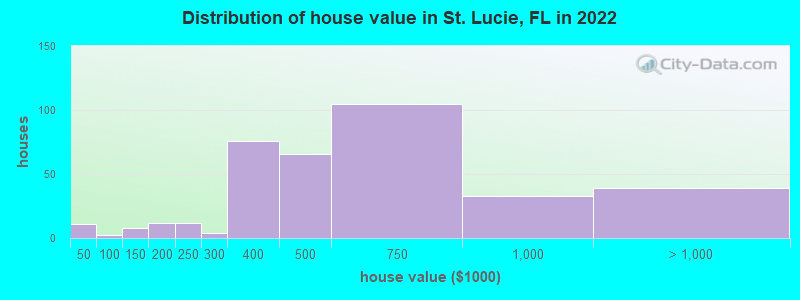
Home value of owner - occupied houses in 2022 in St. Lucie, FL
-
- 11$30,000 to $34,999
- 1$80,000 to $89,999
- 7$100,000 to $124,999
- 0$125,000 to $149,999
- 7$150,000 to $174,999
- 4$175,000 to $199,999
- 12$200,000 to $249,999
- 4$250,000 to $299,999
- 75$300,000 to $399,999
- 66$400,000 to $499,999
- 105$500,000 to $749,999
- 33$750,000 to $999,999
- 28$1,000,000 to $1,499,999
- 7$1,500,000 to $1,999,999
- 3$2,000,000 or more
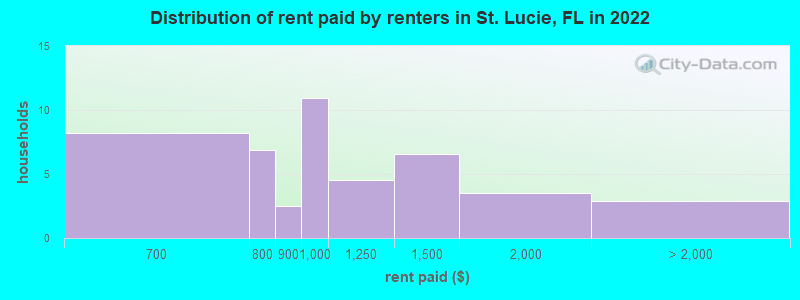
Rent paid by renters in 2022 in St. Lucie, FL
-
- 2$600 to $649
- 5$650 to $699
- 6$700 to $749
- 2$800 to $899
- 10$900 to $999
- 4$1,000 to $1,249
- 6$1,250 to $1,499
- 3$1,500 to $1,999
- 2$2,500 to $2,999
Percentage of workers working in this county: 79.8%
Number of people working at home: 33 (8.9% of all workers)
Travel time to work (commute)
- Less than 5 minutes: 5
- 5 to 9 minutes: 35
- 10 to 14 minutes: 90
- 15 to 19 minutes: 48
- 20 to 24 minutes: 87
- 25 to 29 minutes: 8
- 30 to 34 minutes: 16
- 35 to 39 minutes: 5
- 40 to 44 minutes: 14
- 45 to 59 minutes: 0
- 60 to 89 minutes: 5
- 90 or more minutes: 8
Means of transportation to work:
- Drove a car alone: 252 (74.1%)
- Carpooled: 67 (19.7%)
- Motorcycle: 2 (0.6%)
- Bicycle: 2 (0.6%)
- Walked: 2 (0.6%)
- Other means: 6 (1.8%)
- Worked at home: 9 (2.6%)
- Unemployment by race in 2022
- Unemployment rate for White non-Hispanic residents
- 2.7%Males
- 1.8%Females
- Unemployment rate for Hispanic or Latino residents
- 12.0%Males
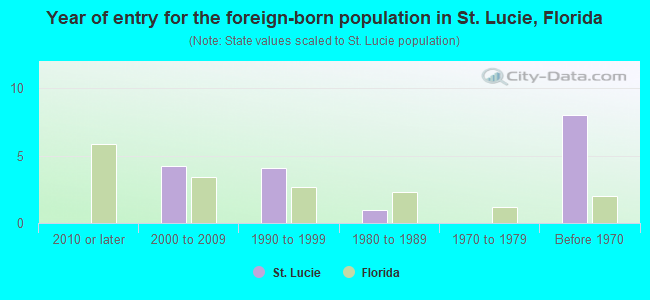
- Year of entry for the foreign-born population in St. Lucie, Florida
- 02010 or later
- 42000 to 2009
- 41990 to 1999
- 11980 to 1989
- 01970 to 1979
- 8Before 1970
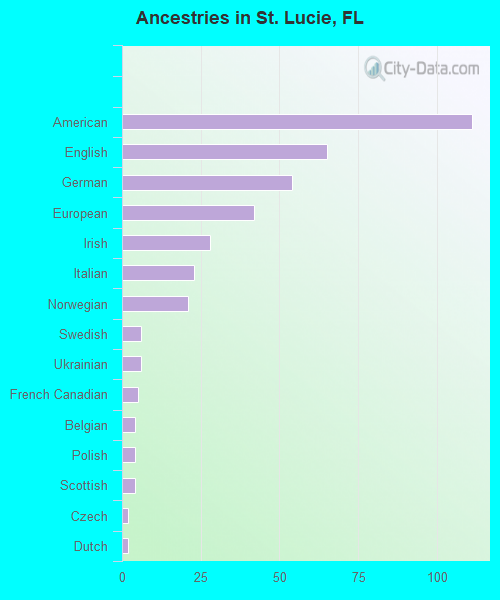
First ancestries reported:
- American: 111 (25.8%)
- English: 65 (15.1%)
- German: 54 (12.6%)
- European: 42 (9.8%)
- Irish: 28 (6.5%)
- Italian: 23 (5.3%)
- Norwegian: 21 (4.9%)
- Swedish: 6 (1.4%)
- Ukrainian: 6 (1.4%)
- French Canadian: 5 (1.2%)
- Belgian: 4 (0.9%)
- Polish: 4 (0.9%)
- Scottish: 4 (0.9%)
- Czech: 2 (0.5%)
- Dutch: 2 (0.5%)
- Northern European: 1 (0.2%)
Most common places of birth for foreign-born residents (%):
| St. Lucie: | 28.6% (6) |
| Florida: | 5.6% (257,152) |
| St. Lucie: | 19.0% (4) |
| Florida: | 1.8% (84,403) |
| St. Lucie: | 9.5% (2) |
| Florida: | 1.2% (56,071) |
| St. Lucie: | 9.5% (2) |
| Florida: | 1.2% (54,585) |
| St. Lucie: | 9.5% (2) |
| Florida: | 2.4% (109,132) |
| St. Lucie: | 4.8% (1) |
| Florida: | 0.7% (30,755) |
Place of birth for U.S.-born residents:
- This state: 503
- Other state: 368
- Northeast: 139
- Midwest: 97
- South: 92
- West: 34
91.4% of St. Lucie residents lived in the same house 1 years ago.
Out of people who lived in different houses, 35.8% lived in this county.
Out of people who lived in different counties, 73.9% lived in Florida.
| St. Lucie: | 91.4% |
| State average: | 86.3% |
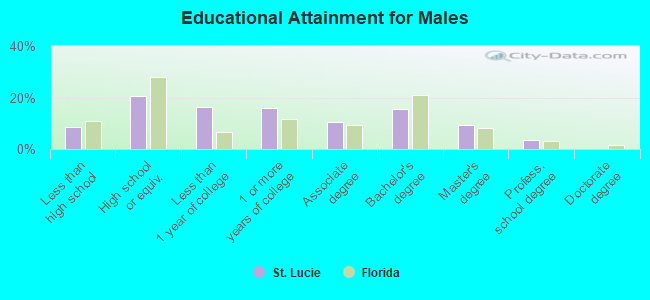
Education attainment for males 25 years and older:
- No schooling: 0
- Nursery to 4th grade: 0
- 5th and 6th grade: 4
- 7th and 8th grade: 8
- 9th grade: 0
- 10th grade: 1
- 11th grade: 5
- 12th grade, no diploma: 10
- High school graduate (or equivalency): 67
- Less than 1 year of college: 53
- Some college more than 1 year, no degree: 52
- Associate degree: 34
- Bachelor's degree: 51
- Master's degree: 30
- Professional school degree: 11
- Doctorate degree: 0
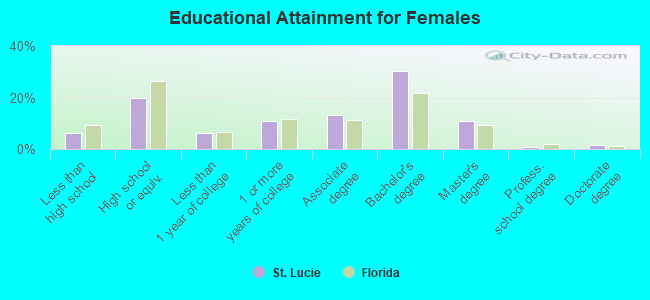
Education attainment for females 25 years and older:
- No schooling: 0
- Nursery to 4th grade: 0
- 5th and 6th grade: 0
- 7th and 8th grade: 0
- 9th grade: 0
- 10th grade: 10
- 11th grade: 3
- 12th grade, no diploma: 6
- High school graduate (or equivalency): 62
- Less than 1 year of college: 20
- Some college more than 1 year, no degree: 34
- Associate degree: 42
- Bachelor's degree: 96
- Master's degree: 34
- Professional school degree: 3
- Doctorate degree: 5


Housing units in structures:
- One, detached: 339
- One, attached: 12
- Two: 18
- 3 or 4: 16
- 5 to 9: 5
Housing units lacking complete kitchen facilities in 2022: 1.4%
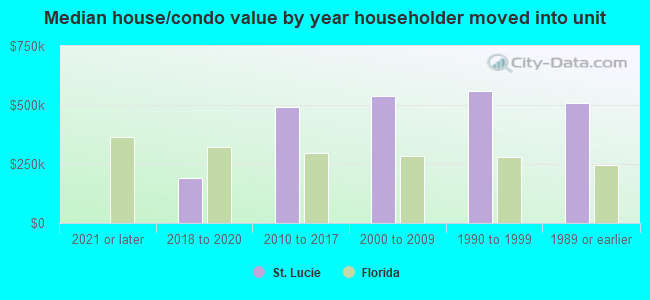
House/condo owner moved in on average 17 years ago
Renter moved in on average 3 years ago

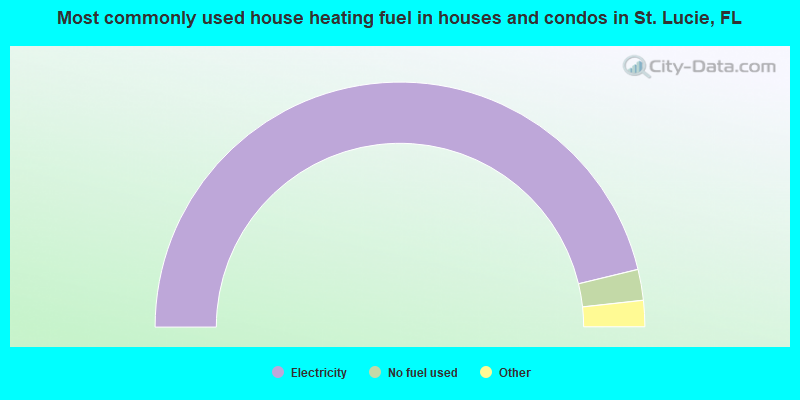
- 93.0%Electricity
- 4.1%No fuel used
- 1.6%Wood
- 1.2%Bottled, tank, or LP gas
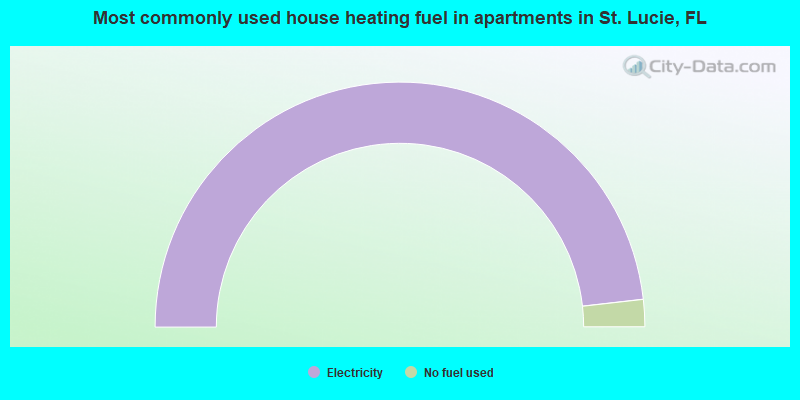
- 96.4%Electricity
- 3.6%No fuel used
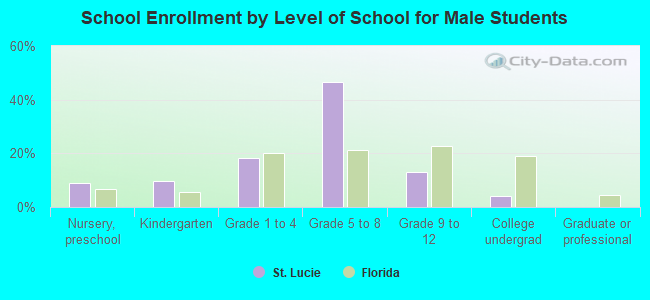
Private vs. public school enrollment:
| Here: | 43.5% |
| Florida: | 15.8% |
| Here: | 25.0% |
| Florida: | 12.9% |
| Here: | 16.7% |
| Florida: | 23.6% |