St. Matthews, SC (South Carolina) Houses and Residents
| St. Matthews: | $139,312 |
| South Carolina: | $254,600 |
Total population: 1,992 (Urban population: 0, Rural population: 2,272 (86 farm, 2,186 nonfarm))
Houses: 1,057 (854 occupied: 563 owner occupied, 307 renter occupied)
| % of renters here: | 35% |
| State: | 28% |
Housing density: 547 houses/condos per square mile
Median price asked for vacant for-sale houses and condos in 2022: $198,501.
Median contract rent in 2022: $508 (lower quartile is $242, upper quartile is $564)
Median rent asked for vacant for-rent units in 2022: $719
Median gross rent in St. Matthews, SC in 2022: $1,076
Housing units in St. Matthews with a mortgage: 170 (8 second mortgage, 0 home equity loan, 8 both second mortgage and home equity loan)
Houses without a mortgage: 36
Median household income for houses/condos with a mortgage: $53,798
Median household income for apartments without a mortgage: $55,747
Median monthly housing costs: $650
Compare current foreclosures near St. Matthews, SC:
| Photo | Address | Area | Beds / Baths | Price | Details |
|---|---|---|---|---|---|

|
#1
Cabin Creek Blvd
Hopkins, SC 29061
|
1,025 sq. feet
|
1 baths 3 beds |
show details | |

|
#2
Ellis Ave
Orangeburg, SC 29115
|
2,035 sq. feet
|
3 baths 3 beds |
show details | |

|
#3
Cherokee St
Orangeburg, SC 29115
|
1,232 sq. feet
|
4 baths 3 beds |
show details | |

|
#4
Mcalpine St
Orangeburg, SC 29115
|
1,642 sq. feet
|
2 baths 2 beds |
show details | |

|
#5
Sheppard Rd
Orangeburg, SC 29118
|
1,815 sq. feet
|
2 baths 3 beds |
show details | |

|
#6
Sifly Rd
Orangeburg, SC 29118
|
1,452 sq. feet
|
2 baths 3 beds |
show details | |

|
#7
Fanfare Ln
Orangeburg, SC 29118
|
2,069 sq. feet
|
2 baths 3 beds |
show details | |

|
#8
Bleakley St
Orangeburg, SC 29115
|
1,064 sq. feet
|
1 baths 3 beds |
show details | |

|
#9
Columbia Rd
Orangeburg, SC 29118
|
2,132 sq. feet
|
3 baths 4 beds |
show details | |

|
#10
Carolina Ave
Orangeburg, SC 29115
|
1,608 sq. feet
|
1 baths 3 beds |
show details |
| Photo | Address | Area | Beds / Baths | Price | Details |
|---|---|---|---|---|---|

|
#11
Pinehill Rd
Orangeburg, SC 29115
|
2,762 sq. feet
|
3 baths 4 beds |
show details | |

|
#12
Joe Collins Rd
Eastover, SC 29044
|
1,612 sq. feet
|
2 baths 3 beds |
show details | |

|
#13
Landing Way
Orangeburg, SC 29118
|
3,325 sq. feet
|
3 baths 4 beds |
show details | |

|
#14
Lakeside St
Orangeburg, SC 29118
|
1,581 sq. feet
|
2 baths 3 beds |
show details | |

|
#15
Manning St
Orangeburg, SC 29115
|
1,000 sq. feet
|
2 baths 3 beds |
show details | |

|
#16
Lateesha Rd
Hopkins, SC 29061
|
2,432 sq. feet
|
2 baths 3 beds |
show details | |

|
#17
Hillcrest Ave
Orangeburg, SC 29118
|
1,589 sq. feet
|
3 baths 3 beds |
show details | |

|
#18
Harvey Ln
Orangeburg, SC 29118
|
1,527 sq. feet
|
2 baths 3 beds |
show details | |

|
#19
Goff Ave
Orangeburg, SC 29115
|
1,281 sq. feet
|
2 baths 3 beds |
show details | |

|
#20
Lakeside St
Orangeburg, SC 29118
|
1,878 sq. feet
|
2 baths 3 beds |
show details |
| Photo | Address | Area | Beds / Baths | Price | Details |
|---|---|---|---|---|---|

|
#21
Freeland St
Orangeburg, SC 29115
|
1,232 sq. feet
|
2 baths 3 beds |
show details | |

|
#22
Rustic St
Orangeburg, SC 29118
|
924 sq. feet
|
2 baths 3 beds |
show details | |

|
#23
Lakeside St
Orangeburg, SC 29118
|
2,192 sq. feet
|
3 baths 3 beds |
show details | |

|
#24
Corina St
Orangeburg, SC 29115
|
1,020 sq. feet
|
1 baths 3 beds |
show details | |

|
#25
Oakridge Dr
Orangeburg, SC 29115
|
1,428 sq. feet
|
2 baths 3 beds |
show details | |

|
#26
Atlantic Ave
Orangeburg, SC 29115
|
1,273 sq. feet
|
2 baths 3 beds |
show details | |

|
#27
Eutaw St
Orangeburg, SC 29115
|
1,440 sq. feet
|
1 baths 3 beds |
show details | |

|
#28
Hampton Dr
Orangeburg, SC 29118
|
2,075 sq. feet
|
2 baths 3 beds |
show details | |

|
#29
Woodbine Dr
Orangeburg, SC 29115
|
1,260 sq. feet
|
2 baths 3 beds |
show details | |

|
#30
Jamison Ave
Orangeburg, SC 29115
|
1,767 sq. feet
|
2 baths 4 beds |
show details |
| Photo | Address | Area | Beds / Baths | Price | Details |
|---|---|---|---|---|---|

|
#31
Old Decal
Eastover, SC 29044
|
1,568 sq. feet
|
2 baths 3 beds |
show details | |

|
#32
Cabin Creek Rd
Hopkins, SC 29061
|
948 sq. feet
|
1 baths 3 beds |
show details | |

|
#33
Gospel Hill Ct
Orangeburg, SC 29115
|
1,025 sq. feet
|
1 baths 3 beds |
show details | |

|
#34
Ginger Lake Dr
Orangeburg, SC 29118
|
2,178 sq. feet
|
2 baths 3 beds |
show details | |

|
#35
Cambridge Dr
Orangeburg, SC 29118
|
2,879 sq. feet
|
2 baths 3 beds |
show details | |

|
#36
Cannon Bridge Rd
Cordova, SC 29039
|
2,016 sq. feet
|
2 baths 3 beds |
show details | |

|
#37
Highland Grove Ave
Orangeburg, SC 29115
|
1,364 sq. feet
|
1 baths 3 beds |
show details | |

|
#38
Clarkson Rd
Hopkins, SC 29061
|
1,683 sq. feet
|
2 baths 3 beds |
show details | |

|
#39
Old Congaree Run
Eastover, SC 29044
|
1,444 sq. feet
|
2 baths 3 beds |
show details | |

|
#40
Eastwood Cir
Orangeburg, SC 29118
|
1,100 sq. feet
|
2 baths 3 beds |
show details |
| Photo | Address | Area | Beds / Baths | Price | Details |
|---|---|---|---|---|---|

|
#41
Erika Ln
Orangeburg, SC 29118
|
1,265 sq. feet
|
1 baths 2 beds |
show details | |

|
#42
Rosewood Dr
Orangeburg, SC 29115
|
1,290 sq. feet
|
1 baths 3 beds |
show details | |

|
#43
Plow Rd
Orangeburg, SC 29115
|
1,300 sq. feet
|
3 baths 3 beds |
show details | |

|
#44
Tecza Dr
Orangeburg, SC 29115
|
1,375 sq. feet
|
2 baths 3 beds |
show details | |

|
#45
Doberman Ln
Cameron, SC 29030
|
2,240 sq. feet
|
2 baths 4 beds |
show details | |

|
#46
Shillings Bridge Rd
Orangeburg, SC 29115
|
1,008 sq. feet
|
1 baths 3 beds |
show details | |

|
#47
Quick St
Orangeburg, SC 29115
|
640 sq. feet
|
1 baths 2 beds |
show details | |

|
#48
Palm Harbor Dr
Orangeburg, SC 29115
|
1,464 sq. feet
|
2 baths 3 beds |
show details | |

|
#49
Flowerwood Dr
Bowman, SC 29018
|
1,848 sq. feet
|
2 baths 3 beds |
show details | |

|
Check over 1 million property listings on Foreclosure.com!
|
browse all offers | |||


 | St. Matthews? (3 replies) |
| Relocating and know nothing about Columbia! (19 replies) |
| A question for Democrats (38 replies) |
| Inexpensive Weekend Getaway (11 replies) |
| St Matthews area....just curious (12 replies) |
| Royal Oaks Plantation near Orangeburg, SC (13 replies) |

Median year apartment built: 1975
Household type by relationship:
Households: 1,984- Male householders: 322 (98 living alone), Female householders: 524 (227 living alone)
221 spouses (221 opposite-sex spouses), 13 unmarried partners, (13 opposite-sex unmarried partners), 443 children (422 natural, 2 adopted, 19 stepchildren), 126 grandchildren, 20 brothers or sisters, 4 parents, 0 foster children, 120 other relatives, 19 non-relatives
- In group quarters: 167
Size of family households: 276 2-persons, 109 3-persons, 86 4-persons, 44 5-persons.
Size of nonfamily households: 330 1-person, 15 2-persons, 5 5-persons.
156 married couples with children.
98 single-parent households (0 men, 98 women).
97.8% of residents of St. Matthews speak English at home.
1.1% of residents speak Spanish at home (100% speak English very well).
1.3% of residents speak other Indo-European language at home (100% speak English very well).
0.3% of residents speak Asian or Pacific Island language at home (100% speak English not well).
Foreign born population: 47 (2.4%)
(108.5% of them are naturalized citizens)
| Here: | 6.1 |
| State: | 6.4 |
| Here: | 5.4 |
| State: | 4.5 |

- Bedrooms in owner-occupied houses and condos in St. Matthews, South Carolina
- 0no bedroom
- 01 bedroom
- 862 bedrooms
- 3683 bedrooms
- 614 bedrooms
- 495+ bedrooms

- Bedrooms in renter-occupied apartments in St. Matthews, South Carolina
- 20no bedroom
- 431 bedroom
- 792 bedrooms
- 1373 bedrooms
- 274 bedrooms
- 05+ bedrooms

- Cars and other vehicles available in St. Matthews in owner-occupied houses/condos
- 68no vehicle
- 2771 vehicle
- 1202 vehicles
- 923 vehicles
- 74 vehicles
- 05+ vehicles

- Cars and other vehicles available in St. Matthews in renter-occupied apartments
- 39no vehicle
- 1391 vehicle
- 1032 vehicles
- 253 vehicles
- 04 vehicles
- 05+ vehicles

- Rooms in owner-occupied houses in St. Matthews, South Carolina
- 01 room
- 02 rooms
- 203 rooms
- 204 rooms
- 1895 rooms
- 946 rooms
- 1107 rooms
- 638 rooms
- 689+ rooms

- Rooms in renter-occupied apartments in St. Matthews, South Carolina
- 201 room
- 02 rooms
- 243 rooms
- 294 rooms
- 955 rooms
- 376 rooms
- 567 rooms
- 468 rooms
- 09+ rooms


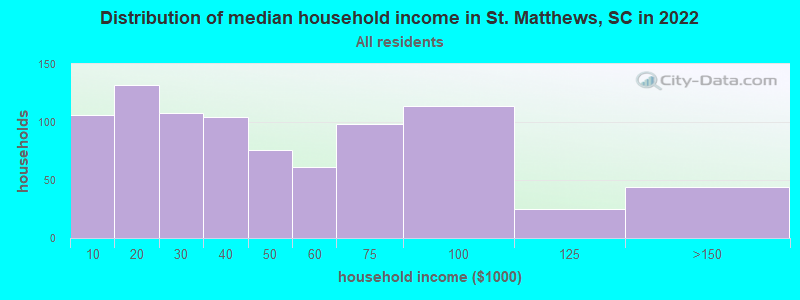
St. Matthews, SC household income distribution

- 106Less than $10,000
- 132$10,000 to $19,999
- 108$20,000 to $29,999
- 104$30,000 to $39,999
- 76$40,000 to $49,999
- 61$50,000 to $59,999
- 98$60,000 to $74,999
- 114$75,000 to $99,999
- 25$100,000 to $124,999
- 44$125,000 to $149,999
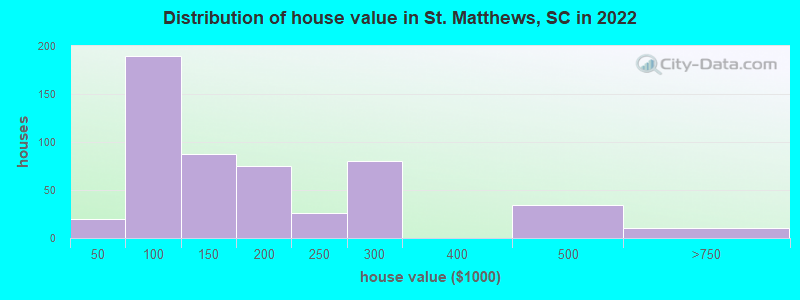
Home value of owner - occupied houses in 2022 in St. Matthews, SC
-
- 3$25,000 to $29,999
- 16$40,000 to $49,999
- 84$60,000 to $69,999
- 37$70,000 to $79,999
- 9$80,000 to $89,999
- 41$90,000 to $99,999
- 62$100,000 to $124,999
- 25$125,000 to $149,999
- 51$150,000 to $174,999
- 23$175,000 to $199,999
- 26$200,000 to $249,999
- 79$250,000 to $299,999
- 33$400,000 to $499,999
- 9$500,000 to $749,999
Rent paid by renters in 2022 in St. Matthews, SC
-
- 7Less than $100
- 22$150 to $199
- 37$200 to $249
- 12$300 to $349
- 14$400 to $449
- 14$450 to $499
- 70$500 to $549
- 6$550 to $599
- 4$900 to $999
- 28$1,000 to $1,249
- 68No cash rent


Percentage of workers working in this county: 40.4%
Number of people working at home: 49 (7.3% of all workers)
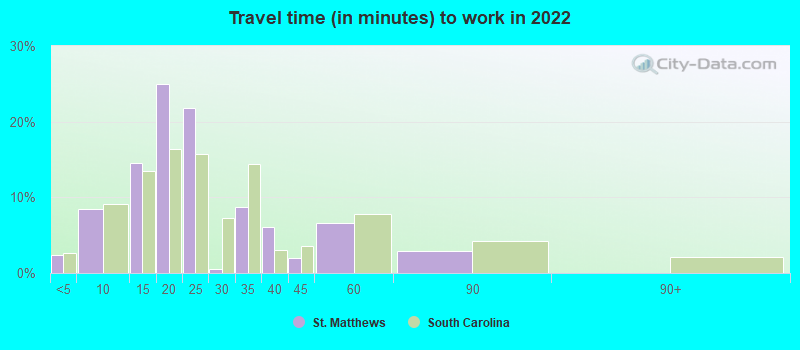
Travel time to work (commute)
- Less than 5 minutes: 56
- 5 to 9 minutes: 135
- 10 to 14 minutes: 126
- 15 to 19 minutes: 19
- 20 to 24 minutes: 100
- 25 to 29 minutes: 37
- 30 to 34 minutes: 86
- 35 to 39 minutes: 15
- 40 to 44 minutes: 3
- 45 to 59 minutes: 38
- 60 to 89 minutes: 0
- 90 or more minutes: 0
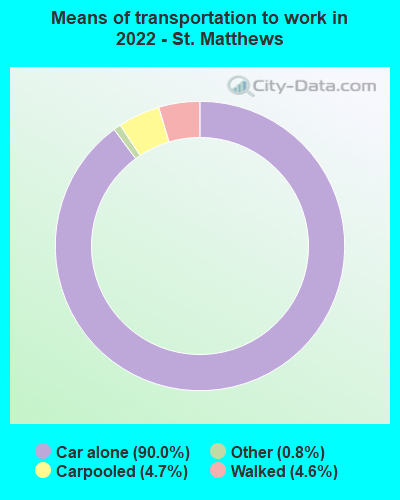
Means of transportation to work:
- Drove a car alone: 928 (83.8%)
- Carpooled: 50 (4.5%)
- Taxi: 8 (0.7%)
- Walked: 43 (3.9%)
- Worked at home: 49 (4.4%)

- Unemployment by race in 2022
- Unemployment rate for Black residents
- 46.0%Males
- 23.3%Females

- Year of entry for the foreign-born population in St. Matthews, South Carolina
- 02010 or later
- 02000 to 2009
- 131990 to 1999
- 01980 to 1989
- 61970 to 1979
- 5Before 1970

First ancestries reported:
- American: 68 (4.9%)
- English: 40 (2.9%)
- German: 35 (2.5%)
- Irish: 26 (1.9%)
- Scottish: 13 (0.9%)
- European: 7 (0.5%)
- Russian: 7 (0.5%)
- Norwegian: 6 (0.4%)
- Scotch-Irish: 6 (0.4%)
- Danish: 5 (0.4%)
- African: 5 (0.4%)
- Swiss: 4 (0.3%)
- French: 3 (0.2%)
Most common places of birth for foreign-born residents (%):
| St. Matthews: | 46.8% (22) |
| South Carolina: | 1.3% (3,522) |
| St. Matthews: | 17.0% (8) |
| South Carolina: | 1.9% (5,117) |
| St. Matthews: | 14.9% (7) |
| South Carolina: | 1.7% (4,513) |
Place of birth for U.S.-born residents:
- This state: 1,567
- Other state: 326
- Northeast: 186
- Midwest: 16
- South: 91
- West: 35
85.0% of St. Matthews residents lived in the same house 1 years ago.
Out of people who lived in different houses, 38.4% lived in this county.
Out of people who lived in different counties, 80.5% lived in South Carolina.
| St. Matthews: | 85.0% |
| State average: | 86.5% |
Education attainment for males 25 years and older:
- No schooling: 0
- Nursery to 4th grade: 0
- 5th and 6th grade: 0
- 7th and 8th grade: 22
- 9th grade: 5
- 10th grade: 3
- 11th grade: 0
- 12th grade, no diploma: 0
- High school graduate (or equivalency): 256
- Less than 1 year of college: 30
- Some college more than 1 year, no degree: 49
- Associate degree: 30
- Bachelor's degree: 119
- Master's degree: 32
- Professional school degree: 5
- Doctorate degree: 0

Education attainment for females 25 years and older:
- No schooling: 0
- Nursery to 4th grade: 0
- 5th and 6th grade: 0
- 7th and 8th grade: 62
- 9th grade: 12
- 10th grade: 0
- 11th grade: 19
- 12th grade, no diploma: 9
- High school graduate (or equivalency): 265
- Less than 1 year of college: 98
- Some college more than 1 year, no degree: 177
- Associate degree: 86
- Bachelor's degree: 131
- Master's degree: 60
- Professional school degree: 0
- Doctorate degree: 23


Housing units in structures:
- One, detached: 904
- One, attached: 42
- Two: 22
- 3 or 4: 36
- 20 to 49: 48
- Mobile homes: 3
Housing units lacking complete kitchen facilities in 2022: 1.5%
House/condo owner moved in on average 23 years ago
Renter moved in on average 5 years ago

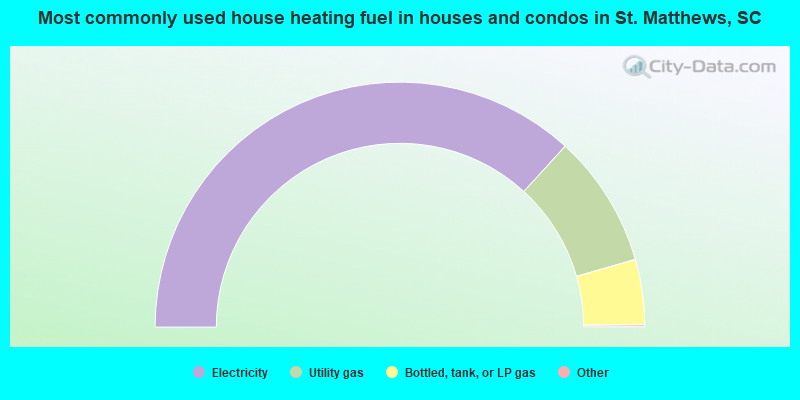
- 73.8%Electricity
- 17.6%Utility gas
- 8.6%Bottled, tank, or LP gas
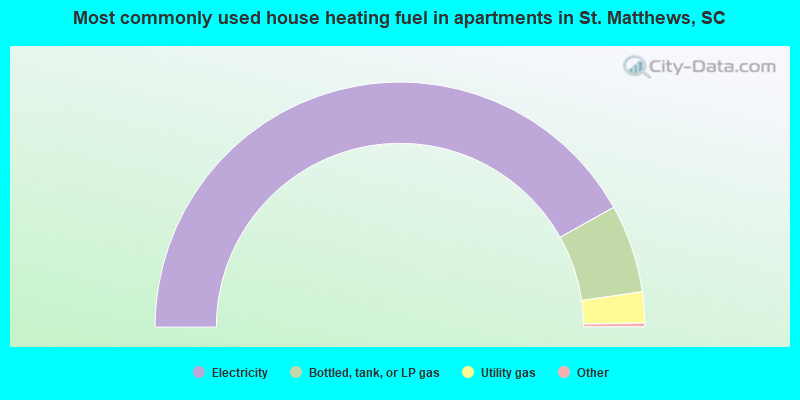
- 84.2%Electricity
- 11.7%Bottled, tank, or LP gas
- 4.1%Utility gas
Private vs. public school enrollment:
| Here: | 31.2% |
| South Carolina: | 14.4% |
| Here: | 3.3% |
| South Carolina: | 11.1% |
| Here: | 0.0% |
| South Carolina: | 21.9% |


