St. Paul, MO (Missouri) Houses and Residents
| St. Paul: | $421,098 |
| Missouri: | $221,200 |
Mean price in 2022:
Detached houses: $511,558
Here: $511,558 State: $278,068 Townhouses or other attached units: $285,384
Here: $285,384 State: $260,773
Total population: 1,847 (Urban population: 305, Rural population: 1,356 (10 farm, 1,346 nonfarm))
Houses: 1,197 (1,167 occupied: 1,123 owner occupied, 54 renter occupied)
| % of renters here: | 5% |
| State: | 32% |
Housing density: 178 houses/condos per square mile
Median price asked for vacant for-sale houses and condos in 2022 in this county: $157,388.
Median contract rent in 2022: $752 (lower quartile is $673, upper quartile is $809)
Median gross rent in St. Paul, MO in 2022: $1,075
Housing units in St. Paul with a mortgage: 717 (38 second mortgage, 0 home equity loan, 28 both second mortgage and home equity loan)
Houses without a mortgage: 14
Median household income for houses/condos with a mortgage: $166,082
Median household income for apartments without a mortgage: $91,032
Median monthly housing costs: $1,532
Compare current foreclosures near St. Paul, MO:
| Photo | Address | Area | Beds / Baths | Price | Details |
|---|---|---|---|---|---|

|
#1
Bell Rd
Wright City, MO 63390
|
1,500 sq. feet
|
1 baths 3 beds |
$455,000
|
show details |

|
#2
Hardy Rd
Troy, MO 63379
|
1,999 sq. feet
|
2 baths 4 beds |
$100,000
|
show details |

|
#3
Canyonlands Dr Apt C
Maryland Heights, MO 63043
|
978 sq. feet
|
2 baths 2 beds |
show details | |

|
#4
Cap Au Gris St
Troy, MO 63379
|
2,674 sq. feet
|
3 baths 6 beds |
show details | |

|
#5
Shadow Wood Dr
Saint Charles, MO 63303
|
1,064 sq. feet
|
2 baths 3 beds |
show details | |

|
#6
Benton Taylor Dr
Chesterfield, MO 63005
|
4,708 sq. feet
|
3 baths 4 beds |
show details | |

|
#7
Colby Dr
Saint Peters, MO 63376
|
1,580 sq. feet
|
2 baths 3 beds |
show details | |

|
#8
Sword Lily Dr
O Fallon, MO 63366
|
1,748 sq. feet
|
2 baths 3 beds |
show details | |

|
#9
Linder Dr
Winfield, MO 63389
|
1,202 sq. feet
|
2 baths 3 beds |
show details | |

|
#10
Athens Dr
Saint Peters, MO 63376
|
2,104 sq. feet
|
2 baths 4 beds |
show details |
| Photo | Address | Area | Beds / Baths | Price | Details |
|---|---|---|---|---|---|

|
#11
Oak Hill Ct
Saint Peters, MO 63376
|
1,168 sq. feet
|
2 baths 3 beds |
show details | |

|
#12
Highway Dd
Defiance, MO 63341
|
1,272 sq. feet
|
1 baths 3 beds |
show details | |

|
#13
Belleau Lake Dr
O Fallon, MO 63366
|
1,492 sq. feet
|
2 baths 3 beds |
show details | |

|
#14
Ridgeview Ct
Saint Charles, MO 63301
|
1,307 sq. feet
|
2 baths 3 beds |
show details | |

|
#15
Colby Dr
Saint Peters, MO 63376
|
1,920 sq. feet
|
2 baths 4 beds |
show details | |

|
#16
Piety Dr
Lake Saint Louis, MO 63367
|
2,112 sq. feet
|
2 baths 4 beds |
show details | |

|
#17
Olive St
Saint Charles, MO 63301
|
896 sq. feet
|
1 baths 2 beds |
show details | |

|
#18
Robin Dr
Saint Charles, MO 63301
|
720 sq. feet
|
1 baths 2 beds |
show details | |

|
#19
Whitetail Crossing Dr
Troy, MO 63379
|
1,144 sq. feet
|
2 baths 3 beds |
show details | |

|
#20
Orchid Blossom Ct
Saint Peters, MO 63376
|
- sq. feet
|
2 baths 3 beds |
show details |
| Photo | Address | Area | Beds / Baths | Price | Details |
|---|---|---|---|---|---|

|
#21
Shelburne Dr
Saint Charles, MO 63301
|
1,436 sq. feet
|
2 baths 3 beds |
show details | |

|
#22
Black Willow Ct
Saint Charles, MO 63303
|
1,085 sq. feet
|
2 baths 3 beds |
show details | |

|
#23
Pershing Lake Dr
Saint Peters, MO 63376
|
2,234 sq. feet
|
2 baths 4 beds |
show details | |

|
#24
Carrington Dr
Saint Peters, MO 63376
|
1,180 sq. feet
|
2 baths 3 beds |
show details | |

|
#25
Jody Dr
Saint Peters, MO 63376
|
1,528 sq. feet
|
2 baths 3 beds |
show details | |

|
#26
Danson Dr
Saint Peters, MO 63376
|
1,554 sq. feet
|
2 baths 3 beds |
show details | |

|
#27
Trio Dr
Wentzville, MO 63385
|
1,614 sq. feet
|
2 baths 3 beds |
show details | |

|
#28
Summerwood Dr
Saint Peters, MO 63376
|
1,248 sq. feet
|
2 baths 3 beds |
show details | |

|
#29
Arpent St
Saint Charles, MO 63301
|
1,778 sq. feet
|
2 baths 3 beds |
show details | |

|
#30
Charwood St
Saint Charles, MO 63301
|
1,322 sq. feet
|
1 baths 3 beds |
show details |
| Photo | Address | Area | Beds / Baths | Price | Details |
|---|---|---|---|---|---|

|
#31
Walnut Creek Blvd
Saint Charles, MO 63304
|
2,188 sq. feet
|
2 baths 4 beds |
show details | |

|
#32
Colby Ct
Saint Peters, MO 63376
|
1,400 sq. feet
|
2 baths 3 beds |
show details | |

|
#33
Lafayette Landing Ct
Saint Charles, MO 63303
|
1,790 sq. feet
|
2 baths 3 beds |
show details | |

|
#34
Christine Dr
Saint Peters, MO 63376
|
1,547 sq. feet
|
2 baths 3 beds |
show details | |

|
#35
Westminster Dr
Saint Peters, MO 63376
|
1,404 sq. feet
|
2 baths 3 beds |
show details | |

|
#36
Rocky Mound Dr
Wentzville, MO 63385
|
1,605 sq. feet
|
2 baths 3 beds |
show details | |

|
#37
Lynn Dr
Saint Peters, MO 63376
|
1,092 sq. feet
|
3 baths 3 beds |
show details | |

|
#38
Elmhurst Dr
Saint Charles, MO 63301
|
1,130 sq. feet
|
1 baths 3 beds |
show details | |

|
#39
Paul Renaud Blvd
Lake Saint Louis, MO 63367
|
4,258 sq. feet
|
3 baths 4 beds |
show details | |

|
#40
S Cadillac Dr
Saint Charles, MO 63301
|
864 sq. feet
|
2 baths 3 beds |
show details |
| Photo | Address | Area | Beds / Baths | Price | Details |
|---|---|---|---|---|---|

|
#41
Carrington Dr
Saint Peters, MO 63376
|
2,003 sq. feet
|
2 baths 4 beds |
show details | |

|
#42
Morningside Dr
Saint Peters, MO 63376
|
1,288 sq. feet
|
2 baths 3 beds |
show details | |

|
#43
Park Charles Blvd N
Saint Peters, MO 63376
|
2,152 sq. feet
|
2 baths 4 beds |
show details | |

|
#44
Autumn Trace Pkwy
Wentzville, MO 63385
|
1,719 sq. feet
|
3 baths 3 beds |
show details | |

|
#45
Mendoza Dr
Saint Peters, MO 63376
|
1,300 sq. feet
|
2 baths 3 beds |
show details | |

|
#46
Teak Ct
Saint Peters, MO 63376
|
1,034 sq. feet
|
2 baths 3 beds |
show details | |

|
#47
Newberry Dr
Saint Peters, MO 63376
|
1,248 sq. feet
|
2 baths 3 beds |
show details | |

|
#48
Autumn Fields Ln
Wentzville, MO 63385
|
2,336 sq. feet
|
2 baths 4 beds |
show details | |

|
#49
Newberry Dr
Saint Peters, MO 63376
|
1,466 sq. feet
|
2 baths 3 beds |
show details | |

|
Check over 1 million property listings on Foreclosure.com!
|
browse all offers | |||


 | I am looking for a rural/small/lots of farms nearby town to rent an apartment/house in within 40 minutes of St. Louis (4 replies) |
| It's between KC and Cincinnati. Convince me! (87 replies) |
| Why isn't Kansas City, Kansas booming? (52 replies) |
| Missouri Outlaw History (3407 replies) |
| What to eat before you die in STL? (12 replies) |
| Possible Relocation Destinations (6 replies) |

Median year apartment built: 1980
Household type by relationship:
Households: 3,207- Male householders: 669 (57 living alone), Female householders: 480 (65 living alone)
887 spouses (883 opposite-sex spouses), 45 unmarried partners, (45 opposite-sex unmarried partners), 996 children (951 natural, 35 adopted, 9 stepchildren), 20 grandchildren, 0 brothers or sisters, 10 parents, 0 foster children, 85 other relatives, 12 non-relatives
Size of family households: 420 2-persons, 404 3-persons, 142 4-persons, 35 5-persons, 15 6-persons, 4 7-or-more-persons.
Size of nonfamily households: 121 1-person, 32 2-persons.
500 married couples with children.
32 single-parent households (18 men, 14 women).
98.0% of residents of St. Paul speak English at home.
1.3% of residents speak Spanish at home (68% speak English very well, 32% speak English well).
0.4% of residents speak other Indo-European language at home (100% speak English very well).
0.1% of residents speak other language at home (100% speak English very well).
Foreign born population: 52 (1.6%)
(105.8% of them are naturalized citizens)
| Here: | 6.4 |
| State: | 6.4 |
| Here: | 5.1 |
| State: | 4.4 |

- Bedrooms in owner-occupied houses and condos in St. Paul, Missouri
- 0no bedroom
- 01 bedroom
- 532 bedrooms
- 7473 bedrooms
- 2714 bedrooms
- 525+ bedrooms

- Bedrooms in renter-occupied apartments in St. Paul, Missouri
- 0no bedroom
- 161 bedroom
- 312 bedrooms
- 03 bedrooms
- 04 bedrooms
- 75+ bedrooms

- Cars and other vehicles available in St. Paul in owner-occupied houses/condos
- 56no vehicle
- 971 vehicle
- 4442 vehicles
- 3903 vehicles
- 684 vehicles
- 695+ vehicles

- Cars and other vehicles available in St. Paul in renter-occupied apartments
- 0no vehicle
- 211 vehicle
- 332 vehicles
- 03 vehicles
- 04 vehicles
- 05+ vehicles

- Rooms in owner-occupied houses in St. Paul, Missouri
- 01 room
- 02 rooms
- 03 rooms
- 954 rooms
- 1455 rooms
- 3636 rooms
- 2077 rooms
- 1038 rooms
- 2119+ rooms

- Rooms in renter-occupied apartments in St. Paul, Missouri
- 01 room
- 02 rooms
- 163 rooms
- 04 rooms
- 195 rooms
- 06 rooms
- 137 rooms
- 08 rooms
- 79+ rooms


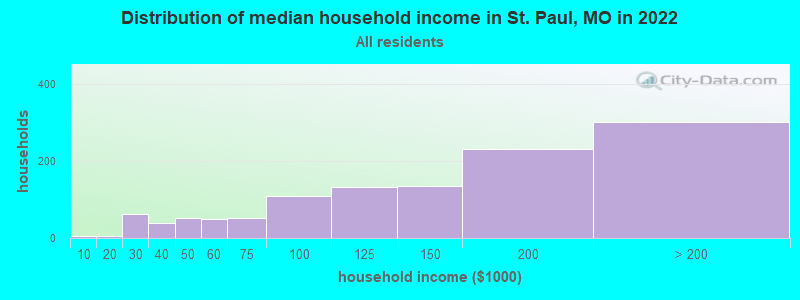
St. Paul, MO household income distribution

- 4Less than $10,000
- 6$10,000 to $19,999
- 63$20,000 to $29,999
- 39$30,000 to $39,999
- 53$40,000 to $49,999
- 49$50,000 to $59,999
- 51$60,000 to $74,999
- 109$75,000 to $99,999
- 133$100,000 to $124,999
- 135$125,000 to $149,999
- 230$150,000 to $199,999
- 301$200,000 or more
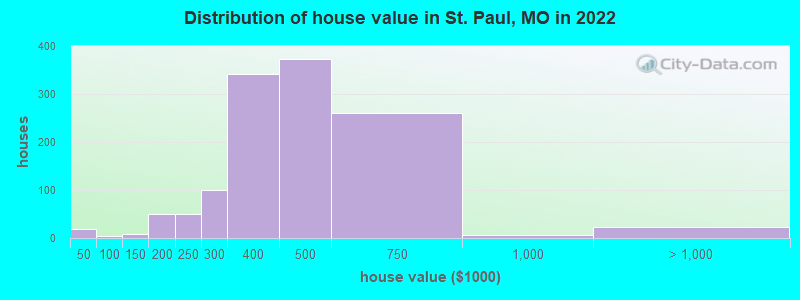
Home value of owner - occupied houses in 2022 in St. Paul, MO
-
- 17$10,000 to $14,999
- 1$30,000 to $34,999
- 4$50,000 to $59,999
- 8$125,000 to $149,999
- 20$150,000 to $174,999
- 28$175,000 to $199,999
- 49$200,000 to $249,999
- 98$250,000 to $299,999
- 342$300,000 to $399,999
- 373$400,000 to $499,999
- 259$500,000 to $749,999
- 6$750,000 to $999,999
- 5$1,000,000 to $1,499,999
- 5$1,500,000 to $1,999,999
- 12$2,000,000 or more
Rent paid by renters in 2022 in St. Paul, MO
-
- 21$600 to $649
- 22$700 to $749
- 4$750 to $799
- 14$1,000 to $1,249


Percentage of workers working in this county: 62.3%
Number of people working at home: 238 (14.8% of all workers)
Travel time to work (commute)
- Less than 5 minutes: 144
- 5 to 9 minutes: 19
- 10 to 14 minutes: 102
- 15 to 19 minutes: 190
- 20 to 24 minutes: 159
- 25 to 29 minutes: 66
- 30 to 34 minutes: 226
- 35 to 39 minutes: 116
- 40 to 44 minutes: 91
- 45 to 59 minutes: 194
- 60 to 89 minutes: 43
- 90 or more minutes: 21
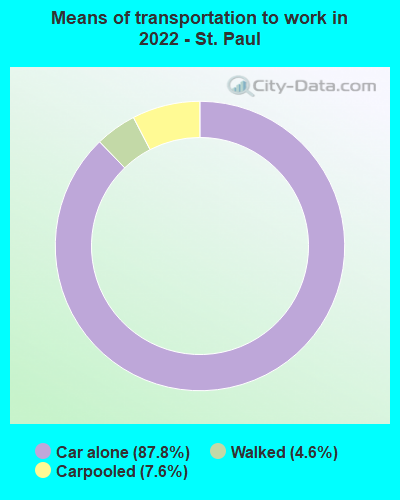
Means of transportation to work:
- Drove a car alone: 372 (57.5%)
- Carpooled: 36 (5.6%)
- Walked: 26 (4.0%)
- Worked at home: 235 (36.3%)

- Unemployment by race in 2022
- Unemployment rate for White non-Hispanic residents
- 0.9%Females

- Year of entry for the foreign-born population in St. Paul, Missouri
- 102010 or later
- 162000 to 2009
- 31990 to 1999
- 131980 to 1989
- 01970 to 1979
- 3Before 1970

First ancestries reported:
- German: 574 (31.8%)
- Italian: 380 (21.1%)
- English: 291 (16.1%)
- American: 147 (8.2%)
- European: 134 (7.4%)
- Polish: 108 (6.0%)
- Irish: 78 (4.3%)
- Bulgarian: 18 (1.0%)
- Czechoslovakian: 14 (0.8%)
- Norwegian: 14 (0.8%)
- British: 13 (0.7%)
- Ukrainian: 10 (0.6%)
- Belgian: 6 (0.3%)
- Scottish: 5 (0.3%)
- Brazilian: 4 (0.2%)
- Scotch-Irish: 4 (0.2%)
- Swedish: 4 (0.2%)
- Scandinavian: 3 (0.2%)
Most common places of birth for foreign-born residents (%):
| St. Paul: | 25.0% (14) |
| Missouri: | 4.2% (10,873) |
| St. Paul: | 19.6% (11) |
| Missouri: | 14.9% (38,568) |
| St. Paul: | 17.9% (10) |
| Missouri: | 3.0% (7,803) |
| St. Paul: | 16.1% (9) |
| Missouri: | 1.1% (2,895) |
| St. Paul: | 8.9% (5) |
| Missouri: | 0.3% (727) |
| St. Paul: | 7.1% (4) |
| Missouri: | 0.7% (1,861) |
| St. Paul: | 5.4% (3) |
| Missouri: | 4.1% (10,700) |
Place of birth for U.S.-born residents:
- This state: 2,252
- Other state: 904
- Northeast: 38
- Midwest: 683
- South: 132
- West: 56
78.0% of St. Paul residents lived in the same house 1 years ago.
Out of people who lived in different houses, 35.3% lived in this county.
Out of people who lived in different counties, 15.5% lived in Missouri.
| St. Paul: | 78.0% |
| State average: | 87.1% |
Education attainment for males 25 years and older:
- No schooling: 0
- Nursery to 4th grade: 0
- 5th and 6th grade: 0
- 7th and 8th grade: 9
- 9th grade: 0
- 10th grade: 7
- 11th grade: 0
- 12th grade, no diploma: 3
- High school graduate (or equivalency): 374
- Less than 1 year of college: 73
- Some college more than 1 year, no degree: 335
- Associate degree: 100
- Bachelor's degree: 230
- Master's degree: 77
- Professional school degree: 7
- Doctorate degree: 8

Education attainment for females 25 years and older:
- No schooling: 9
- Nursery to 4th grade: 0
- 5th and 6th grade: 0
- 7th and 8th grade: 2
- 9th grade: 0
- 10th grade: 22
- 11th grade: 3
- 12th grade, no diploma: 0
- High school graduate (or equivalency): 237
- Less than 1 year of college: 80
- Some college more than 1 year, no degree: 85
- Associate degree: 71
- Bachelor's degree: 349
- Master's degree: 177
- Professional school degree: 65
- Doctorate degree: 20


Housing units in structures:
- One, detached: 1,126
- One, attached: 50
- Mobile homes: 19
House/condo owner moved in on average 7 years ago
Renter moved in on average 3 years ago

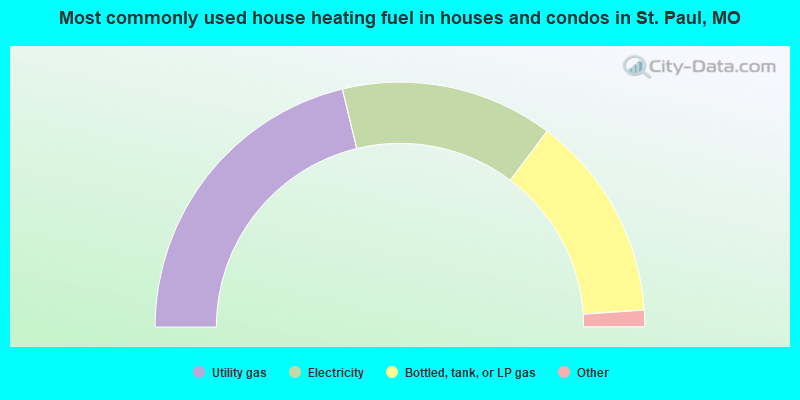
- 42.5%Utility gas
- 28.1%Electricity
- 27.3%Bottled, tank, or LP gas
- 1.3%Wood
- 0.7%No fuel used
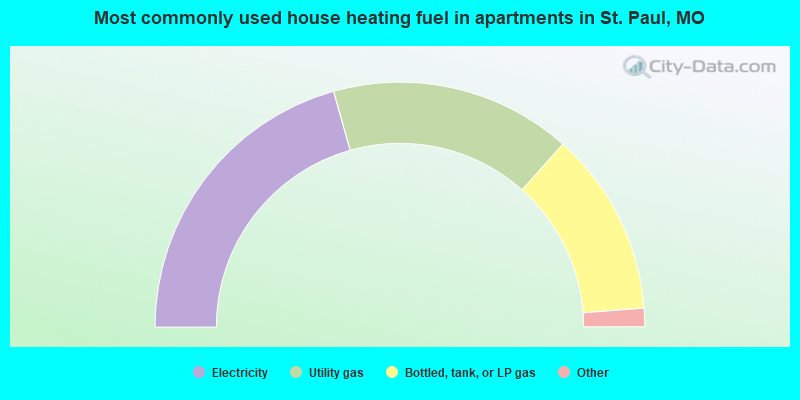
- 42.3%Electricity
- 32.7%Utility gas
- 25.0%Bottled, tank, or LP gas
Private vs. public school enrollment:
| Here: | 52.6% |
| Missouri: | 15.4% |
| Here: | 15.7% |
| Missouri: | 13.9% |
| Here: | 2.1% |
| Missouri: | 22.6% |


