St. Peter, IL (Illinois) Houses and Residents
| St. Peter: | $96,494 |
| Illinois: | $251,600 |
Mean price in 2022:
Detached houses: $104,079
Here: $104,079 State: $310,164 Mobile homes: $76,273
Here: $76,273 State: $78,855
Total population: 357 (Urban population: 0, Rural population: 387 (14 farm, 373 nonfarm))
Houses: 114 (107 occupied: 98 owner occupied, 10 renter occupied)
| % of renters here: | 9% |
| State: | 33% |
Housing density: 213 houses/condos per square mile
Median price asked for vacant for-sale houses and condos in 2022 in this county: $55,716.
Median contract rent in 2022: $321
Median rent asked for vacant for-rent units in 2022: $351
Median gross rent in St. Peter, IL in 2022: $570
Housing units in St. Peter with a mortgage: 34 (0 second mortgage, 0 home equity loan, 0 both second mortgage and home equity loan)
Houses without a mortgage: 0
Median household income for houses/condos with a mortgage: $77,846
Median household income for apartments without a mortgage: $53,916
Median monthly housing costs: $561
Compare current foreclosures near St. Peter, IL:
| Photo | Address | Area | Beds / Baths | Price | Details |
|---|---|---|---|---|---|

|
#1
E 1650 Ave
Vandalia, IL 62471
|
1,762 sq. feet
|
2 baths 3 beds |
show details | |

|
#2
E Bennett St
Salem, IL 62881
|
1,242 sq. feet
|
1 baths 2 beds |
show details | |

|
#3
N 4th St
Vandalia, IL 62471
|
- sq. feet
|
- baths - beds |
show details | |

|
#4
W Randolph St
Vandalia, IL 62471
|
968 sq. feet
|
- baths - beds |
show details | |

|
#5
N 950th St
Mason, IL 62443
|
- sq. feet
|
- baths - beds |
show details | |

|
#6
N Sunflower St
Vandalia, IL 62471
|
1,440 sq. feet
|
- baths - beds |
show details | |

|
#7
S 3rd St
Altamont, IL 62411
|
- sq. feet
|
- baths - beds |
show details | |

|
#8
E Vanburen Ave
Farina, IL 62838
|
- sq. feet
|
- baths - beds |
show details | |

|
#9
W Elm St
Altamont, IL 62411
|
- sq. feet
|
- baths - beds |
show details | |

|
#10
S 8th St
Vandalia, IL 62471
|
- sq. feet
|
- baths - beds |
show details |
| Photo | Address | Area | Beds / Baths | Price | Details |
|---|---|---|---|---|---|

|
#11
N 3rd St
Altamont, IL 62411
|
- sq. feet
|
- baths - beds |
show details | |

|
#12
E 700 Ave
Saint Peter, IL 62880
|
- sq. feet
|
- baths - beds |
show details | |

|
#13
S Moreland St
Vandalia, IL 62471
|
- sq. feet
|
- baths - beds |
show details | |

|
#14
W Jefferson St
Vandalia, IL 62471
|
802 sq. feet
|
- baths - beds |
show details | |

|
#15
W South St
Vandalia, IL 62471
|
1,656 sq. feet
|
- baths - beds |
show details | |

|
#16
Deer Dr
Altamont, IL 62411
|
- sq. feet
|
- baths - beds |
show details | |

|
#17
W Saint Louis Ave
Vandalia, IL 62471
|
754 sq. feet
|
- baths - beds |
show details | |

|
#18
N Burtschi St
Vandalia, IL 62471
|
1,501 sq. feet
|
- baths - beds |
show details | |

|
#19
W Fletcher St Apt E
Vandalia, IL 62471
|
- sq. feet
|
- baths - beds |
show details | |

|
#20
W Randolph St
Vandalia, IL 62471
|
1,440 sq. feet
|
- baths - beds |
show details |
| Photo | Address | Area | Beds / Baths | Price | Details |
|---|---|---|---|---|---|

|
#21
W Randolph St
Vandalia, IL 62471
|
1,096 sq. feet
|
- baths - beds |
show details | |

|
#22
N 5th St
Vandalia, IL 62471
|
- sq. feet
|
- baths - beds |
show details | |

|
#23
W Saint Clair St
Vandalia, IL 62471
|
1,082 sq. feet
|
- baths - beds |
show details | |

|
#24
Broad St
Edgewood, IL 62426
|
- sq. feet
|
- baths - beds |
show details | |

|
#25
Public Hwy
Alma, IL 62807
|
- sq. feet
|
- baths - beds |
show details | |

|
#26
Circle Dr
Saint Elmo, IL 62458
|
1,425 sq. feet
|
- baths - beds |
show details | |

|
#27
E Washington Ave
Farina, IL 62838
|
1,000 sq. feet
|
- baths - beds |
show details | |

|
#28
S Washington St
Kinmundy, IL 62854
|
- sq. feet
|
- baths - beds |
show details | |

|
#29
N 1375 St
Vandalia, IL 62471
|
- sq. feet
|
- baths - beds |
show details | |

|
#30
E 10th St
Saint Elmo, IL 62458
|
- sq. feet
|
- baths - beds |
show details |
| Photo | Address | Area | Beds / Baths | Price | Details |
|---|---|---|---|---|---|

|
#31
N Main St
Saint Elmo, IL 62458
|
- sq. feet
|
- baths - beds |
show details | |

|
#32
N Main St
Saint Elmo, IL 62458
|
1,868 sq. feet
|
- baths - beds |
show details | |

|
#33
E 4th St
Saint Elmo, IL 62458
|
- sq. feet
|
- baths - beds |
show details | |

|
#34
E 11th St
Saint Elmo, IL 62458
|
- sq. feet
|
- baths - beds |
show details | |

|
#35
Illinois St
Alma, IL 62807
|
- sq. feet
|
- baths - beds |
show details | |

|
#36
Us Highway 40
Brownstown, IL 62418
|
- sq. feet
|
- baths - beds |
show details | |

|
#37
E Ash St
Brownstown, IL 62418
|
1,608 sq. feet
|
- baths - beds |
show details | |

|
#38
Oglesby St
Salem, IL 62881
|
- sq. feet
|
- baths - beds |
show details | |

|
#39
E William St
Salem, IL 62881
|
- sq. feet
|
- baths - beds |
show details | |

|
#40
Bob White Ln
Salem, IL 62881
|
- sq. feet
|
- baths - beds |
show details |
| Photo | Address | Area | Beds / Baths | Price | Details |
|---|---|---|---|---|---|

|
#41
N Franklin St
Salem, IL 62881
|
- sq. feet
|
- baths - beds |
show details | |

|
#42
S Stone Ave
Vandalia, IL 62471
|
- sq. feet
|
- baths - beds |
show details | |

|
#43
W Marion Ave
Patoka, IL 62875
|
- sq. feet
|
- baths - beds |
show details | |

|
#44
Yards Rd
Salem, IL 62881
|
- sq. feet
|
- baths - beds |
show details | |

|
#45
Edgewood Rd
Salem, IL 62881
|
- sq. feet
|
- baths - beds |
show details | |

|
#46
Mallard Ln
Mason, IL 62443
|
- sq. feet
|
- baths - beds |
show details | |

|
#47
N Kennedy Blvd
Vandalia, IL 62471
|
- sq. feet
|
- baths - beds |
show details | |

|
#48
Charleston Rd
Salem, IL 62881
|
- sq. feet
|
- baths - beds |
show details | |

|
#49
W John Adams Ave
Altamont, IL 62411
|
- sq. feet
|
- baths - beds |
show details | |

|
Check over 1 million property listings on Foreclosure.com!
|
browse all offers | |||


 | Ideas for my parents? (11 replies) |
| Need advice: Lake Barrington+public schools or Hoffman Estates+private schools? (1 reply) |
| Skokie Festival of Cultures (2 replies) |
| Buying our first house (18 replies) |
| Early 1960's Chicago Footage - Posted by Lee Bey (7 replies) |
| which is best chicago suburb for family? (good school, big yard, safe) (51 replies) |

Median year apartment built: 1968
Household type by relationship:
Households: 285- Male householders: 58 (11 living alone), Female householders: 47 (14 living alone)
64 spouses (63 opposite-sex spouses), 7 unmarried partners, (7 opposite-sex unmarried partners), 94 children (91 natural, 0 adopted, 2 stepchildren), 0 grandchildren, 2 brothers or sisters, 5 parents, 0 foster children, 0 other relatives, 3 non-relatives
Size of family households: 38 2-persons, 9 3-persons, 19 4-persons, 1 5-persons, 4 6-persons, 1 7-or-more-persons.
Size of nonfamily households: 28 1-person, 6 2-persons.
58 married couples with children.
18 single-parent households (3 men, 15 women).
98.9% of residents of St. Peter speak English at home.
0.4% of residents speak Spanish at home (100% speak English very well).
0.4% of residents speak other Indo-European language at home (100% speak English well).
| Here: | 6.9 |
| State: | 6.4 |
| Here: | 5.4 |
| State: | 4.1 |

- Bedrooms in owner-occupied houses and condos in St. Peter, Illinois
- 0no bedroom
- 01 bedroom
- 212 bedrooms
- 563 bedrooms
- 154 bedrooms
- 65+ bedrooms

- Bedrooms in renter-occupied apartments in St. Peter, Illinois
- 0no bedroom
- 01 bedroom
- 52 bedrooms
- 33 bedrooms
- 14 bedrooms
- 15+ bedrooms

- Cars and other vehicles available in St. Peter in owner-occupied houses/condos
- 2no vehicle
- 241 vehicle
- 342 vehicles
- 203 vehicles
- 104 vehicles
- 85+ vehicles

- Cars and other vehicles available in St. Peter in renter-occupied apartments
- 2no vehicle
- 31 vehicle
- 32 vehicles
- 23 vehicles
- 04 vehicles
- 05+ vehicles

- Rooms in owner-occupied houses in St. Peter, Illinois
- 01 room
- 02 rooms
- 03 rooms
- 24 rooms
- 155 rooms
- 236 rooms
- 247 rooms
- 148 rooms
- 199+ rooms

- Rooms in renter-occupied apartments in St. Peter, Illinois
- 01 room
- 02 rooms
- 13 rooms
- 24 rooms
- 25 rooms
- 36 rooms
- 07 rooms
- 08 rooms
- 29+ rooms


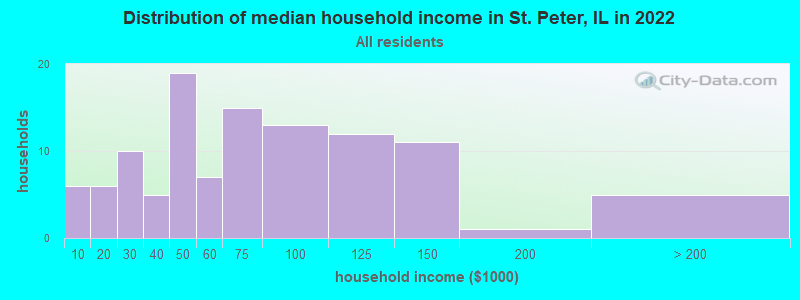
St. Peter, IL household income distribution

- 6Less than $10,000
- 6$10,000 to $19,999
- 10$20,000 to $29,999
- 5$30,000 to $39,999
- 19$40,000 to $49,999
- 7$50,000 to $59,999
- 15$60,000 to $74,999
- 13$75,000 to $99,999
- 12$100,000 to $124,999
- 11$125,000 to $149,999
- 1$150,000 to $199,999
- 5$200,000 or more
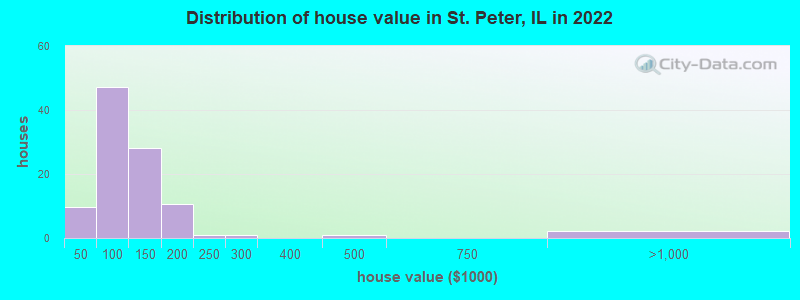
Home value of owner - occupied houses in 2022 in St. Peter, IL
-
- 0$30,000 to $34,999
- 3$35,000 to $39,999
- 5$40,000 to $49,999
- 5$50,000 to $59,999
- 7$60,000 to $69,999
- 9$70,000 to $79,999
- 16$80,000 to $89,999
- 2$90,000 to $99,999
- 19$100,000 to $124,999
- 8$125,000 to $149,999
- 5$150,000 to $174,999
- 5$175,000 to $199,999
- 0$200,000 to $249,999
- 1$250,000 to $299,999
- 1$400,000 to $499,999
- 2$750,000 to $999,999
Rent paid by renters in 2022 in St. Peter, IL
-
- 0$100 to $149
- 2$300 to $349
- 1$650 to $699
- 6No cash rent


Percentage of workers working in this county: 52.1%
Number of people working at home: 1 (0.8% of all workers)
Travel time to work (commute)
- Less than 5 minutes: 23
- 5 to 9 minutes: 19
- 10 to 14 minutes: 7
- 15 to 19 minutes: 1
- 20 to 24 minutes: 8
- 25 to 29 minutes: 12
- 30 to 34 minutes: 18
- 35 to 39 minutes: 15
- 40 to 44 minutes: 4
- 45 to 59 minutes: 1
- 60 to 89 minutes: 0
- 90 or more minutes: 0
Means of transportation to work:
- Drove a car alone: 129 (74.1%)
- Carpooled: 23 (13.2%)
- Streetcar or trolley car: 2 (1.1%)
- Walked: 18 (10.3%)
- Worked at home: 2 (1.1%)


First ancestries reported:
- German: 99 (65.0%)
- American: 31 (20.3%)
- English: 3 (2.0%)
- Irish: 1 (0.7%)
Place of birth for U.S.-born residents:
- This state: 250
- Other state: 32
- Northeast: 12
- Midwest: 21
- South: 0
- West: 0
92.9% of St. Peter residents lived in the same house 1 years ago.
Out of people who lived in different houses, 35.7% lived in this county.
Out of people who lived in different counties, 100.0% lived in Illinois.
| St. Peter: | 92.9% |
| State average: | 88.3% |
Education attainment for males 25 years and older:
- No schooling: 0
- Nursery to 4th grade: 0
- 5th and 6th grade: 0
- 7th and 8th grade: 0
- 9th grade: 0
- 10th grade: 0
- 11th grade: 0
- 12th grade, no diploma: 4
- High school graduate (or equivalency): 35
- Less than 1 year of college: 4
- Some college more than 1 year, no degree: 15
- Associate degree: 17
- Bachelor's degree: 10
- Master's degree: 6
- Professional school degree: 1
- Doctorate degree: 0

Education attainment for females 25 years and older:
- No schooling: 0
- Nursery to 4th grade: 0
- 5th and 6th grade: 0
- 7th and 8th grade: 6
- 9th grade: 1
- 10th grade: 0
- 11th grade: 0
- 12th grade, no diploma: 0
- High school graduate (or equivalency): 26
- Less than 1 year of college: 8
- Some college more than 1 year, no degree: 14
- Associate degree: 14
- Bachelor's degree: 15
- Master's degree: 1
- Professional school degree: 3
- Doctorate degree: 0


Housing units in structures:
- One, detached: 104
- One, attached: 1
- 3 or 4: 3
- Mobile homes: 6
Median worth of mobile homes: $97,021
House/condo owner moved in on average 20 years ago
Renter moved in on average 8 years ago

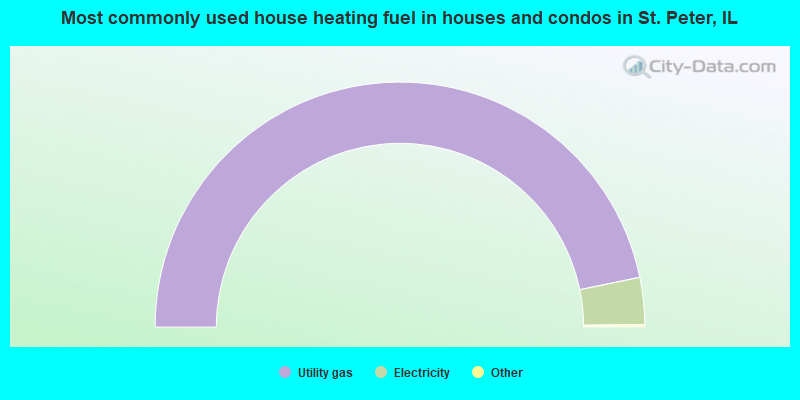
- 93.8%Utility gas
- 6.2%Electricity
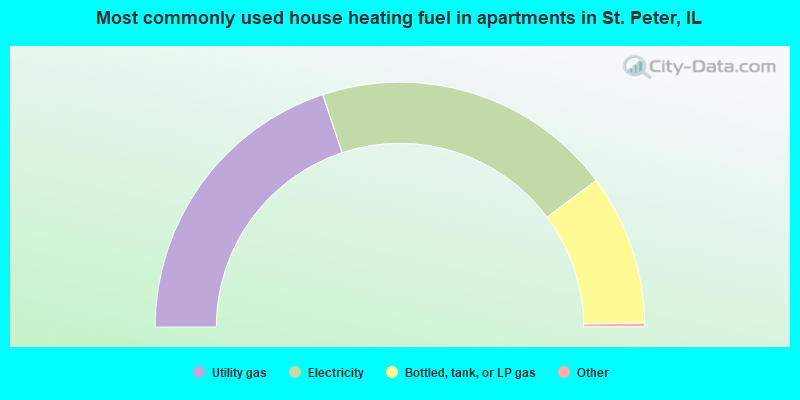
- 40.0%Utility gas
- 40.0%Electricity
- 20.0%Bottled, tank, or LP gas
Private vs. public school enrollment:
| Here: | 44.0% |
| Illinois: | 13.3% |
| Here: | 18.8% |
| Illinois: | 9.9% |
| Here: | 0.0% |
| Illinois: | 27.4% |


