Stantonville, TN (Tennessee) Houses and Residents
| Stantonville: | $118,656 |
| Tennessee: | $284,800 |
Mean price in 2022:
Detached houses: $212,069
Here: $212,069 State: $374,382 Mobile homes: $44,086
Here: $44,086 State: $101,421
Total population: 284 (Urban population: 0, Rural population: 312 (all nonfarm))
Houses: 161 (142 occupied: 123 owner occupied, 20 renter occupied)
| % of renters here: | 14% |
| State: | 33% |
Housing density: 146 houses/condos per square mile
Median price asked for vacant for-sale houses and condos in 2022 in this county: $64,415.
Median contract rent in 2022: $603 (lower quartile is $576, upper quartile is $624)
Median gross rent in Stantonville, TN in 2022: $889
Housing units in Stantonville with a mortgage: 29 (0 second mortgage, 0 home equity loan, 0 both second mortgage and home equity loan)
Houses without a mortgage: 0
Median household income for houses/condos with a mortgage: $77,149
Median household income for apartments without a mortgage: $49,523
Median monthly housing costs: $457
Compare current foreclosures near Stantonville, TN:
| Photo | Address | Area | Beds / Baths | Price | Details |
|---|---|---|---|---|---|

|
#1
Tommy Sanders Rd
Stantonville, TN 38379
|
2,549 sq. feet
|
2 baths 4 beds |
show details | |

|
#2
Highway 142
Stantonville, TN 38379
|
1,076 sq. feet
|
1 baths - beds |
show details | |

|
#3
Elzie Pounds Rd
Stantonville, TN 38379
|
2,115 sq. feet
|
2 baths - beds |
show details | |

|
#4
Gilchrist Stantonville Rd
Stantonville, TN 38379
|
924 sq. feet
|
- baths - beds |
show details | |

|
#5
Michie Pebble Hill Rd
Stantonville, TN 38379
|
1,216 sq. feet
|
- baths - beds |
show details | |

|
#6
Red Sulphur Rd
Counce, TN 38326
|
2,551 sq. feet
|
2 baths 4 beds |
show details | |

|
#7
One Stop Dr
Savannah, TN 38372
|
1,404 sq. feet
|
2 baths 3 beds |
show details | |

|
#8
Beatcher Ln
Adamsville, TN 38310
|
1,700 sq. feet
|
2 baths - beds |
show details | |

|
#9
Good Hope Church Rd
Adamsville, TN 38310
|
1,072 sq. feet
|
1 baths - beds |
show details | |

|
#10
Willow St
Savannah, TN 38372
|
1,684 sq. feet
|
1 baths - beds |
show details |
| Photo | Address | Area | Beds / Baths | Price | Details |
|---|---|---|---|---|---|

|
#11
Belmont St
Savannah, TN 38372
|
825 sq. feet
|
1 baths - beds |
show details | |

|
#12
Carver St
Savannah, TN 38372
|
950 sq. feet
|
1 baths - beds |
show details | |

|
#13
Greenwood Ave
Savannah, TN 38372
|
1,188 sq. feet
|
2 baths - beds |
show details | |

|
#14
Maxie Loop
Savannah, TN 38372
|
1,850 sq. feet
|
2 baths - beds |
show details | |

|
#15
Bullman Rd
Finger, TN 38334
|
4,132 sq. feet
|
3 baths - beds |
show details | |

|
#16
W Clover Ln
Corinth, MS 38834
|
1,502 sq. feet
|
1 baths - beds |
show details | |

|
#17
Counce Dr
Savannah, TN 38372
|
1,204 sq. feet
|
2 baths - beds |
show details | |

|
#18
Ryan St
Savannah, TN 38372
|
1,220 sq. feet
|
1 baths - beds |
show details | |

|
#19
County Road 114
Corinth, MS 38834
|
1,083 sq. feet
|
1 baths - beds |
show details | |

|
#20
Hines Gin Rd
Selmer, TN 38375
|
2,153 sq. feet
|
2 baths - beds |
show details |
| Photo | Address | Area | Beds / Baths | Price | Details |
|---|---|---|---|---|---|

|
#21
Pinhook Dr
Savannah, TN 38372
|
1,634 sq. feet
|
1 baths - beds |
show details | |

|
#22
Buena Vista Rd
Bethel Springs, TN 38315
|
1,248 sq. feet
|
2 baths - beds |
show details | |

|
#23
County Road 116
Corinth, MS 38834
|
1,325 sq. feet
|
1 baths - beds |
show details | |

|
#24
Plainview Dr
Savannah, TN 38372
|
1,570 sq. feet
|
2 baths - beds |
show details | |

|
#25
Florence Rd
Savannah, TN 38372
|
784 sq. feet
|
1 baths - beds |
show details | |

|
#26
Second St
Enville, TN 38332
|
1,432 sq. feet
|
1 baths - beds |
show details | |

|
#27
County Home Rd
Savannah, TN 38372
|
999 sq. feet
|
1 baths - beds |
show details | |

|
#28
Stadium Dr
Savannah, TN 38372
|
732 sq. feet
|
1 baths - beds |
show details | |

|
#29
Main St
Enville, TN 38332
|
1,600 sq. feet
|
2 baths - beds |
show details | |

|
#30
Shanna Dr
Selmer, TN 38375
|
1,107 sq. feet
|
1 baths - beds |
show details |
| Photo | Address | Area | Beds / Baths | Price | Details |
|---|---|---|---|---|---|

|
#31
Gin Rd
Michie, TN 38357
|
1,583 sq. feet
|
1 baths - beds |
show details | |

|
#32
Clifton Rd
Savannah, TN 38372
|
1,621 sq. feet
|
1 baths - beds |
show details | |

|
#33
Magnolia Rd
Corinth, MS 38834
|
2,791 sq. feet
|
2 baths - beds |
show details | |

|
#34
Wynbrooke Dr
Corinth, MS 38834
|
1,307 sq. feet
|
1 baths - beds |
show details | |

|
#35
Thornwood Trl
Corinth, MS 38834
|
2,747 sq. feet
|
1 baths - beds |
show details | |

|
#36
Rosewood Dr
Savannah, TN 38372
|
1,171 sq. feet
|
1 baths - beds |
show details | |

|
#37
N Shiloh Rd
Corinth, MS 38834
|
1,738 sq. feet
|
1 baths - beds |
show details | |

|
#38
County Road 173
Corinth, MS 38834
|
1,919 sq. feet
|
1 baths - beds |
show details | |

|
#39
Clifton Rd
Savannah, TN 38372
|
1,002 sq. feet
|
1 baths - beds |
show details | |

|
#40
Horton Rd
Enville, TN 38332
|
1,288 sq. feet
|
2 baths - beds |
show details |
| Photo | Address | Area | Beds / Baths | Price | Details |
|---|---|---|---|---|---|

|
#41
County Road 151
Corinth, MS 38834
|
1,582 sq. feet
|
1 baths - beds |
show details | |

|
#42
Garey Loop
Savannah, TN 38372
|
1,033 sq. feet
|
1 baths - beds |
show details | |

|
#43
Buena Vista Rd
Bethel Springs, TN 38315
|
1,413 sq. feet
|
2 baths - beds |
show details | |

|
#44
Park St
Savannah, TN 38372
|
1,659 sq. feet
|
2 baths - beds |
show details | |

|
#45
Daniel St
Savannah, TN 38372
|
1,276 sq. feet
|
2 baths - beds |
show details | |

|
#46
Capooth Rd
Ramer, TN 38367
|
1,684 sq. feet
|
3 baths - beds |
show details | |

|
#47
Capooth Rd
Ramer, TN 38367
|
1,684 sq. feet
|
3 baths - beds |
show details | |

|
#48
Thomas St
Savannah, TN 38372
|
1,608 sq. feet
|
2 baths - beds |
show details | |

|
#49
Jones Rd
Savannah, TN 38372
|
1,387 sq. feet
|
2 baths - beds |
show details | |

|
Check over 1 million property listings on Foreclosure.com!
|
browse all offers | |||


 | Sold property in IL, ready to look near Jackson, TN (40 replies) |
| Jackson, Tennesse (30 replies) |

Median year apartment built: 1973
Household type by relationship:
Households: 407- Male householders: 92 (14 living alone), Female householders: 47 (11 living alone)
91 spouses (91 opposite-sex spouses), 0 unmarried partners, (0 opposite-sex unmarried partners), 125 children (117 natural, 0 adopted, 8 stepchildren), 2 grandchildren, 14 brothers or sisters, 22 parents, 0 foster children, 0 other relatives, 11 non-relatives
Size of family households: 48 2-persons, 28 3-persons, 33 4-persons, 8 5-persons.
Size of nonfamily households: 25 1-person.
54 married couples with children.
7 single-parent households (0 men, 7 women).
All residents speak only English at home
| Here: | 5.7 |
| State: | 6.5 |
| Here: | 4.6 |
| State: | 4.4 |

- Bedrooms in owner-occupied houses and condos in Stantonville, Tennessee
- 0no bedroom
- 01 bedroom
- 222 bedrooms
- 663 bedrooms
- 314 bedrooms
- 45+ bedrooms

- Bedrooms in renter-occupied apartments in Stantonville, Tennessee
- 0no bedroom
- 01 bedroom
- 122 bedrooms
- 73 bedrooms
- 24 bedrooms
- 05+ bedrooms

- Cars and other vehicles available in Stantonville in owner-occupied houses/condos
- 2no vehicle
- 201 vehicle
- 362 vehicles
- 593 vehicles
- 54 vehicles
- 25+ vehicles

- Cars and other vehicles available in Stantonville in renter-occupied apartments
- 0no vehicle
- 161 vehicle
- 22 vehicles
- 13 vehicles
- 24 vehicles
- 05+ vehicles

- Rooms in owner-occupied houses in Stantonville, Tennessee
- 01 room
- 02 rooms
- 23 rooms
- 124 rooms
- 455 rooms
- 146 rooms
- 67 rooms
- 338 rooms
- 139+ rooms

- Rooms in renter-occupied apartments in Stantonville, Tennessee
- 01 room
- 02 rooms
- 03 rooms
- 94 rooms
- 55 rooms
- 26 rooms
- 47 rooms
- 08 rooms
- 09+ rooms


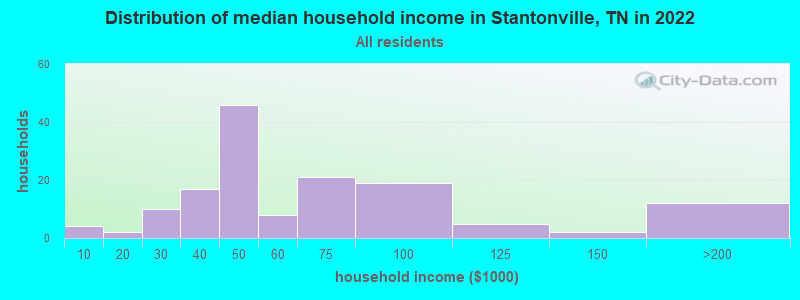
Stantonville, TN household income distribution

- 4Less than $10,000
- 2$10,000 to $19,999
- 10$20,000 to $29,999
- 17$30,000 to $39,999
- 46$40,000 to $49,999
- 8$50,000 to $59,999
- 21$60,000 to $74,999
- 19$75,000 to $99,999
- 5$100,000 to $124,999
- 2$125,000 to $149,999
- 12$150,000 to $199,999
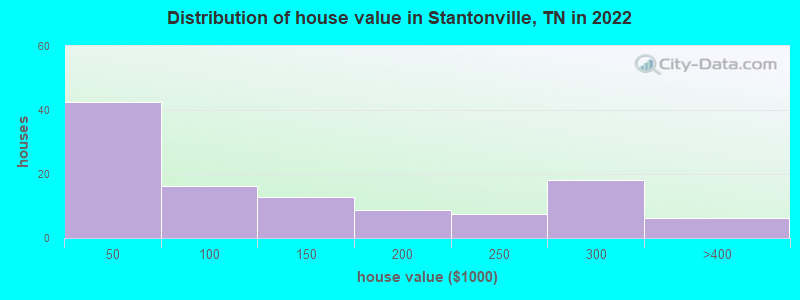
Home value of owner - occupied houses in 2022 in Stantonville, TN
-
- 3Less than $10,000
- 0$10,000 to $14,999
- 4$25,000 to $29,999
- 31$30,000 to $34,999
- 2$40,000 to $49,999
- 3$50,000 to $59,999
- 7$80,000 to $89,999
- 1$90,000 to $99,999
- 9$100,000 to $124,999
- 3$125,000 to $149,999
- 4$150,000 to $174,999
- 4$175,000 to $199,999
- 7$200,000 to $249,999
- 18$250,000 to $299,999
- 6$300,000 to $399,999
Rent paid by renters in 2022 in Stantonville, TN
-
- 1$400 to $449
- 1$500 to $549
- 4$550 to $599
- 11No cash rent


Percentage of workers working in this county: 35.1%
Number of people working at home: 0 (0.0% of all workers)
Travel time to work (commute)
- Less than 5 minutes: 14
- 5 to 9 minutes: 21
- 10 to 14 minutes: 3
- 15 to 19 minutes: 15
- 20 to 24 minutes: 48
- 25 to 29 minutes: 3
- 30 to 34 minutes: 12
- 35 to 39 minutes: 2
- 40 to 44 minutes: 1
- 45 to 59 minutes: 12
- 60 to 89 minutes: 3
- 90 or more minutes: 6
Means of transportation to work:
- Drove a car alone: 98 (72.6%)
- Carpooled: 18 (13.3%)
- Walked: 6 (4.4%)
- Other means: 5 (3.7%)
- Worked at home: 8 (5.9%)

- Unemployment by race in 2022
- Unemployment rate for White non-Hispanic residents
- 1.3%Females
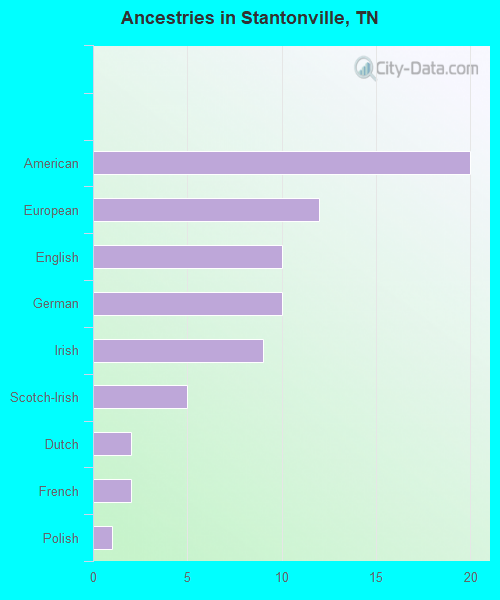
First ancestries reported:
- American: 20 (19.8%)
- European: 12 (11.9%)
- English: 10 (9.9%)
- German: 10 (9.9%)
- Irish: 9 (8.9%)
- Scotch-Irish: 5 (4.9%)
- Dutch: 2 (2.0%)
- French: 2 (2.0%)
- Polish: 1 (1.0%)
Place of birth for U.S.-born residents:
- This state: 276
- Other state: 128
- Northeast: 17
- Midwest: 25
- South: 82
- West: 2
97.5% of Stantonville residents lived in the same house 1 years ago.
Out of people who lived in different houses, 33.3% lived in this county.
Out of people who lived in different counties, 83.3% lived in Tennessee.
| Stantonville: | 97.5% |
| State average: | 87.0% |
Education attainment for males 25 years and older:
- No schooling: 0
- Nursery to 4th grade: 21
- 5th and 6th grade: 1
- 7th and 8th grade: 0
- 9th grade: 2
- 10th grade: 0
- 11th grade: 4
- 12th grade, no diploma: 0
- High school graduate (or equivalency): 76
- Less than 1 year of college: 10
- Some college more than 1 year, no degree: 1
- Associate degree: 0
- Bachelor's degree: 14
- Master's degree: 8
- Professional school degree: 0
- Doctorate degree: 0

Education attainment for females 25 years and older:
- No schooling: 1
- Nursery to 4th grade: 0
- 5th and 6th grade: 0
- 7th and 8th grade: 0
- 9th grade: 0
- 10th grade: 5
- 11th grade: 17
- 12th grade, no diploma: 0
- High school graduate (or equivalency): 65
- Less than 1 year of college: 4
- Some college more than 1 year, no degree: 14
- Associate degree: 9
- Bachelor's degree: 5
- Master's degree: 4
- Professional school degree: 5
- Doctorate degree: 0


Housing units in structures:
- One, detached: 99
- Mobile homes: 61
Median worth of mobile homes: $36,518
House/condo owner moved in on average 20 years ago
Renter moved in on average 1 years ago

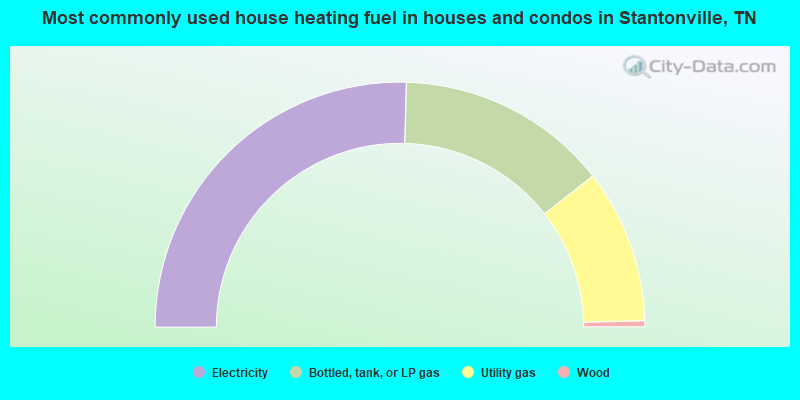
- 50.8%Electricity
- 28.0%Bottled, tank, or LP gas
- 20.3%Utility gas
- 0.8%Wood
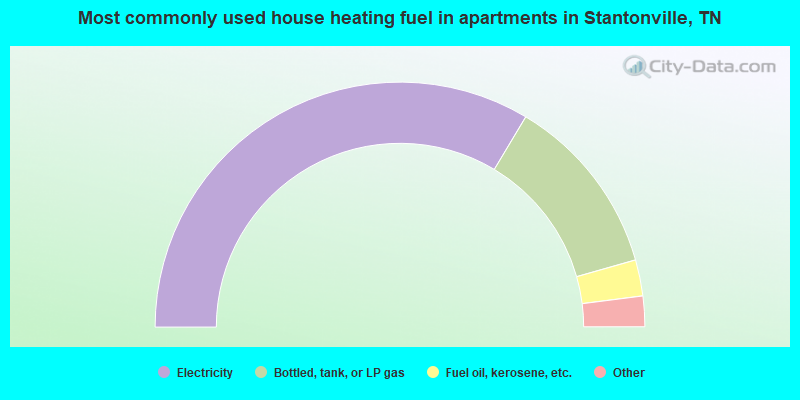
- 70.0%Electricity
- 25.0%Bottled, tank, or LP gas
- 5.0%Fuel oil, kerosene, etc.
Private vs. public school enrollment:
| Here: | 0.0% |
| Tennessee: | 15.0% |
| Here: | 0.0% |
| Tennessee: | 16.2% |
| Here: | 97.3% |
| Tennessee: | 23.5% |


