Starkville, MS (Mississippi) Houses and Residents
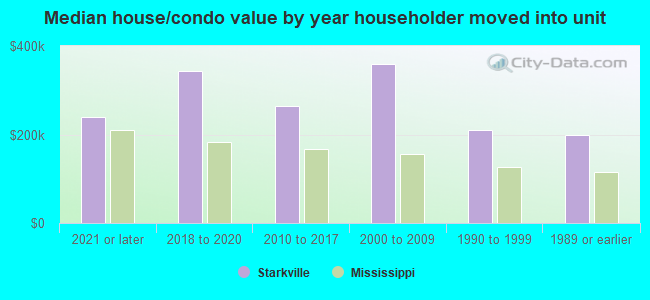
| Starkville: | $262,583 |
| Mississippi: | $162,500 |
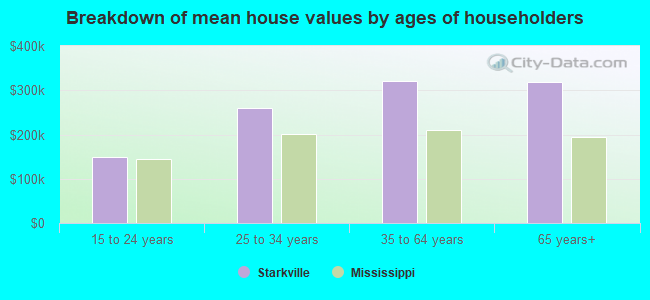
Mean price in 2022:
Detached houses: $322,666
Here: $322,666 State: $226,494 Townhouses or other attached units: $159,908
Here: $159,908 State: $254,198 In 5-or-more-unit structures: $240,011
Here: $240,011 State: $359,860 Mobile homes: $15,513
Here: $15,513 State: $73,695
Total population: 24,886 (Urban population: 20,371 (all inside urban clusters), Rural population: 1,666 (41 farm, 1,625 nonfarm))
Houses: 13,482 (11,020 occupied: 4,204 owner occupied, 6,933 renter occupied)
| % of renters here: | 62% |
| State: | 30% |
Housing density: 525 houses/condos per square mile
Median price asked for vacant for-sale houses and condos in 2022: $149,081.
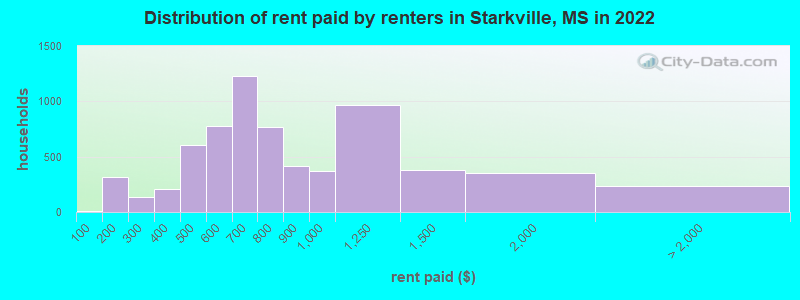
Median contract rent in 2022: $693 (lower quartile is $534, upper quartile is $996)
Median rent asked for vacant for-rent units in 2022: $726
Median gross rent in Starkville, MS in 2022: $838
Housing units in Starkville with a mortgage: 2,415 (152 second mortgage, 3 home equity loan, 118 both second mortgage and home equity loan)
Houses without a mortgage: 17
Median household income for houses/condos with a mortgage: $112,624
Median household income for apartments without a mortgage: $81,076
Median monthly housing costs: $855
Compare current foreclosures in Starkville, MS:
| Photo | Address | Area | Beds / Baths | Price | Details |
|---|---|---|---|---|---|

|
#1
Goldfinch Ln
Starkville, MS 39759
|
2,046 sq. feet
|
2 baths 4 beds |
show details | |

|
#2
Zuber St
Starkville, MS 39759
|
- sq. feet
|
- baths - beds |
show details | |

|
#3
Longview Adaton Rd
Starkville, MS 39759
|
- sq. feet
|
- baths - beds |
show details | |

|
#4
Spruill Pl
Starkville, MS 39759
|
- sq. feet
|
- baths - beds |
show details | |

|
#5
Rock Hill Rd
Starkville, MS 39759
|
- sq. feet
|
- baths - beds |
show details | |

|
#6
Sixteenth Section Rd
Starkville, MS 39759
|
- sq. feet
|
- baths - beds |
show details | |

|
#7
L A Jones Ln
Starkville, MS 39759
|
- sq. feet
|
- baths - beds |
show details | |

|
#8
Owens Dr
Starkville, MS 39759
|
- sq. feet
|
- baths - beds |
show details | |

|
#9
Watt Hill Rd
Starkville, MS 39759
|
- sq. feet
|
- baths - beds |
show details | |

|
#10
Old Crawford Rd
Starkville, MS 39759
|
- sq. feet
|
- baths - beds |
show details |
| Photo | Address | Area | Beds / Baths | Price | Details |
|---|---|---|---|---|---|

|
#11
Robindale Rd
Starkville, MS 39759
|
- sq. feet
|
- baths - beds |
show details | |

|
#12
Carver Dr Apt D
Starkville, MS 39759
|
- sq. feet
|
- baths - beds |
show details | |

|
#13
Cox Loop
Starkville, MS 39759
|
- sq. feet
|
- baths - beds |
show details | |

|
#14
Rock Hill Rd
Starkville, MS 39759
|
- sq. feet
|
- baths - beds |
show details | |

|
#15
Green St Apt C1
Starkville, MS 39759
|
- sq. feet
|
- baths - beds |
show details | |

|
#16
Avondale St
Starkville, MS 39759
|
- sq. feet
|
- baths - beds |
show details | |

|
#17
Wilkins Rd
Starkville, MS 39759
|
- sq. feet
|
- baths - beds |
show details | |

|
#18
Old Highway 25
Starkville, MS 39759
|
- sq. feet
|
- baths - beds |
show details | |

|
#19
Walter Bell Rd
Starkville, MS 39759
|
- sq. feet
|
- baths - beds |
show details | |

|
#20
Walter Bell Rd
Starkville, MS 39759
|
- sq. feet
|
- baths - beds |
show details |
| Photo | Address | Area | Beds / Baths | Price | Details |
|---|---|---|---|---|---|

|
#21
Albert Rd
Starkville, MS 39759
|
- sq. feet
|
- baths - beds |
show details | |

|
#22
Old West Point Rd
Starkville, MS 39759
|
- sq. feet
|
- baths - beds |
show details | |

|
#23
Epsilon Ln
Starkville, MS 39759
|
- sq. feet
|
- baths - beds |
show details | |

|
#24
Williams Rd
Starkville, MS 39759
|
- sq. feet
|
- baths - beds |
show details | |

|
#25
Ridgeland Dr
Starkville, MS 39759
|
- sq. feet
|
- baths - beds |
show details | |

|
#26
Carver Dr
Starkville, MS 39759
|
- sq. feet
|
- baths - beds |
show details | |

|
#27
Old West Point Rd
Starkville, MS 39759
|
- sq. feet
|
- baths - beds |
show details | |

|
#28
Pinecrest Rd
Starkville, MS 39759
|
- sq. feet
|
- baths - beds |
show details | |

|
#29
Louisville St Apt 28
Starkville, MS 39759
|
- sq. feet
|
- baths - beds |
show details | |

|
#30
Churchill Cir
Starkville, MS 39759
|
- sq. feet
|
- baths - beds |
show details |
| Photo | Address | Area | Beds / Baths | Price | Details |
|---|---|---|---|---|---|

|
#31
Water Well Rd
Starkville, MS 39759
|
- sq. feet
|
- baths - beds |
show details | |

|
#32
Turkey Creek Rd
Starkville, MS 39759
|
- sq. feet
|
- baths - beds |
show details | |

|
#33
Old West Point Rd
Starkville, MS 39759
|
- sq. feet
|
- baths - beds |
show details | |

|
#34
Crest Oak Dr
Starkville, MS 39759
|
- sq. feet
|
- baths - beds |
show details | |

|
#35
Vine St
Starkville, MS 39759
|
- sq. feet
|
- baths - beds |
show details | |

|
#36
Chase Ln
Starkville, MS 39759
|
- sq. feet
|
- baths - beds |
show details | |

|
#37
Cox Loop
Starkville, MS 39759
|
- sq. feet
|
- baths - beds |
show details | |

|
#38
Azalea Ln
Starkville, MS 39759
|
- sq. feet
|
- baths - beds |
show details | |

|
#39
Osborn Rd
Starkville, MS 39759
|
- sq. feet
|
- baths - beds |
show details | |

|
#40
Shepherd Rd
Starkville, MS 39759
|
- sq. feet
|
- baths - beds |
show details |
| Photo | Address | Area | Beds / Baths | Price | Details |
|---|---|---|---|---|---|

|
#41
Blackjack Rd
Starkville, MS 39759
|
- sq. feet
|
- baths - beds |
show details | |

|
#42
Chase Ln
Starkville, MS 39759
|
- sq. feet
|
- baths - beds |
show details | |

|
#43
Ridgeland Dr
Starkville, MS 39759
|
- sq. feet
|
- baths - beds |
show details | |

|
#44
Locksley Way Apt 25
Starkville, MS 39759
|
- sq. feet
|
- baths - beds |
show details | |

|
#45
Dido Rd
Starkville, MS 39759
|
- sq. feet
|
- baths - beds |
show details | |

|
#46
S Jackson St Apt C
Starkville, MS 39759
|
- sq. feet
|
- baths - beds |
show details | |

|
#47
Middle Ct
Starkville, MS 39759
|
- sq. feet
|
- baths - beds |
show details | |

|
#48
Osborn Rd
Starkville, MS 39759
|
- sq. feet
|
- baths - beds |
show details | |

|
#49
Oriole Dr
Starkville, MS 39759
|
- sq. feet
|
- baths - beds |
show details | |

|
Check over 1 million property listings on Foreclosure.com!
|
browse all offers | |||

Latest news about housing in Starkville, MS collected exclusively by city-data.com from local newspapers, TV, and radio stations

 | Finding rental houses in Starkville / Columbus (0 replies) |
| Rental Houses in Starkville (28 replies) |
| Needed House for Rent in Starkville (1 reply) |
| Finding a house to rent near Starkville, MSU (15 replies) |
| All these states complaining about Californians moving there..... (116 replies) |
| Moving family to Starkville... What's it like? (23 replies) |
Median year apartment built: 1991
Household type by relationship:
Households: 24,119- Male householders: 5,604 (1,645 living alone), Female householders: 5,201 (1,888 living alone)
3,471 spouses (3,443 opposite-sex spouses), 778 unmarried partners, (766 opposite-sex unmarried partners), 5,041 children (4,562 natural, 349 adopted, 129 stepchildren), 481 grandchildren, 79 brothers or sisters, 242 parents, 0 foster children, 136 other relatives, 1,853 non-relatives
- In group quarters: 1,229
Size of family households: 2,778 2-persons, 1,015 3-persons, 761 4-persons, 330 5-persons, 75 6-persons, 43 7-or-more-persons.
Size of nonfamily households: 3,706 1-person, 1,784 2-persons, 390 3-persons, 156 4-persons.
2,629 married couples with children.
1,334 single-parent households (86 men, 1,248 women).
94.5% of residents of Starkville speak English at home.
1.0% of residents speak Spanish at home (79% speak English very well, 7% speak English well, 15% speak English not well).
1.2% of residents speak other Indo-European language at home (84% speak English very well, 15% speak English well).
3.1% of residents speak Asian or Pacific Island language at home (39% speak English very well, 16% speak English well, 11% speak English not well, 34% don't speak English at all).
0.2% of residents speak other language at home (100% speak English very well).
Foreign born population: 1,129 (4.7%)
(23.5% of them are naturalized citizens)
| Here: | 6.5 |
| State: | 6.3 |
| Here: | 4.2 |
| State: | 4.8 |
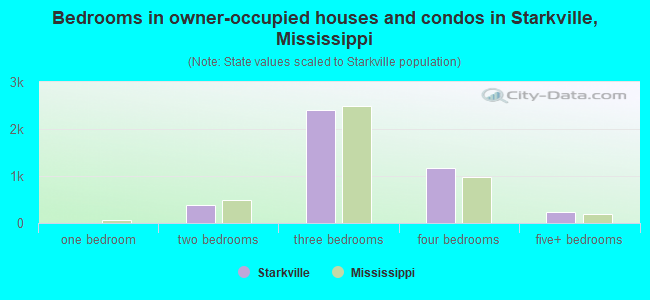
- Bedrooms in owner-occupied houses and condos in Starkville, Mississippi
- 19no bedroom
- 01 bedroom
- 3732 bedrooms
- 2,4073 bedrooms
- 1,1734 bedrooms
- 2325+ bedrooms
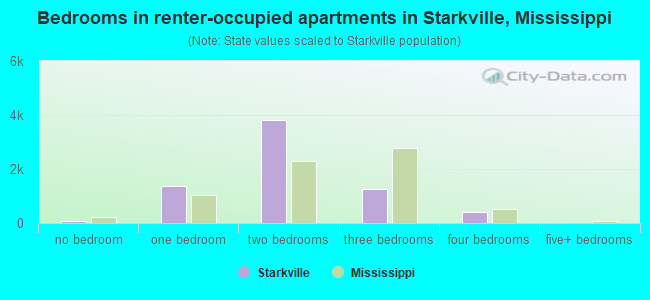
- Bedrooms in renter-occupied apartments in Starkville, Mississippi
- 61no bedroom
- 1,3571 bedroom
- 3,8212 bedrooms
- 1,2673 bedrooms
- 4124 bedrooms
- 155+ bedrooms
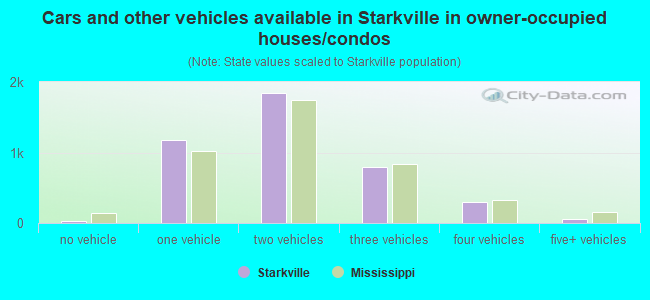
- Cars and other vehicles available in Starkville in owner-occupied houses/condos
- 31no vehicle
- 1,1841 vehicle
- 1,8392 vehicles
- 7963 vehicles
- 2934 vehicles
- 615+ vehicles
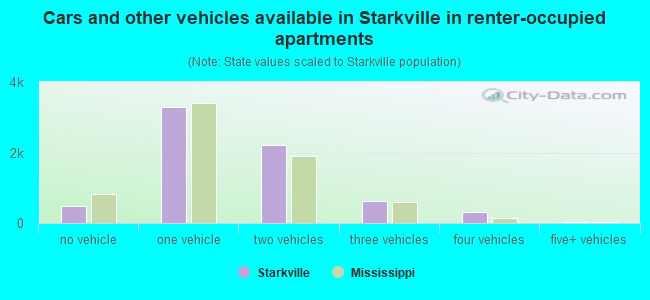
- Cars and other vehicles available in Starkville in renter-occupied apartments
- 494no vehicle
- 3,2891 vehicle
- 2,2092 vehicles
- 6163 vehicles
- 3114 vehicles
- 155+ vehicles
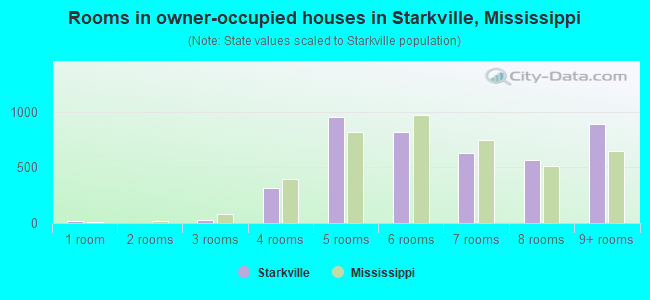
- Rooms in owner-occupied houses in Starkville, Mississippi
- 191 room
- 02 rooms
- 263 rooms
- 3114 rooms
- 9525 rooms
- 8166 rooms
- 6257 rooms
- 5628 rooms
- 8929+ rooms
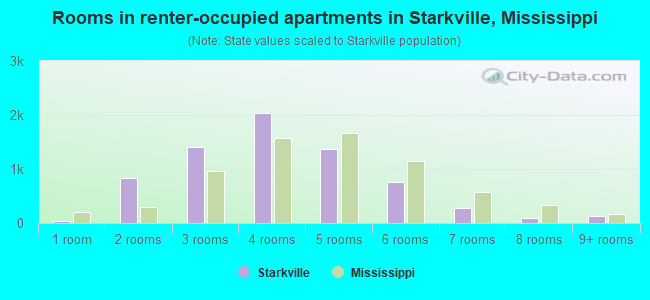
- Rooms in renter-occupied apartments in Starkville, Mississippi
- 451 room
- 8372 rooms
- 1,3993 rooms
- 2,0344 rooms
- 1,3665 rooms
- 7556 rooms
- 2747 rooms
- 858 rooms
- 1389+ rooms
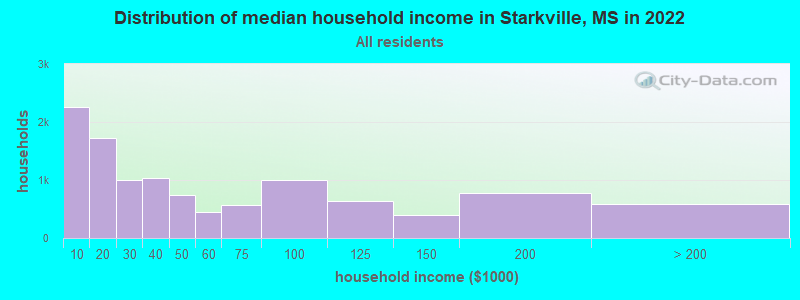
Starkville, MS household income distribution

- 2,260Less than $10,000
- 1,727$10,000 to $19,999
- 993$20,000 to $29,999
- 1,034$30,000 to $39,999
- 741$40,000 to $49,999
- 449$50,000 to $59,999
- 565$60,000 to $74,999
- 1,007$75,000 to $99,999
- 632$100,000 to $124,999
- 393$125,000 to $149,999
- 770$150,000 to $199,999
- 582$200,000 or more
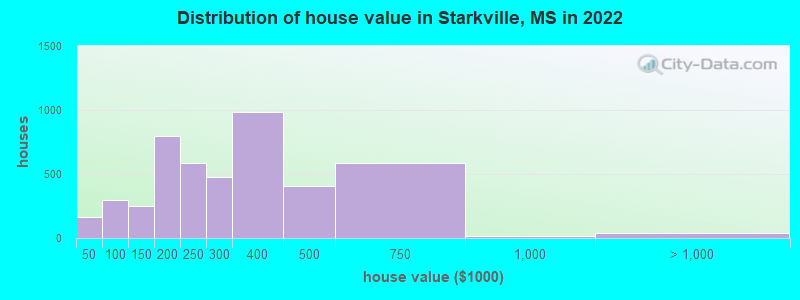
Home value of owner - occupied houses in 2022 in Starkville, MS
-
- 82Less than $10,000
- 24$10,000 to $14,999
- 6$15,000 to $19,999
- 48$40,000 to $49,999
- 35$50,000 to $59,999
- 42$70,000 to $79,999
- 96$80,000 to $89,999
- 77$90,000 to $99,999
- 164$100,000 to $124,999
- 82$125,000 to $149,999
- 256$150,000 to $174,999
- 542$175,000 to $199,999
- 582$200,000 to $249,999
- 477$250,000 to $299,999
- 985$300,000 to $399,999
- 403$400,000 to $499,999
- 586$500,000 to $749,999
- 16$750,000 to $999,999
- 21$1,000,000 to $1,499,999
- 18$2,000,000 or more
Rent paid by renters in 2022 in Starkville, MS
-
- 12Less than $100
- 234$100 to $149
- 81$150 to $199
- 70$200 to $249
- 67$250 to $299
- 70$300 to $349
- 133$350 to $399
- 278$400 to $449
- 329$450 to $499
- 515$500 to $549
- 265$550 to $599
- 580$600 to $649
- 646$650 to $699
- 430$700 to $749
- 340$750 to $799
- 416$800 to $899
- 369$900 to $999
- 967$1,000 to $1,249
- 381$1,250 to $1,499
- 351$1,500 to $1,999
- 23$3,500 or more
- 209No cash rent
Percentage of workers working in this county: 78.3%
Number of people working at home: 869 (7.8% of all workers)
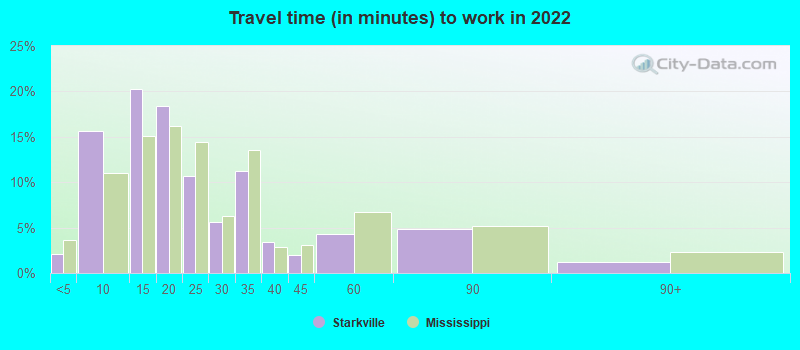
Travel time to work (commute)
- Less than 5 minutes: 290
- 5 to 9 minutes: 2,331
- 10 to 14 minutes: 2,881
- 15 to 19 minutes: 1,781
- 20 to 24 minutes: 604
- 25 to 29 minutes: 365
- 30 to 34 minutes: 787
- 35 to 39 minutes: 145
- 40 to 44 minutes: 115
- 45 to 59 minutes: 279
- 60 to 89 minutes: 476
- 90 or more minutes: 186
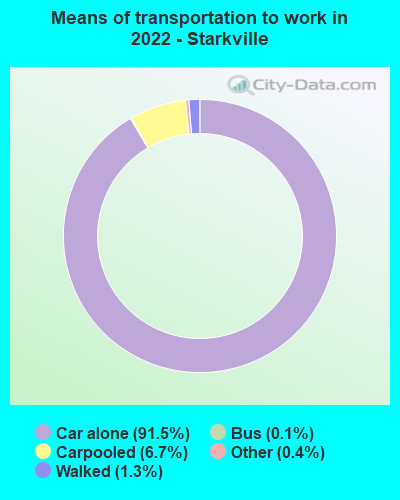
Means of transportation to work:
- Drove a car alone: 12,859 (85.3%)
- Carpooled: 1,045 (6.9%)
- Bus: 18 (0.1%)
- Taxi: 51 (0.3%)
- Walked: 211 (1.4%)
- Worked at home: 869 (5.8%)
- Unemployment by race in 2022
- Unemployment rate for White non-Hispanic residents
- 3.4%Males
- 6.1%Females
- Unemployment rate for Black residents
- 7.5%Males
- 10.8%Females
- Unemployment rate for Asian residents
- 6.4%Males
- Unemployment rate for Hispanic or Latino residents
- 10.8%Males
- 38.5%Females
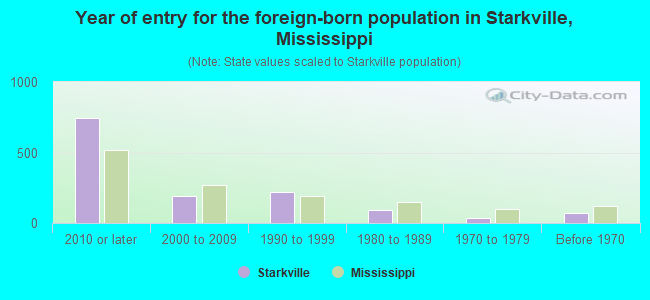
- Year of entry for the foreign-born population in Starkville, Mississippi
- 7462010 or later
- 1922000 to 2009
- 2171990 to 1999
- 891980 to 1989
- 341970 to 1979
- 69Before 1970
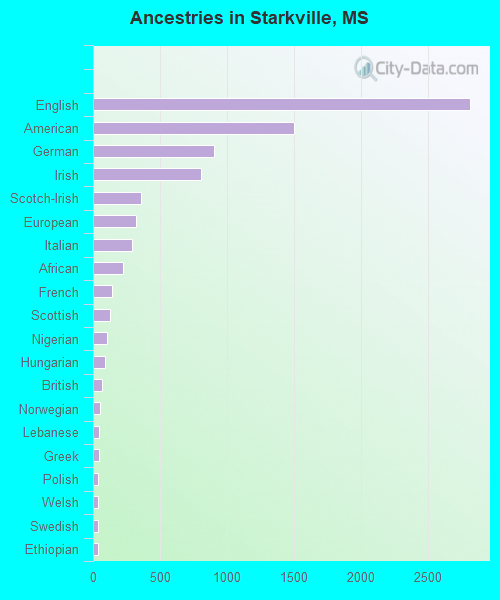
First ancestries reported:
- English: 2,816 (17.8%)
- American: 1,504 (9.5%)
- German: 907 (5.7%)
- Irish: 808 (5.1%)
- Scotch-Irish: 355 (2.2%)
- European: 323 (2.0%)
- Italian: 291 (1.8%)
- African: 221 (1.4%)
- French: 145 (0.9%)
- Scottish: 127 (0.8%)
- Nigerian: 104 (0.7%)
- Hungarian: 91 (0.6%)
- British: 67 (0.4%)
- Norwegian: 55 (0.3%)
- Lebanese: 47 (0.3%)
- Greek: 46 (0.3%)
- Polish: 39 (0.2%)
- Welsh: 39 (0.2%)
- Swedish: 38 (0.2%)
- Ethiopian: 34 (0.2%)
- Ukrainian: 25 (0.2%)
- Slovak: 22 (0.1%)
- Turkish: 18 (0.1%)
- Dutch: 13 (0.08%)
- French Canadian: 11 (0.07%)
- Iranian: 10 (0.06%)
- Latvian: 10 (0.06%)
- Jamaican: 9 (0.06%)
- Northern European: 8 (0.05%)
- Brazilian: 8 (0.05%)
- Russian: 6 (0.04%)
- Portuguese: 3 (0.02%)
- Croatian: 1 (0.01%)
Most common places of birth for foreign-born residents (%):
| Starkville: | 27.6% (331) |
| Mississippi: | 4.3% (2,948) |
| Starkville: | 11.7% (141) |
| Mississippi: | 5.8% (3,948) |
| Starkville: | 10.0% (120) |
| Mississippi: | 6.3% (4,325) |
| Starkville: | 7.9% (95) |
| Mississippi: | 1.1% (718) |
| Starkville: | 5.4% (65) |
| Mississippi: | 25.4% (17,354) |
| Starkville: | 5.1% (61) |
| Mississippi: | 1.5% (1,043) |
| Starkville: | 3.9% (47) |
| Mississippi: | 0.6% (414) |
| Starkville: | 2.9% (35) |
| Mississippi: | 0.7% (458) |
| Starkville: | 2.8% (34) |
| Mississippi: | 0.5% (314) |
| Starkville: | 2.7% (33) |
| Mississippi: | 5.1% (3,475) |
| Starkville: | 2.6% (31) |
| Mississippi: | 0.1% (100) |
| Starkville: | 2.3% (28) |
| Mississippi: | 0.1% (67) |
| Starkville: | 2.2% (27) |
| Mississippi: | 2.0% (1,390) |
| Starkville: | 1.7% (21) |
| Mississippi: | 0.4% (268) |
| Starkville: | 1.7% (21) |
| Mississippi: | 4.7% (3,211) |
| Starkville: | 1.7% (21) |
| Mississippi: | 3.1% (2,126) |
Place of birth for U.S.-born residents:
- This state: 15,933
- Other state: 6,974
- Northeast: 443
- Midwest: 1,329
- South: 4,618
- West: 575
70.6% of Starkville residents lived in the same house 1 years ago.
Out of people who lived in different houses, 34.9% lived in this county.
Out of people who lived in different counties, 61.3% lived in Mississippi.
| Starkville: | 70.6% |
| State average: | 88.9% |
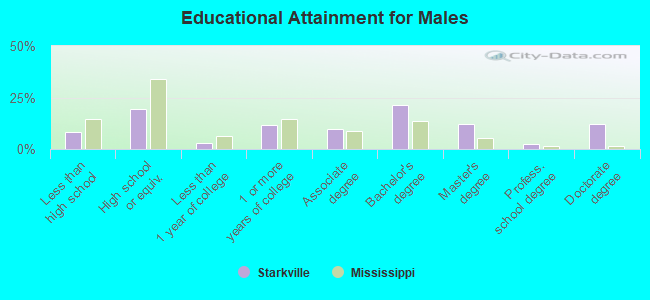
Education attainment for males 25 years and older:
- No schooling: 140
- Nursery to 4th grade: 21
- 5th and 6th grade: 9
- 7th and 8th grade: 29
- 9th grade: 40
- 10th grade: 49
- 11th grade: 193
- 12th grade, no diploma: 26
- High school graduate (or equivalency): 1,206
- Less than 1 year of college: 191
- Some college more than 1 year, no degree: 717
- Associate degree: 618
- Bachelor's degree: 1,349
- Master's degree: 750
- Professional school degree: 161
- Doctorate degree: 754
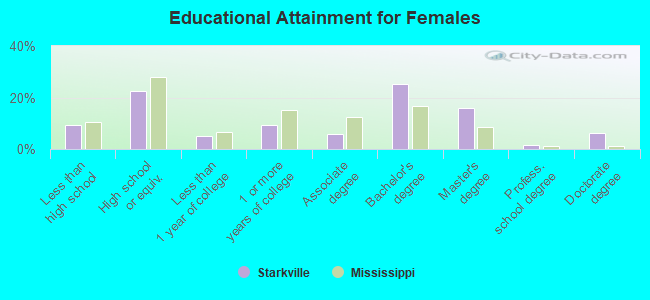
Education attainment for females 25 years and older:
- No schooling: 265
- Nursery to 4th grade: 0
- 5th and 6th grade: 11
- 7th and 8th grade: 100
- 9th grade: 35
- 10th grade: 32
- 11th grade: 146
- 12th grade, no diploma: 93
- High school graduate (or equivalency): 1,649
- Less than 1 year of college: 367
- Some college more than 1 year, no degree: 676
- Associate degree: 418
- Bachelor's degree: 1,859
- Master's degree: 1,167
- Professional school degree: 111
- Doctorate degree: 454
Housing units in structures:
- One, detached: 5,884
- One, attached: 454
- Two: 1,290
- 3 or 4: 1,613
- 5 to 9: 1,755
- 10 to 19: 1,198
- 20 to 49: 456
- 50 or more: 409
- Mobile homes: 420
Median worth of mobile homes: $11,825
Housing units lacking complete kitchen facilities in 2022: 1.6%
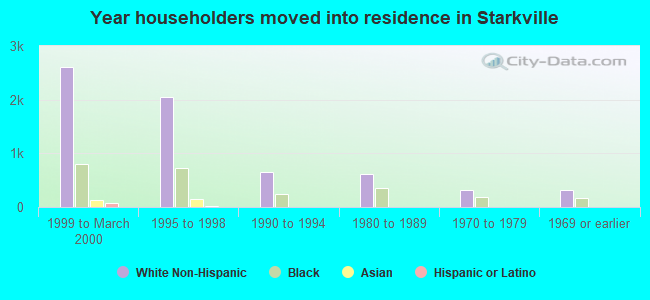
House/condo owner moved in on average 10 years ago
Renter moved in on average 1 years ago
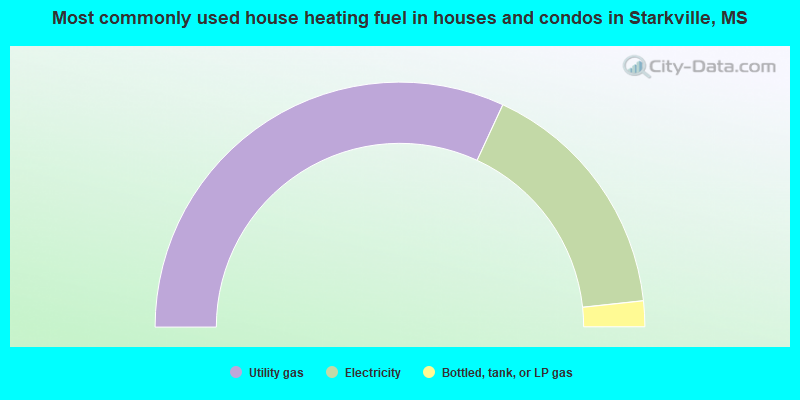
- 63.8%Utility gas
- 32.8%Electricity
- 3.4%Bottled, tank, or LP gas
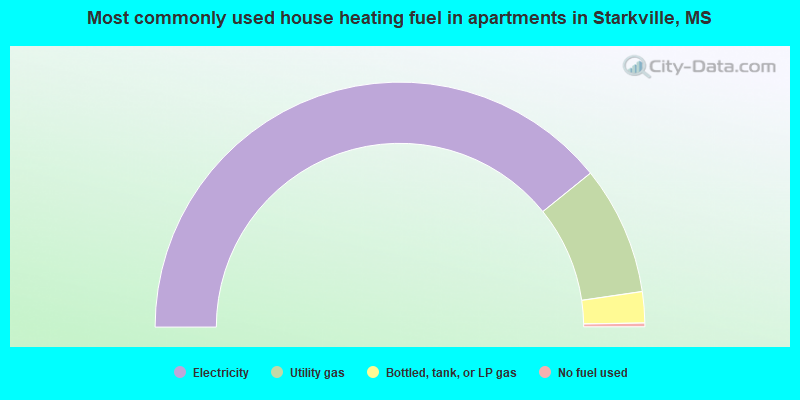
- 78.3%Electricity
- 17.0%Utility gas
- 4.1%Bottled, tank, or LP gas
- 0.5%No fuel used
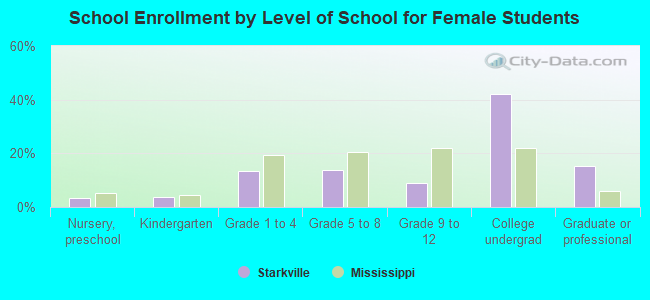
Private vs. public school enrollment:
| Here: | 29.3% |
| Mississippi: | 16.1% |
| Here: | 17.6% |
| Mississippi: | 14.6% |
| Here: | 3.1% |
| Mississippi: | 12.8% |