State College, PA (Pennsylvania) Houses and Residents
Estimated median house or condo value in 2022: $407,974 (it was $147,600 in 2000 )
State College:
$407,974Pennsylvania:
$245,500
Lower value quartile - upper value quartile: $249,068 - $515,342Mean price in 2022: Detached houses: $475,199 Here:
$475,199State:
$317,202
Townhouses or other attached units: $277,842 Here:
$277,842State:
$254,369
In 2-unit structures: $328,149 Here:
$328,149State:
$249,182
In 3-to-4-unit structures: $183,251 Here:
$183,251State:
$297,446
In 5-or-more-unit structures: $209,146 Here:
$209,146State:
$320,068
Mobile homes: $65,404 Here:
$65,404State:
$92,414
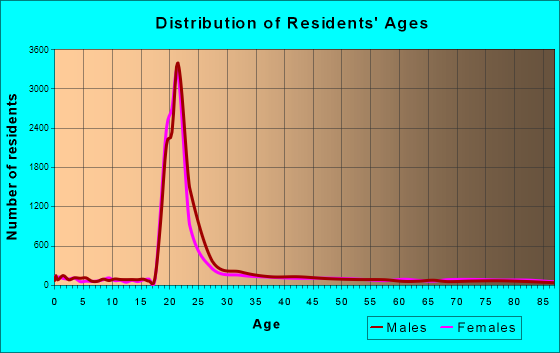
Total population: 42,100 (Urban population: 38,420, Rural population: 0)
Houses: 13,211 (11,490 occupied: 3,086 owner occupied, 8,693 renter occupied )
% of renters here:
74%State:
31%
Housing density: 2,909 houses/condos per square mile
Median price asked for vacant for-sale houses and condos in 2022 in this county: $312,647.
Median contract rent in 2022: $1,134 (lower quartile is $915, upper quartile is $1,529)
Median rent asked for vacant for-rent units in 2022: $786
Median gross rent in State College, PA in 2022: $1,191
Housing units in State College with a mortgage: 2,013 (163 second mortgage, 0 home equity loan, 165 both second mortgage and home equity loan )Houses without a mortgage: 83
Median household income for houses/condos with a mortgage: $135,267
Median household income for apartments without a mortgage: $131,223
Median monthly housing costs: $1,167
Data:
Median house or condo value ($)
Median house or condo value ($ change since 2000)
Median house or condo value ($) - White
Median house or condo value ($) - Black or African American
Median house or condo value ($) - Asian
Median house or condo value ($) - Hispanic or Latino
Median house or condo value ($) - American Indian and Alaska Native
Median house or condo value ($) - Multirace
Median house or condo value ($) - Other Race
Median price asked for mobile homes ($)
Household density (households per square mile)
Mean house or condo value by units in structure - 1, detached ($)
Mean house or condo value by units in structure - 1, attached ($)
Mean house or condo value by units in structure - 2 ($)
Mean house or condo value by units in structure by units in structure - 3 or 4 ($)
Mean house or condo value by units in structure - 5 or more ($)
Mean house or condo value by units in structure - Boat, RV, van, etc. ($)
Mean house or condo value by units in structure - Mobile home ($)
Median contract rent ($)
Median contract rent - Lower quartile ($)
Median contract rent - Upper quartile ($)
Median gross rent ($)
Urban houses (%)
Rural houses (%)
Houses occupied (%)
Houses occupied (% change since 2000)
Houses owner occupied (%)
Houses owner occupied (% change since 2000)
Houses renter occupied (%)
Houses renter occupied (% change since 2000)
Vacant housing units - For rent (%)
Vacant housing units - For rent (% change since 2000)
Vacant housing units - For sale only (%)
Vacant housing units - For sale only (% change since 2000)
Vacant housing units - Rented or sold, not occupied (%)
Vacant housing units - Rented or sold, not occupied (% change since 2000)
Vacant housing units - For seasonal, recreational, or occasional use (%)
Vacant housing units - For seasonal, recreational, or occasional use (% change since 2000)
Vacant housing units - For migrant workers (%)
Vacant housing units - For migrant workers (% change since 2000)
Vacant housing units - Other vacant (%)
Vacant housing units - Other vacant (% change since 2000)
Median monthly housing costs ($)
Median household income for houses/condos with a mortgage ($)
Median household income for houses/condos without a mortgage ($)
Median household income ($)
Median household income ($) - White
Median household income ($) - Black or African American
Median household income ($) - Asian
Median household income ($) - Hispanic or Latino
Median household income ($) - American Indian and Alaska Native
Median household income ($) - Multirace
Median household income ($) - Other Race
Mortgage status - with mortgage (%)
Mortgage status - with second mortgage (%)
Mortgage status - with home equity loan (%)
Mortgage status - with both second mortgage and home equity loan (%)
Mortgage status - without a mortgage (%)
Median year house/condo built
Median year apartment built
Household type by relationship - Male householder living alone (%)
Household type by relationship - Male householder not living alone (%)
Household type by relationship - Female householder living alone (%)
Household type by relationship - Female householder not living alone (%)
Household type by relationship - Opposite-Sex spouse (%)
Household type by relationship - Same-Sex spouse (%)
Household type by relationship - Opposite-Sex unmarried partner (%)
Household type by relationship - Same-Sex unmarried partner (%)
Household type by relationship - In group quarters (%)
Size of family households - 2-person household (%)
Size of family households - 3-person household (%)
Size of family households - 4-person household (%)
Size of family households - 5-person household (%)
Size of family households - 6-person household (%)
Size of family households - 7-or-more-person household (%)
Size of nonfamily households - 1-person household (%)
Size of nonfamily households - 2-person household (%)
Size of nonfamily households - 3-person household (%)
Size of nonfamily households - 4-person household (%)
Size of nonfamily households - 5-person household (%)
Size of nonfamily households - 6-person household (%)
Size of nonfamily households - 7-or-moreperson household (%)
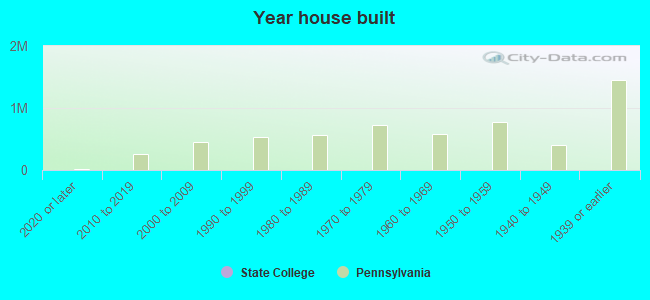
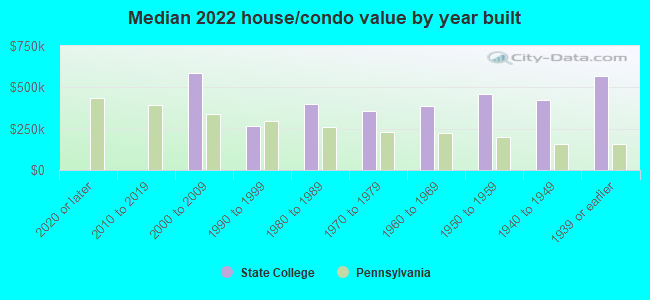
Year house built - Built 2010 or later (%)
Year house built - Built 2000 to 2009 (%)
Year house built - Built 1990 to 1999 (%)
Year house built - Built 1980 to 1989 (%)
Year house built - Built 1970 to 1979 (%)
Year house built - Built 1960 to 1969 (%)
Year house built - Built 1950 to 1959 (%)
Year house built - Built 1940 to 1949 (%)
Year house built - Built 1939 or earlier (%)
Median number of rooms in houses and condos
Median number of rooms in apartments
Median number of bedrooms in owner occupied houses
Mean number of bedrooms in owner occupied houses
Median number of bedrooms in renter occupied houses
Mean number of bedrooms in renter occupied houses
Median number of vehichles in owner occupied houses
Mean number of vehichles in owner occupied houses
Median number of vehichles in renter occupied houses
Mean number of vehichles in renter occupied houses
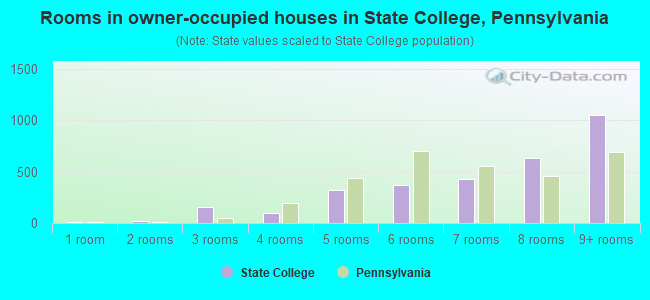
Rooms in owner-occupied houses - 1 room (%)
Rooms in owner-occupied houses - 2 rooms (%)
Rooms in owner-occupied houses - 3 rooms (%)
Rooms in owner-occupied houses - 4 rooms (%)
Rooms in owner-occupied houses - 5 rooms (%)
Rooms in owner-occupied houses - 6 rooms (%)
Rooms in owner-occupied houses - 7 rooms (%)
Rooms in owner-occupied houses - 8 rooms (%)
Rooms in owner-occupied houses - 9+ rooms (%)
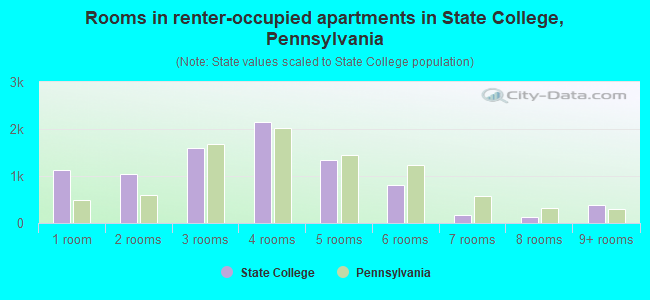
Rooms in renter-occupied houses - 1 room (%)
Rooms in renter-occupied houses - 2 rooms (%)
Rooms in renter-occupied houses - 3 rooms (%)
Rooms in renter-occupied houses - 4 rooms (%)
Rooms in renter-occupied houses - 5 rooms (%)
Rooms in renter-occupied houses - 6 rooms (%)
Rooms in renter-occupied houses - 7 rooms (%)
Rooms in renter-occupied houses - 8 rooms (%)
Rooms in renter-occupied houses - 9+ rooms (%)
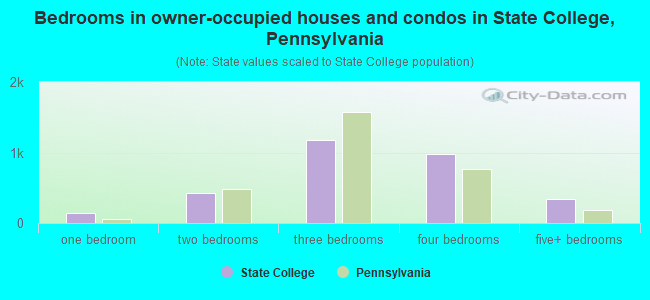
Bedrooms in owner-occupied houses - no bedrooms (%)
Bedrooms in owner-occupied houses - 1 bedroom (%)
Bedrooms in owner-occupied houses - 2 bedrooms (%)
Bedrooms in owner-occupied houses - 3 bedrooms (%)
Bedrooms in owner-occupied houses - 4 bedrooms (%)
Bedrooms in owner-occupied houses - 5+ bedrooms (%)
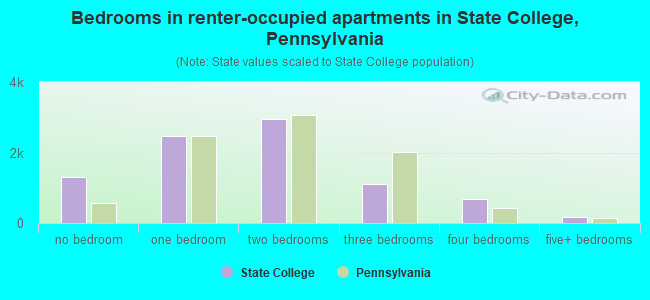
Bedrooms in renter-occupied houses - no bedrooms (%)
Bedrooms in renter-occupied houses - 1 bedroom (%)
Bedrooms in renter-occupied houses - 2 bedrooms (%)
Bedrooms in renter-occupied houses - 3 bedrooms (%)
Bedrooms in renter-occupied houses - 4 bedrooms (%)
Bedrooms in renter-occupied houses - 5+ bedrooms (%)
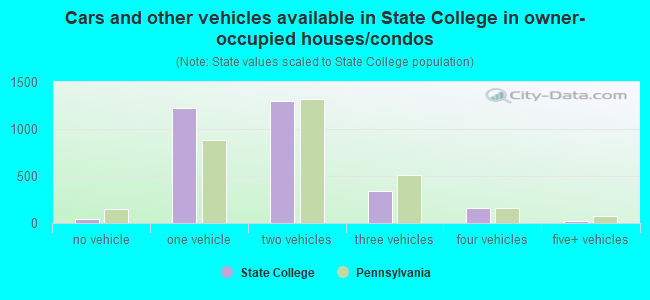
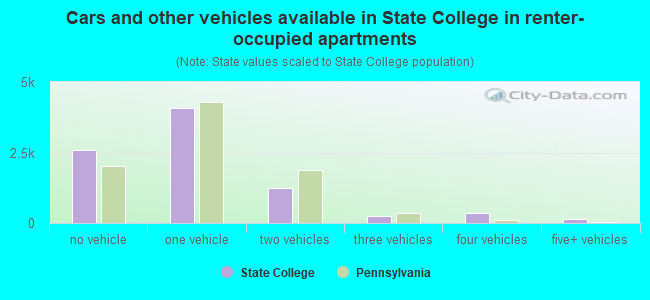
Vehicles available in owner-occupied houses - no vehicle available (%)
Vehicles available in owner-occupied houses - 1 vehicle available(%)
Vehicles available in owner-occupied houses - 2 Vehicles available (%)
Vehicles available in owner-occupied houses - 3 Vehicles available (%)
Vehicles available in owner-occupied houses - 4 Vehicles available (%)
Vehicles available in owner-occupied houses - 5+ Vehicles available (%)
Vehicles available in renter-occupied houses - no vehicle available (%)
Vehicles available in renter-occupied houses - 1 vehicle available (%)
Vehicles available in renter-occupied houses - 2 Vehicles available (%)
Vehicles available in renter-occupied houses - 3 Vehicles available (%)
Vehicles available in renter-occupied houses - 4 Vehicles available (%)
Vehicles available in renter-occupied houses - 5+ Vehicles available (%)
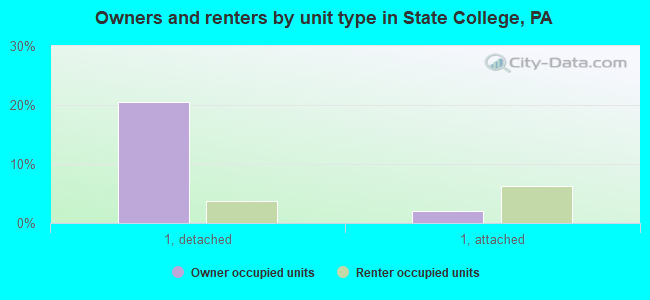
Housing units in structures - 1, detached (%)
Housing units in structures - 1, attached (%)
Housing units in structures - 2 (%)
Housing units in structures - 3 or 4 (%)
Housing units in structures - 5 to 9 (%)
Housing units in structures - 10 to 19 (%)
Housing units in structures - 20 to 49 (%)
Housing units in structures - 50 or more (%)
Housing units in structures - Mobile home (%)
Housing units in structures - Boat, RV, van, etc. (%)
Housing units in structures - Owners - 1, detached (%)
Housing units in structures - Owners - 1, attached (%)
Housing units in structures - Owners - 2 (%)
Housing units in structures - Owners - 3 or 4 (%)
Housing units in structures - Owners - 5 to 9 (%)
Housing units in structures - Owners - 10 to 19 (%)
Housing units in structures - Owners - 20 to 49 (%)
Housing units in structures - Owners - 50 or more (%)
Housing units in structures - Owners - Mobile home (%)
Housing units in structures - Owners - Boat, RV, van, etc. (%)
Housing units in structures - Renters - 1, detached (%)
Housing units in structures - Renters - 1, attached (%)
Housing units in structures - Renters - 2 (%)
Housing units in structures - Renters - 3 or 4 (%)
Housing units in structures - Renters - 5 to 9 (%)
Housing units in structures - Renters - 10 to 19 (%)
Housing units in structures - Renters - 20 to 49 (%)
Housing units in structures - Renters - 50 or more (%)
Housing units in structures - Renters - Mobile home (%)
Housing units in structures - Renters - Boat, RV, van, etc. (%)
House/condo owner moved in on average (years ago)
Renter moved in on average (years ago)
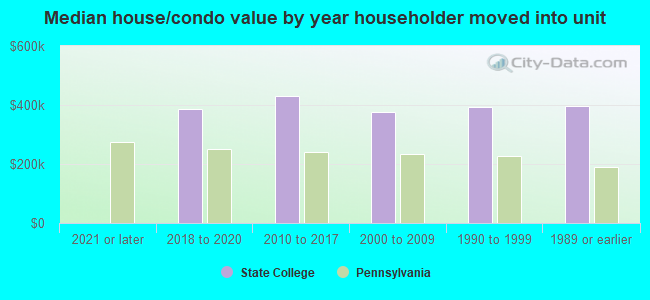
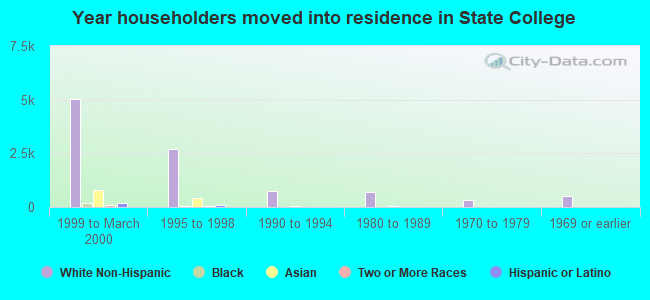
Year householder moved into unit - Moved in 1999 to March 2000 (%)
Year householder moved into unit - Moved in 1999 to March 2000 (%) - White
Year householder moved into unit - Moved in 1999 to March 2000 (%) - Black or African American
Year householder moved into unit - Moved in 1999 to March 2000 (%) - Asian
Year householder moved into unit - Moved in 1999 to March 2000 (%) - Hispanic or Latino
Year householder moved into unit - Moved in 1999 to March 2000 (%) - American Indian and Alaska Native
Year householder moved into unit - Moved in 1999 to March 2000 (%) - Multirace
Year householder moved into unit - Moved in 1999 to March 2000 (%) - Other Race
Year householder moved into unit - Moved in 1995 to 1998 (%)
Year householder moved into unit - Moved in 1995 to 1998 (%) - White
Year householder moved into unit - Moved in 1995 to 1998 (%) - Black or African American
Year householder moved into unit - Moved in 1995 to 1998 (%) - Asian
Year householder moved into unit - Moved in 1995 to 1998 (%) - Hispanic or Latino
Year householder moved into unit - Moved in 1995 to 1998 (%) - American Indian and Alaska Native
Year householder moved into unit - Moved in 1995 to 1998 (%) - Multirace
Year householder moved into unit - Moved in 1995 to 1998 (%) - Other Race
Year householder moved into unit - Moved in 1990 to 1994 (%)
Year householder moved into unit - Moved in 1990 to 1994 (%) - White
Year householder moved into unit - Moved in 1990 to 1994 (%) - Black or African American
Year householder moved into unit - Moved in 1990 to 1994 (%) - Asian
Year householder moved into unit - Moved in 1990 to 1994 (%) - Hispanic or Latino
Year householder moved into unit - Moved in 1990 to 1994 (%) - American Indian and Alaska Native
Year householder moved into unit - Moved in 1990 to 1994 (%) - Multirace
Year householder moved into unit - Moved in 1990 to 1994 (%) - Other Race
Year householder moved into unit - Moved in 1980 to 1989 (%)
Year householder moved into unit - Moved in 1980 to 1989 (%) - White
Year householder moved into unit - Moved in 1980 to 1989 (%) - Black or African American
Year householder moved into unit - Moved in 1980 to 1989 (%) - Asian
Year householder moved into unit - Moved in 1980 to 1989 (%) - Hispanic or Latino
Year householder moved into unit - Moved in 1980 to 1989 (%) - American Indian and Alaska Native
Year householder moved into unit - Moved in 1980 to 1989 (%) - Multirace
Year householder moved into unit - Moved in 1980 to 1989 (%) - Other Race
Year householder moved into unit - Moved in 1970 to 1979 (%)
Year householder moved into unit - Moved in 1970 to 1979 (%) - White
Year householder moved into unit - Moved in 1970 to 1979 (%) - Black or African American
Year householder moved into unit - Moved in 1970 to 1979 (%) - Asian
Year householder moved into unit - Moved in 1970 to 1979 (%) - Hispanic or Latino
Year householder moved into unit - Moved in 1970 to 1979 (%) - American Indian and Alaska Native
Year householder moved into unit - Moved in 1970 to 1979 (%) - Multirace
Year householder moved into unit - Moved in 1970 to 1979 (%) - Other Race
Year householder moved into unit - Moved in 1969 or earlier (%)
Year householder moved into unit - Moved in 1969 or earlier (%) - White
Year householder moved into unit - Moved in 1969 or earlier (%) - Black or African American
Year householder moved into unit - Moved in 1969 or earlier (%) - Asian
Year householder moved into unit - Moved in 1969 or earlier (%) - Hispanic or Latino
Year householder moved into unit - Moved in 1969 or earlier (%) - American Indian and Alaska Native
Year householder moved into unit - Moved in 1969 or earlier (%) - Multirace
Year householder moved into unit - Moved in 1969 or earlier (%) - Other Race
Housing units lacking complete plumbing facilities (%)
Housing units lacking complete kitchen facilities (%)
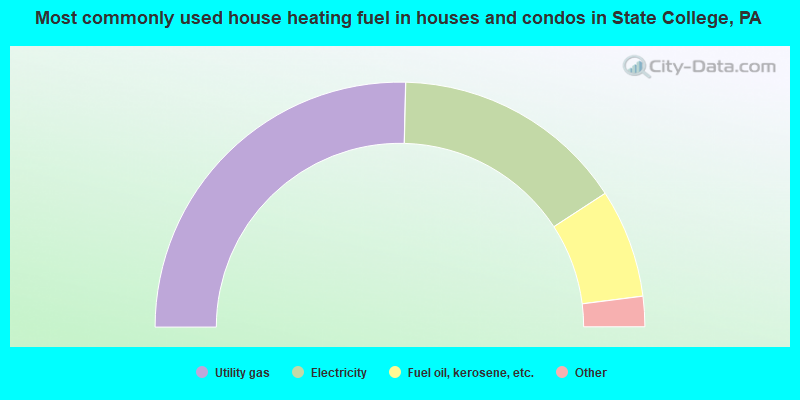
House heating fuel used in houses and condos - Utility gas (%)
House heating fuel used in houses and condos - Bottled, tank, or LP gas (%)
House heating fuel used in houses and condos - Electricity (%)
House heating fuel used in houses and condos - Fuel oil, kerosene, etc. (%)
House heating fuel used in houses and condos - Coal or coke (%)
House heating fuel used in houses and condos - Wood (%)
House heating fuel used in houses and condos - Solar energy (%)
House heating fuel used in houses and condos - Other fuel (%)
House heating fuel used in houses and condos - No fuel used (%)
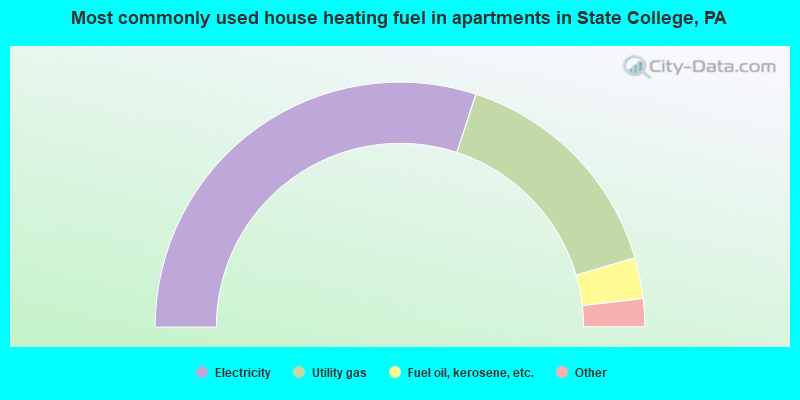
House heating fuel used in apartments - Utility gas (%)
House heating fuel used in apartments - Bottled, tank, or LP gas (%)
House heating fuel used in apartments - Electricity (%)
House heating fuel used in apartments - Fuel oil, kerosene, etc. (%)
House heating fuel used in apartments - Coal or coke (%)
House heating fuel used in apartments - Wood (%)
House heating fuel used in apartments - Solar energy (%)
House heating fuel used in apartments - Other fuel (%)
House heating fuel used in apartments - No fuel used (%)
Median year house/condo built: 1962Median year apartment built: 1975Household type by relationship:
Households: 40,840
Male householders: 6,287 (2,772 living alone ), Female householders: 5,052 (2,184 living alone )2,724 spouses (2,696 opposite-sex spouses ), 289 unmarried partners , (284 opposite-sex unmarried partners ), 3,097 children (2,971 natural , 47 adopted , 77 stepchildren ), 149 grandchildren , 109 brothers or sisters , 102 parents , 0 foster children , 88 other relatives , 9,447 non-relatives In group quarters: 13,489
Size of family households: 1,735 2-persons , 753 3-persons , 729 4-persons , 170 5-persons , 7 6-persons , 74 7-or-more-persons .
Size of nonfamily households: 4,862 1-person , 1,770 2-persons , 580 3-persons , 854 4-persons , 340 5-persons , 97 6-persons , 101 7-or-more-persons .
1,632 married couples with children. single-parent households (83 men , 438 women ).
81.7% of residents of State College speak English at home. of residents speak Spanish at home (89% speak English very well , 9% speak English well , 1% speak English not well ).of residents speak other Indo-European language at home (84% speak English very well , 12% speak English well , 2% speak English not well , 2% don't speak English at all ).of residents speak Asian or Pacific Island language at home (60% speak English very well , 37% speak English well , 3% speak English not well ).of residents speak other language at home (98% speak English very well , 2% speak English well ).
Foreign born population: 5,712 (14.0%)of them are naturalized citizens )
Median number of rooms in houses and condos:
Median number of rooms in apartments
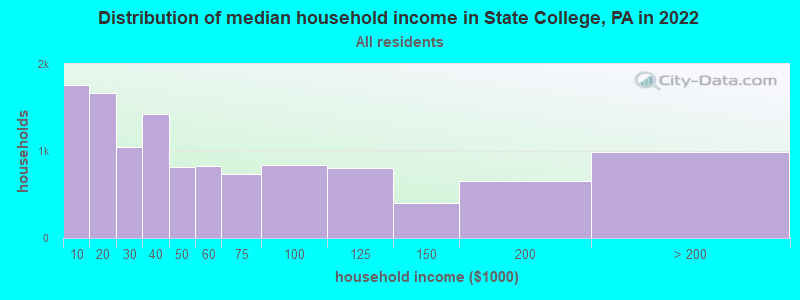
State College, PA household income distribution 1,758 Less than $10,0001,671 $10,000 to $19,9991,049 $20,000 to $29,9991,422 $30,000 to $39,999813 $40,000 to $49,999829 $50,000 to $59,999737 $60,000 to $74,999839 $75,000 to $99,999803 $100,000 to $124,999405 $125,000 to $149,999656 $150,000 to $199,999983 $200,000 or more
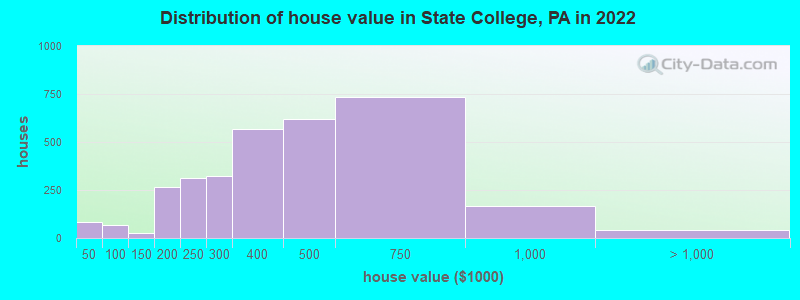
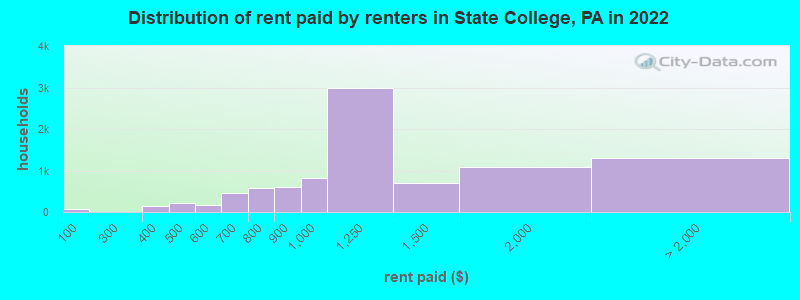
Home value of owner - occupied houses in 2022 in State College, PA 62 $10,000 to $14,99910 $35,000 to $39,99911 $40,000 to $49,9994 $50,000 to $59,99951 $70,000 to $79,9992 $80,000 to $89,99925 $125,000 to $149,999228 $150,000 to $174,99939 $175,000 to $199,999309 $200,000 to $249,999323 $250,000 to $299,999569 $300,000 to $399,999620 $400,000 to $499,999732 $500,000 to $749,999164 $750,000 to $999,99931 $1,000,000 to $1,499,9999 $2,000,000 or moreRent paid by renters in 2022 in State College, PA 65 Less than $10010 $300 to $349129 $350 to $39938 $400 to $449187 $450 to $49934 $500 to $549140 $550 to $599241 $600 to $649209 $650 to $699277 $700 to $749293 $750 to $799610 $800 to $899819 $900 to $9992,995 $1,000 to $1,249699 $1,250 to $1,4991,077 $1,500 to $1,999535 $2,000 to $2,499386 $2,500 to $2,99975 $3,000 to $3,499288 $3,500 or more17 No cash rent
Percentage of workers working in this county: 95.4%Number of people working at home: 2,310 (15.6% of all workers )
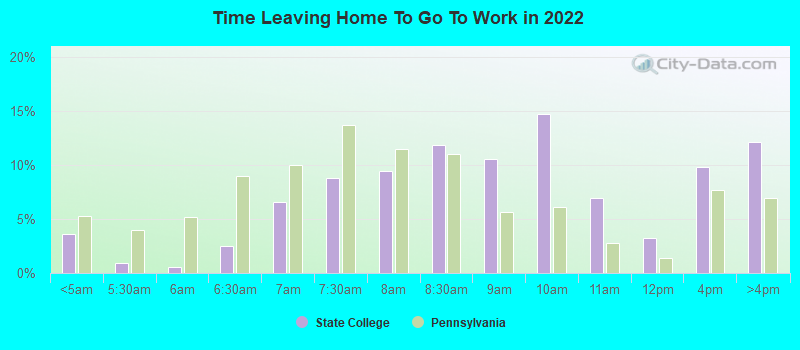
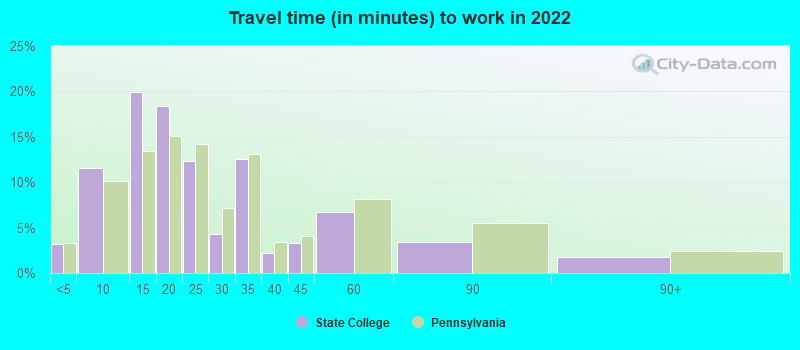
Travel time to work (commute)
Less than 5 minutes: 8675 to 9 minutes: 2,67910 to 14 minutes: 3,99115 to 19 minutes: 2,38420 to 24 minutes: 1,17225 to 29 minutes: 35130 to 34 minutes: 66335 to 39 minutes: 5140 to 44 minutes: 19945 to 59 minutes: 21560 to 89 minutes: 14990 or more minutes: 144
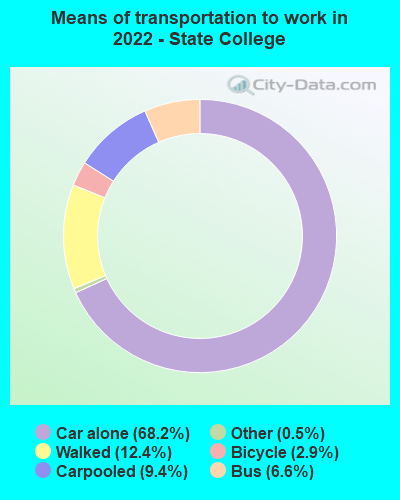
Means of transportation to work:
Drove a car alone: 17,286 (63.0%)Carpooled: 2,148 (7.8%)Bus : 1,080 (3.9%)Long-distance train or commuter rail : 6 (0.0%)Taxi: 189 (0.7%)Bicycle: 623 (2.3%)Walked: 3,368 (12.3%)Worked at home: 2,310 (8.4%)
Unemployment by race in 2022
Unemployment rate for White non-Hispanic residents 4.2% Males1.9% FemalesUnemployment rate for Asian residents 14.3% FemalesUnemployment rate for other race residents 60.6% FemalesUnemployment rate for two or more race residents 0.6% Males5.8% FemalesUnemployment rate for Hispanic or Latino residents 2.2% Males12.9% Females
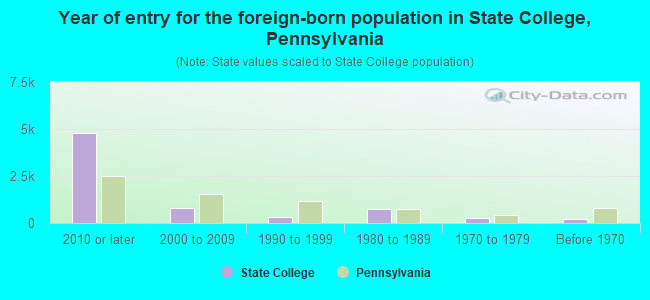
Year of entry for the foreign-born population in State College, Pennsylvania
4,797 2010 or later 811 2000 to 2009 343 1990 to 1999 757 1980 to 1989 263 1970 to 1979 208 Before 1970
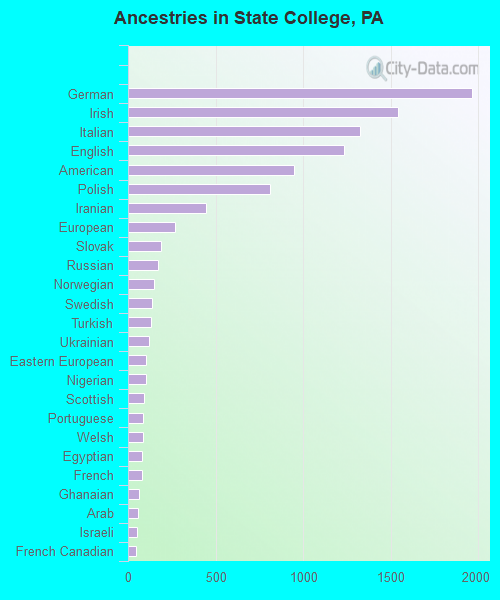
First ancestries reported:
German: 1,962 (12.8%)
Irish: 1,538 (10.1%)
Italian: 1,323 (8.7%)
English: 1,232 (8.1%)
American: 945 (6.2%)
Polish: 808 (5.3%)
Iranian: 447 (2.9%)
European: 266 (1.7%)
Slovak: 186 (1.2%)
Russian: 171 (1.1%)
Norwegian: 149 (1.0%)
Swedish: 139 (0.9%)
Turkish: 130 (0.9%)
Ukrainian: 117 (0.8%)
Eastern European: 100 (0.7%)
Nigerian: 100 (0.7%)
Scottish: 93 (0.6%)
Portuguese: 88 (0.6%)
Welsh: 86 (0.6%)
Egyptian: 82 (0.5%)
French: 79 (0.5%)
Ghanaian: 64 (0.4%)
Arab: 57 (0.4%)
Israeli: 51 (0.3%)
French Canadian: 44 (0.3%)
Pennsylvania German: 43 (0.3%)
Austrian: 35 (0.2%)
Armenian: 31 (0.2%)
Slavic: 31 (0.2%)
Greek: 24 (0.2%)
Ethiopian: 22 (0.1%)
Canadian: 21 (0.1%)
Bahamian: 21 (0.1%)
Jamaican: 19 (0.1%)
British: 18 (0.1%)
Scotch-Irish: 17 (0.1%)
Lithuanian: 17 (0.1%)
Lebanese: 17 (0.1%)
Swiss: 15 (0.10%)
Czechoslovakian: 12 (0.08%)
Dutch: 9 (0.06%)
Hungarian: 7 (0.05%)
Danish: 6 (0.04%)
African: 6 (0.04%)
Northern European: 3 (0.02%)
Guyanese: 3 (0.02%)
Latvian: 3 (0.02%)
Croatian: 2 (0.01%)
Romanian: 2 (0.01%)
Most common places of birth for foreign-born residents (%): China, excluding Hong Kong and Taiwan State College:
29.9% (1,696)Pennsylvania:
7.2% (67,704)
India State College:
9.0% (512)Pennsylvania:
10.7% (100,596)
Korea State College:
7.2% (407)Pennsylvania:
2.9% (27,433)
Iran State College:
6.9% (392)Pennsylvania:
0.4% (4,204)
Russia State College:
3.8% (215)Pennsylvania:
1.6% (15,272)
Turkey State College:
3.1% (178)Pennsylvania:
0.5% (4,441)
France State College:
2.2% (123)Pennsylvania:
0.5% (4,424)
Sweden State College:
2.1% (120)Pennsylvania:
0.1% (1,115)
Jamaica State College:
1.8% (104)Pennsylvania:
2.4% (22,612)
United Kingdom, excluding England and Scotland State College:
1.8% (103)Pennsylvania:
1.1% (10,331)
Germany State College:
1.8% (101)Pennsylvania:
1.9% (18,065)
Poland State College:
1.7% (99)Pennsylvania:
1.3% (12,172)
Saudi Arabia State College:
1.7% (99)Pennsylvania:
0.3% (2,533)
Nigeria State College:
1.6% (89)Pennsylvania:
1.1% (10,709)
Canada State College:
1.5% (86)Pennsylvania:
1.8% (17,032)
Place of birth for U.S.-born residents:
This state: 20,823Other state: 14,166Northeast: 7,162Midwest: 2,242South: 3,192West: 1,718 49.0% of State College residents lived in the same house 1 years ago.
Out of people who lived in different houses, 23.2% lived in this county.
Out of people who lived in different counties, 55.7% lived in Pennsylvania.
State College:
49.0%State average:
89.3%
Education attainment for males 25 years and older:
No schooling: 7Nursery to 4th grade: 05th and 6th grade: 07th and 8th grade: 649th grade: 1710th grade: 1511th grade: 2012th grade, no diploma: 0High school graduate (or equivalency): 963Less than 1 year of college: 77Some college more than 1 year, no degree: 378Associate degree: 223Bachelor's degree: 1,667Master's degree: 1,538Professional school degree: 164Doctorate degree: 1,169
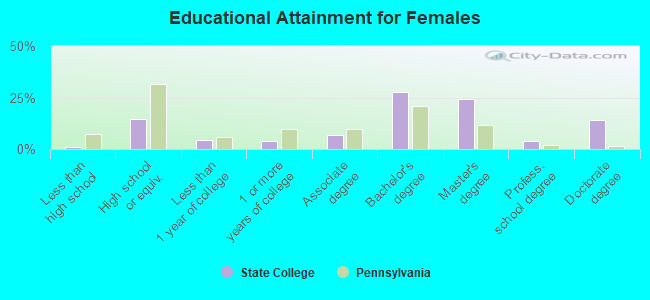
Education attainment for females 25 years and older:
No schooling: 1Nursery to 4th grade: 05th and 6th grade: 07th and 8th grade: 109th grade: 010th grade: 011th grade: 1612th grade, no diploma: 15High school graduate (or equivalency): 816Less than 1 year of college: 243Some college more than 1 year, no degree: 226Associate degree: 369Bachelor's degree: 1,567Master's degree: 1,361Professional school degree: 206Doctorate degree: 790
Housing units in structures:
One, detached: 3,386One, attached: 1,155Two: 4563 or 4: 5985 to 9: 1,44610 to 19: 1,34220 to 49: 1,98450 or more: 2,769Mobile homes: 71Housing units lacking complete kitchen facilities in 2022: 0.5%House/condo owner moved in on average 12 years ago
Renter moved in on average -1 years ago
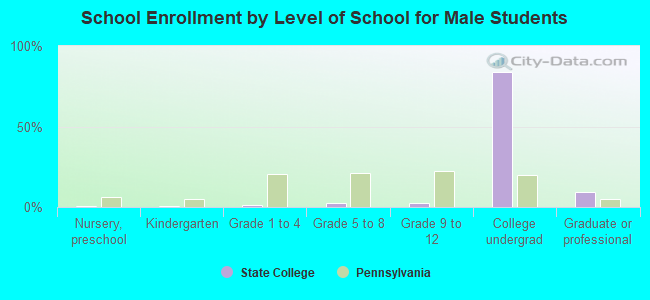
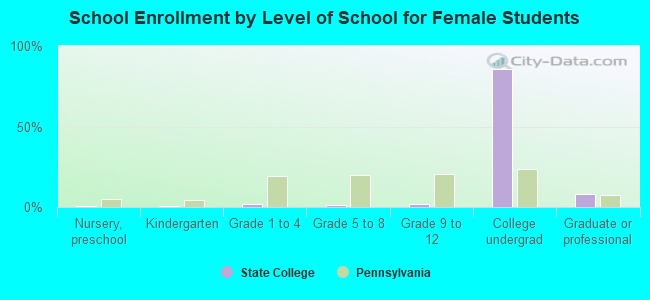
Private vs. public school enrollment:
Students in private schools in grades 1 to 8 (elementary and middle school): 47 Here:
4.7%Pennsylvania:
15.7%
Students in private schools in grades 9 to 12 (high school): 7 Here:
1.1%Pennsylvania:
13.4%
Students in private undergraduate colleges: 695 Here:
2.8%Pennsylvania:
39.8%