Steeleville, IL (Illinois) Houses and Residents
| Steeleville: | $160,999 |
| Illinois: | $251,600 |
Mean price in 2022:
Detached houses: $206,174
Here: $206,174 State: $310,164 Mobile homes: $142,063
Here: $142,063 State: $78,855
Total population: 2,006 (All urban)
Houses: 897 (797 occupied: 572 owner occupied, 235 renter occupied)
| % of renters here: | 29% |
| State: | 33% |
Housing density: 688 houses/condos per square mile
Median price asked for vacant for-sale houses and condos in 2022: $1,344,737.
Median contract rent in 2022: $576 (lower quartile is $497, upper quartile is $631)
Median rent asked for vacant for-rent units in 2022: $619
Median gross rent in Steeleville, IL in 2022: $750
Housing units in Steeleville with a mortgage: 225 (11 second mortgage, 0 home equity loan, 11 both second mortgage and home equity loan)
Houses without a mortgage: 0
Median household income for houses/condos with a mortgage: $91,534
Median household income for apartments without a mortgage: $44,356
Median monthly housing costs: $670
Compare current foreclosures near Steeleville, IL:
| Photo | Address | Area | Beds / Baths | Price | Details |
|---|---|---|---|---|---|

|
#1
S Ridge Ave
Steeleville, IL 62288
|
- sq. feet
|
- baths - beds |
show details | |

|
#2
E Broadway
Steeleville, IL 62288
|
- sq. feet
|
- baths - beds |
show details | |

|
#3
W Broadway
Steeleville, IL 62288
|
- sq. feet
|
- baths - beds |
show details | |

|
#4
N Truman St
Steeleville, IL 62288
|
- sq. feet
|
- baths - beds |
show details | |

|
#5
Snapdragon Rd
Coulterville, IL 62237
|
- sq. feet
|
3 baths 3 beds |
show details | |

|
#6
S Hamilton St
Marissa, IL 62257
|
1,390 sq. feet
|
2 baths 3 beds |
show details | |

|
#7
S Borders Ave
Marissa, IL 62257
|
1 sq. feet
|
1 baths 2 beds |
show details | |

|
#8
W 2nd St
Sparta, IL 62286
|
- sq. feet
|
- baths - beds |
show details | |

|
#9
Hyland Rd Apt J
Chester, IL 62233
|
- sq. feet
|
- baths - beds |
show details | |

|
#10
S Hamilton St
Marissa, IL 62257
|
- sq. feet
|
- baths - beds |
show details |
| Photo | Address | Area | Beds / Baths | Price | Details |
|---|---|---|---|---|---|

|
#11
State Route 13 Apt 3
Coulterville, IL 62237
|
- sq. feet
|
- baths - beds |
show details | |

|
#12
S 7th St Apt 4
Coulterville, IL 62237
|
- sq. feet
|
- baths - beds |
show details | |

|
#13
State St Apt 3
Chester, IL 62233
|
- sq. feet
|
- baths - beds |
show details | |

|
#14
W 3rd St
Sparta, IL 62286
|
- sq. feet
|
- baths - beds |
show details | |

|
#15
S Gum St
Campbell Hill, IL 62916
|
- sq. feet
|
- baths - beds |
show details | |

|
#16
Modglin Rd
Ava, IL 62907
|
- sq. feet
|
- baths - beds |
show details | |

|
#17
Koeneman Acres Apt B
Chester, IL 62233
|
- sq. feet
|
- baths - beds |
show details | |

|
#18
E College St
Sparta, IL 62286
|
- sq. feet
|
- baths - beds |
show details | |

|
#19
Highway 4
Ava, IL 62907
|
- sq. feet
|
- baths - beds |
show details | |

|
#20
E Harding St
Marissa, IL 62257
|
- sq. feet
|
- baths - beds |
show details |
| Photo | Address | Area | Beds / Baths | Price | Details |
|---|---|---|---|---|---|

|
#21
N Saint Louis St
Sparta, IL 62286
|
- sq. feet
|
- baths - beds |
show details | |

|
#22
Columbia St
Evansville, IL 62242
|
- sq. feet
|
- baths - beds |
show details | |

|
#23
Booster St
Evansville, IL 62242
|
- sq. feet
|
- baths - beds |
show details | |

|
#24
E Chester St
Pinckneyville, IL 62274
|
- sq. feet
|
- baths - beds |
show details | |

|
#25
W Saint Louis Ave
Pinckneyville, IL 62274
|
- sq. feet
|
- baths - beds |
show details | |

|
#26
Penina St
Pinckneyville, IL 62274
|
- sq. feet
|
- baths - beds |
show details | |

|
#27
Ritter St
Pinckneyville, IL 62274
|
- sq. feet
|
- baths - beds |
show details | |

|
#28
Wisconsin St
Pinckneyville, IL 62274
|
- sq. feet
|
- baths - beds |
show details | |

|
#29
Goldenrod Rd
Coulterville, IL 62237
|
- sq. feet
|
- baths - beds |
show details | |

|
#30
Schuline Rd
Sparta, IL 62286
|
- sq. feet
|
- baths - beds |
show details |
| Photo | Address | Area | Beds / Baths | Price | Details |
|---|---|---|---|---|---|

|
#31
N Mcbride Rd
Ava, IL 62907
|
- sq. feet
|
- baths - beds |
show details | |

|
#32
W Madison St
Sparta, IL 62286
|
- sq. feet
|
- baths - beds |
show details | |

|
#33
Ridge Rd
Sparta, IL 62286
|
- sq. feet
|
- baths - beds |
show details | |

|
#34
W Hetherington St
Cutler, IL 62238
|
- sq. feet
|
- baths - beds |
show details | |

|
#35
W Mill St
Ava, IL 62907
|
- sq. feet
|
- baths - beds |
show details | |

|
#36
Athens Ave
Sparta, IL 62286
|
- sq. feet
|
- baths - beds |
show details | |

|
#37
Ben St
Chester, IL 62233
|
- sq. feet
|
- baths - beds |
show details | |

|
#38
Servant St
Chester, IL 62233
|
- sq. feet
|
- baths - beds |
show details | |

|
#39
Opdyke St
Chester, IL 62233
|
- sq. feet
|
- baths - beds |
show details | |

|
#40
Plum Creek Rd
Sparta, IL 62286
|
- sq. feet
|
- baths - beds |
show details |
| Photo | Address | Area | Beds / Baths | Price | Details |
|---|---|---|---|---|---|

|
#41
Union School Rd
Ava, IL 62907
|
- sq. feet
|
- baths - beds |
show details | |

|
#42
W Holmes St
Chester, IL 62233
|
- sq. feet
|
- baths - beds |
show details | |

|
#43
Oak St
Chester, IL 62233
|
- sq. feet
|
- baths - beds |
show details | |

|
#44
W German St
Chester, IL 62233
|
- sq. feet
|
- baths - beds |
show details | |

|
#45
Oak St
Chester, IL 62233
|
- sq. feet
|
- baths - beds |
show details | |

|
#46
Evergreen Rd
Sparta, IL 62286
|
- sq. feet
|
- baths - beds |
show details | |

|
Check over 1 million property listings on Foreclosure.com!
|
browse all offers | |||

Latest news about housing in Steeleville, IL collected exclusively by city-data.com from local newspapers, TV, and radio stations


Median year apartment built: 1976
Household type by relationship:
Households: 1,732- Male householders: 307 (72 living alone), Female householders: 475 (202 living alone)
348 spouses (348 opposite-sex spouses), 36 unmarried partners, (36 opposite-sex unmarried partners), 459 children (394 natural, 39 adopted, 25 stepchildren), 22 grandchildren, 14 brothers or sisters, 8 parents, 0 foster children, 40 other relatives, 18 non-relatives
Size of family households: 272 2-persons, 103 3-persons, 85 4-persons, 36 5-persons, 4 7-or-more-persons.
Size of nonfamily households: 289 1-person, 8 2-persons, 8 3-persons.
187 married couples with children.
121 single-parent households (23 men, 98 women).
97.1% of residents of Steeleville speak English at home.
2.7% of residents speak Spanish at home (50% speak English very well, 50% speak English well).
0.3% of residents speak other Indo-European language at home (100% speak English very well).
0.1% of residents speak Asian or Pacific Island language at home (100% speak English very well).
Foreign born population: 45 (2.6%)
(0.0% of them are naturalized citizens)
| Here: | 6.1 |
| State: | 6.4 |
| Here: | 4.5 |
| State: | 4.1 |

- Bedrooms in owner-occupied houses and condos in Steeleville, Illinois
- 0no bedroom
- 51 bedroom
- 1912 bedrooms
- 2643 bedrooms
- 954 bedrooms
- 185+ bedrooms

- Bedrooms in renter-occupied apartments in Steeleville, Illinois
- 0no bedroom
- 221 bedroom
- 1222 bedrooms
- 693 bedrooms
- 174 bedrooms
- 45+ bedrooms

- Cars and other vehicles available in Steeleville in owner-occupied houses/condos
- 13no vehicle
- 1431 vehicle
- 2472 vehicles
- 1263 vehicles
- 384 vehicles
- 55+ vehicles

- Cars and other vehicles available in Steeleville in renter-occupied apartments
- 21no vehicle
- 1011 vehicle
- 812 vehicles
- 183 vehicles
- 134 vehicles
- 05+ vehicles

- Rooms in owner-occupied houses in Steeleville, Illinois
- 01 room
- 02 rooms
- 203 rooms
- 414 rooms
- 1365 rooms
- 1486 rooms
- 1187 rooms
- 398 rooms
- 719+ rooms

- Rooms in renter-occupied apartments in Steeleville, Illinois
- 01 room
- 02 rooms
- 353 rooms
- 764 rooms
- 755 rooms
- 136 rooms
- 177 rooms
- 98 rooms
- 99+ rooms


Steeleville, IL household income distribution

- 45Less than $10,000
- 93$10,000 to $19,999
- 95$20,000 to $29,999
- 112$30,000 to $39,999
- 55$40,000 to $49,999
- 35$50,000 to $59,999
- 94$60,000 to $74,999
- 77$75,000 to $99,999
- 86$100,000 to $124,999
- 47$125,000 to $149,999
- 47$150,000 to $199,999
- 24$200,000 or more
Home value of owner - occupied houses in 2022 in Steeleville, IL
-
- 6Less than $10,000
- 4$10,000 to $14,999
- 6$30,000 to $34,999
- 2$35,000 to $39,999
- 9$40,000 to $49,999
- 9$50,000 to $59,999
- 10$60,000 to $69,999
- 40$70,000 to $79,999
- 45$80,000 to $89,999
- 35$90,000 to $99,999
- 31$100,000 to $124,999
- 58$125,000 to $149,999
- 56$150,000 to $174,999
- 88$175,000 to $199,999
- 44$200,000 to $249,999
- 24$250,000 to $299,999
- 27$300,000 to $399,999
- 44$750,000 to $999,999
Rent paid by renters in 2022 in Steeleville, IL
-
- 5$100 to $149
- 5$150 to $199
- 6$400 to $449
- 28$450 to $499
- 30$500 to $549
- 29$550 to $599
- 65$600 to $649
- 12$650 to $699
- 4$700 to $749
- 11$750 to $799
- 3$900 to $999
- 29No cash rent


Percentage of workers working in this county: 78.7%
Number of people working at home: 17 (2.2% of all workers)
Travel time to work (commute)
- Less than 5 minutes: 102
- 5 to 9 minutes: 90
- 10 to 14 minutes: 97
- 15 to 19 minutes: 124
- 20 to 24 minutes: 109
- 25 to 29 minutes: 37
- 30 to 34 minutes: 36
- 35 to 39 minutes: 32
- 40 to 44 minutes: 28
- 45 to 59 minutes: 41
- 60 to 89 minutes: 35
- 90 or more minutes: 5
Means of transportation to work:
- Drove a car alone: 830 (71.9%)
- Carpooled: 234 (20.3%)
- Bus: 23 (2.0%)
- Walked: 26 (2.3%)
- Worked at home: 17 (1.5%)

- Unemployment by race in 2022
- Unemployment rate for White non-Hispanic residents
- 8.0%Males
- 2.1%Females

- Year of entry for the foreign-born population in Steeleville, Illinois
- 02010 or later
- 412000 to 2009
- 01990 to 1999
- 81980 to 1989
- 01970 to 1979
- 5Before 1970

First ancestries reported:
- German: 570 (69.9%)
- American: 96 (11.8%)
- Irish: 38 (4.7%)
- English: 30 (3.7%)
- Italian: 7 (0.9%)
- Scotch-Irish: 4 (0.5%)
- Scottish: 4 (0.5%)
Most common places of birth for foreign-born residents (%):
| Steeleville: | 97.8% (44) |
| Illinois: | 34.7% (626,958) |
Place of birth for U.S.-born residents:
- This state: 1,494
- Other state: 179
- Northeast: 3
- Midwest: 122
- South: 12
- West: 43
80.3% of Steeleville residents lived in the same house 1 years ago.
Out of people who lived in different houses, 42.3% lived in this county.
Out of people who lived in different counties, 24.4% lived in Illinois.
| Steeleville: | 80.3% |
| State average: | 88.3% |
Education attainment for males 25 years and older:
- No schooling: 46
- Nursery to 4th grade: 0
- 5th and 6th grade: 0
- 7th and 8th grade: 11
- 9th grade: 4
- 10th grade: 13
- 11th grade: 17
- 12th grade, no diploma: 0
- High school graduate (or equivalency): 182
- Less than 1 year of college: 91
- Some college more than 1 year, no degree: 46
- Associate degree: 52
- Bachelor's degree: 42
- Master's degree: 17
- Professional school degree: 5
- Doctorate degree: 10

Education attainment for females 25 years and older:
- No schooling: 4
- Nursery to 4th grade: 0
- 5th and 6th grade: 0
- 7th and 8th grade: 7
- 9th grade: 3
- 10th grade: 23
- 11th grade: 4
- 12th grade, no diploma: 0
- High school graduate (or equivalency): 207
- Less than 1 year of college: 157
- Some college more than 1 year, no degree: 73
- Associate degree: 128
- Bachelor's degree: 49
- Master's degree: 24
- Professional school degree: 1
- Doctorate degree: 0


Housing units in structures:
- One, detached: 683
- One, attached: 6
- Two: 45
- 3 or 4: 37
- 5 to 9: 5
- 10 to 19: 11
- Mobile homes: 109
Median worth of mobile homes: $168,331
Housing units lacking complete kitchen facilities in 2022: 3.6%
House/condo owner moved in on average 22 years ago
Renter moved in on average 2 years ago

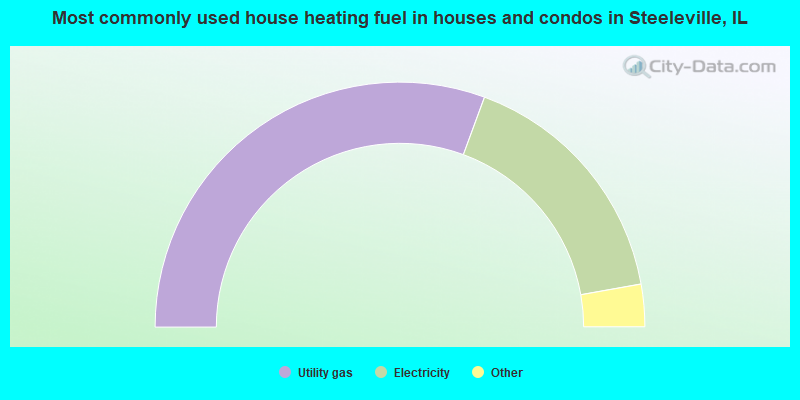
- 61.3%Utility gas
- 33.2%Electricity
- 3.0%Wood
- 1.6%Fuel oil, kerosene, etc.
- 0.9%Bottled, tank, or LP gas
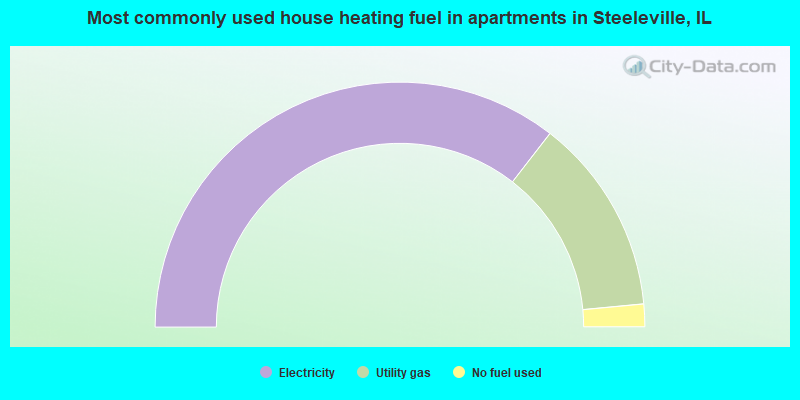
- 71.0%Electricity
- 26.0%Utility gas
- 3.0%No fuel used
Private vs. public school enrollment:
| Here: | 10.8% |
| Illinois: | 13.3% |
| Here: | 3.4% |
| Illinois: | 9.9% |
| Here: | 5.6% |
| Illinois: | 27.4% |


