Strathmore, NJ (New Jersey) Houses and Residents
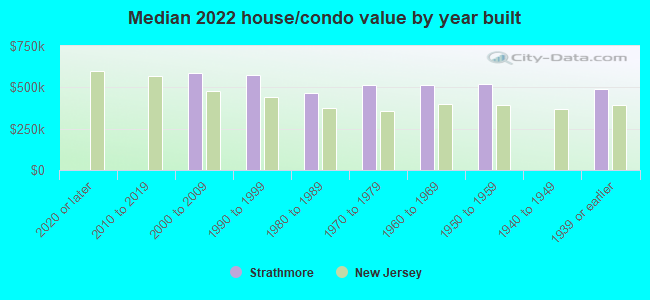
| Strathmore: | $528,594 |
| New Jersey: | $428,900 |
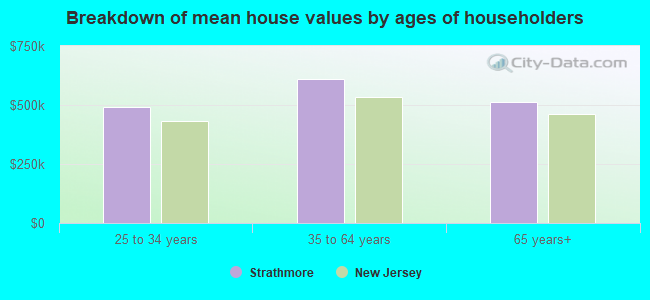
Mean price in 2022:
Detached houses: $492,611
Here: $492,611 State: $537,591 Townhouses or other attached units: $410,603
Here: $410,603 State: $381,113 In 5-or-more-unit structures: $429,397
Here: $429,397 State: $368,745
Total population: 7,258 (Urban population: 6,791, Rural population: 0)
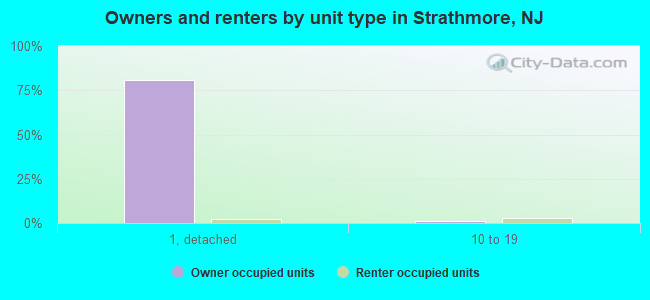
Houses: 2,608 (2,576 occupied: 2,417 owner occupied, 203 renter occupied)
| % of renters here: | 8% |
| State: | 35% |
Housing density: 1,414 houses/condos per square mile
Median price asked for vacant for-sale houses and condos in 2022: $1,572,891.
Median contract rent in 2022: $1,453 (lower quartile is $1,163, upper quartile is $1,863)
Median rent asked for vacant for-rent units in 2022: $2,227
Median gross rent in Strathmore, NJ in 2022: $1,636
Housing units in Strathmore with a mortgage: 1,490 (203 second mortgage, 20 home equity loan, 176 both second mortgage and home equity loan)
Houses without a mortgage: 33
Median household income for houses/condos with a mortgage: $168,211
Median household income for apartments without a mortgage: $155,538
Median monthly housing costs: $2,372
Compare current foreclosures near Strathmore, NJ:
| Photo | Address | Area | Beds / Baths | Price | Details |
|---|---|---|---|---|---|

|
#1
Tennent Rd
Morganville, NJ 07751
|
1,040 sq. feet
|
2 baths 3 beds |
$494,900
|
show details |

|
#2
Warren Street
Keyport, NJ 07735
|
2,889 sq. feet
|
2 baths 7 beds |
$459,900
|
show details |

|
#3
Henry St
Keyport, NJ 07735
|
800 sq. feet
|
1 baths 2 beds |
$219,350
|
show details |

|
#4
Russell St # G
Staten Island, NY 10308
|
642 sq. feet
|
1 baths 1 beds |
$185,000
|
show details |

|
#5
1st Ave
North Brunswick, NJ 08902
|
1,296 sq. feet
|
2 baths 3 beds |
$349,900
|
show details |

|
#6
Florence Ave
Colonia, NJ 07067
|
1,930 sq. feet
|
2 baths 3 beds |
$599,900
|
show details |

|
#7
Hazelhurst St
New Brunswick, NJ 08901
|
465 sq. feet
|
1 baths 1 beds |
$325,000
|
show details |

|
#8
Sharon Garden Ct
Woodbridge, NJ 07095
|
1,000 sq. feet
|
2 baths 2 beds |
$455,000
|
show details |

|
#9
Catherine St
South Amboy, NJ 08879
|
2,266 sq. feet
|
3 baths 4 beds |
$351,900
|
show details |

|
#10
New Ln Apt 6l
Staten Island, NY 10305
|
- sq. feet
|
1 baths 1 beds |
$284,900
|
show details |
| Photo | Address | Area | Beds / Baths | Price | Details |
|---|---|---|---|---|---|

|
#11
Willow Rd W
Staten Island, NY 10314
|
- sq. feet
|
1 baths 3 beds |
$491,400
|
show details |

|
#12
Richmond Rd
Staten Island, NY 10304
|
- sq. feet
|
1 baths 3 beds |
$634,400
|
show details |

|
#13
Station Ave
Staten Island, NY 10309
|
- sq. feet
|
1 baths 3 beds |
$649,900
|
show details |

|
#14
Crawford Street
Red Bank, NJ 07701
|
1,280 sq. feet
|
1 baths 2 beds |
show details | |

|
#15
Bromley Pl
East Brunswick, NJ 08816
|
1,200 sq. feet
|
2 baths 2 beds |
show details | |

|
#16
Spring St Unit 11
Red Bank, NJ 07701
|
1,096 sq. feet
|
1 baths 2 beds |
show details | |

|
#17
Maurice Ave
Holmdel, NJ 07733
|
1,296 sq. feet
|
2 baths 3 beds |
show details | |

|
#18
Starkin Rd
Edison, NJ 08837
|
832 sq. feet
|
1 baths 2 beds |
show details | |

|
#19
Egbert Ave
Staten Island, NY 10310
|
1,936 sq. feet
|
2 baths 2 beds |
show details | |

|
#20
Potter Rd
Freehold, NJ 07728
|
4,062 sq. feet
|
3 baths 5 beds |
show details |
| Photo | Address | Area | Beds / Baths | Price | Details |
|---|---|---|---|---|---|

|
#21
Continental Pl
Staten Island, NY 10303
|
1,000 sq. feet
|
1 baths 2 beds |
show details | |

|
#22
Georges Rd
Dayton, NJ 08810
|
1,035 sq. feet
|
1 baths 3 beds |
show details | |

|
#23
Bennett St
Staten Island, NY 10302
|
1,110 sq. feet
|
3 baths 3 beds |
show details | |

|
#24
Cheyenne St
Asbury Park, NJ 07712
|
1,840 sq. feet
|
2 baths 3 beds |
show details | |

|
#25
Donaldson Pl
Linden, NJ 07036
|
768 sq. feet
|
3 baths 3 beds |
show details | |

|
#26
Waverly Dr W
Edison, NJ 08817
|
1,947 sq. feet
|
2 baths 4 beds |
show details | |

|
#27
Broadway Rd
North Brunswick, NJ 08902
|
2,632 sq. feet
|
4 baths 5 beds |
show details | |

|
#28
Thorn St
Rahway, NJ 07065
|
1,986 sq. feet
|
1 baths 3 beds |
show details | |

|
#29
Clove Rd Apt Go
Staten Island, NY 10301
|
800 sq. feet
|
2 baths 2 beds |
show details | |

|
#30
Prince St
Staten Island, NY 10304
|
1,176 sq. feet
|
1 baths 3 beds |
show details |
| Photo | Address | Area | Beds / Baths | Price | Details |
|---|---|---|---|---|---|

|
#31
Jefferson Ave
Edison, NJ 08837
|
1,392 sq. feet
|
1 baths 3 beds |
show details | |

|
#32
Hammock Ln
Staten Island, NY 10312
|
2,000 sq. feet
|
1 baths 3 beds |
show details | |

|
#33
Newark Ave
Staten Island, NY 10302
|
1,120 sq. feet
|
1 baths 3 beds |
show details | |

|
#34
Van Buren Ave
Linden, NJ 07036
|
1,820 sq. feet
|
3 baths 3 beds |
show details | |

|
#35
Coursen Pl
Staten Island, NY 10304
|
1,402 sq. feet
|
1 baths 3 beds |
show details | |

|
#36
Delaware Ave
Atlantic Highlands, NJ 07716
|
1,326 sq. feet
|
2 baths 3 beds |
show details | |

|
#37
Morningside Ave
Keyport, NJ 07735
|
1,228 sq. feet
|
2 baths 3 beds |
show details | |

|
#38
Seymour Ave
Linden, NJ 07036
|
768 sq. feet
|
1 baths 3 beds |
show details | |

|
#39
Athens Ave
South Amboy, NJ 08879
|
1,790 sq. feet
|
2 baths 3 beds |
show details | |

|
#40
Hagaman St
Port Reading, NJ 07064
|
1,376 sq. feet
|
2 baths 3 beds |
show details |
| Photo | Address | Area | Beds / Baths | Price | Details |
|---|---|---|---|---|---|

|
#41
Irving St
Carteret, NJ 07008
|
1,110 sq. feet
|
1 baths 3 beds |
show details | |

|
#42
1st Ave
Asbury Park, NJ 07712
|
1,318 sq. feet
|
1 baths 2 beds |
show details | |

|
#43
Drummond Ave
Neptune, NJ 07753
|
928 sq. feet
|
1 baths 2 beds |
show details | |

|
#44
Dock St
Keyport, NJ 07735
|
1,362 sq. feet
|
2 baths 3 beds |
show details | |

|
#45
Father Capodanno Blvd
Staten Island, NY 10305
|
1,344 sq. feet
|
2 baths 4 beds |
show details | |

|
#46
Kilmer Dr
Englishtown, NJ 07726
|
1,960 sq. feet
|
2 baths 4 beds |
show details | |

|
#47
Crine Rd
Morganville, NJ 07751
|
3,058 sq. feet
|
3 baths 5 beds |
show details | |

|
#48
9th Ave
Neptune, NJ 07753
|
992 sq. feet
|
1 baths 2 beds |
show details | |

|
#49
Forest Ave
Keansburg, NJ 07734
|
861 sq. feet
|
1 baths 2 beds |
show details | |

|
Check over 1 million property listings on Foreclosure.com!
|
browse all offers | |||

Latest news about housing in Strathmore, NJ collected exclusively by city-data.com from local newspapers, TV, and radio stations

 | Asbestos Information about Levitt Homes in Strathmore (0 replies) |
| Bus from Strathmore in Aberdeen to New York City (3 replies) |
| mobile homes in NJ (7 replies) |
| Tell me about Brick (42 replies) |
| Matawan or Aberdeen? (11 replies) |
| Moving to Middlesex or Monmouth County, need help! (1 reply) |
Median year apartment built: 1986
Household type by relationship:
Households: 6,915- Male householders: 1,416 (195 living alone), Female householders: 1,150 (242 living alone)
1,792 spouses (1,752 opposite-sex spouses), 55 unmarried partners, (55 opposite-sex unmarried partners), 2,155 children (2,085 natural, 37 adopted, 33 stepchildren), 76 grandchildren, 26 brothers or sisters, 80 parents, 35 foster children, 35 other relatives, 58 non-relatives
- In group quarters: 34
Size of family households: 899 2-persons, 545 3-persons, 533 4-persons, 119 5-persons, 31 6-persons.
Size of nonfamily households: 436 1-person, 39 2-persons, 35 3-persons.
1,123 married couples with children.
237 single-parent households (36 men, 201 women).
82.0% of residents of Strathmore speak English at home.
2.4% of residents speak Spanish at home (56% speak English very well, 41% speak English well, 3% speak English not well).
13.9% of residents speak other Indo-European language at home (83% speak English very well, 16% speak English well, 1% speak English not well).
0.9% of residents speak Asian or Pacific Island language at home (66% speak English very well, 34% speak English well).
1.9% of residents speak other language at home (95% speak English very well, 5% speak English well).
Foreign born population: 1,018 (14.7%)
(75.8% of them are naturalized citizens)
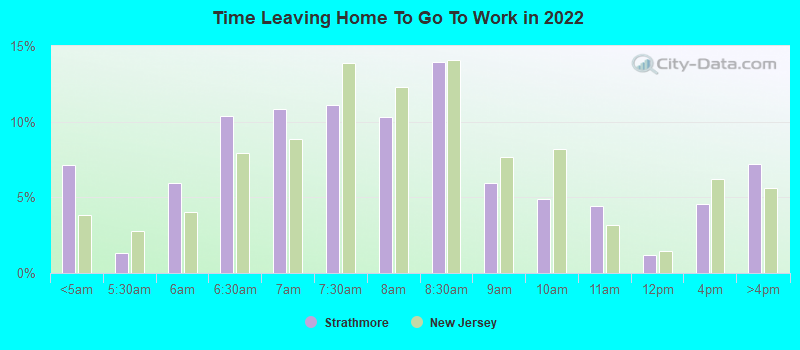
| Here: | 7.2 |
| State: | 6.8 |
| Here: | 3.7 |
| State: | 3.9 |
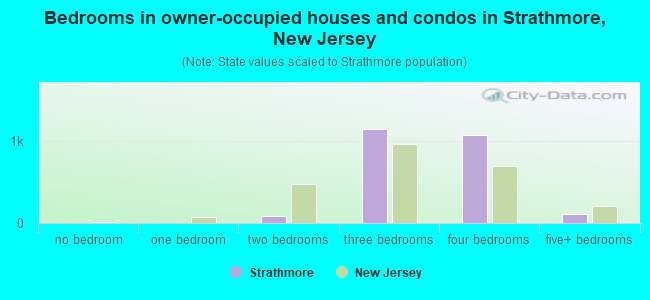
- Bedrooms in owner-occupied houses and condos in Strathmore, New Jersey
- 0no bedroom
- 61 bedroom
- 852 bedrooms
- 1,1433 bedrooms
- 1,0764 bedrooms
- 1075+ bedrooms
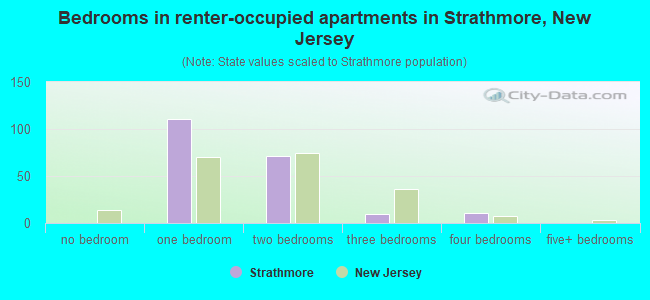
- Bedrooms in renter-occupied apartments in Strathmore, New Jersey
- 0no bedroom
- 1111 bedroom
- 712 bedrooms
- 103 bedrooms
- 114 bedrooms
- 05+ bedrooms
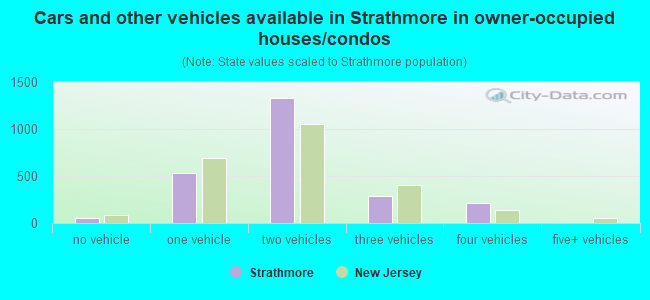
- Cars and other vehicles available in Strathmore in owner-occupied houses/condos
- 52no vehicle
- 5301 vehicle
- 1,3342 vehicles
- 2863 vehicles
- 2134 vehicles
- 35+ vehicles
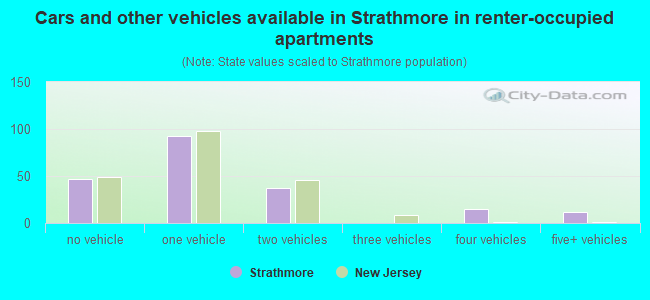
- Cars and other vehicles available in Strathmore in renter-occupied apartments
- 47no vehicle
- 931 vehicle
- 372 vehicles
- 03 vehicles
- 154 vehicles
- 115+ vehicles
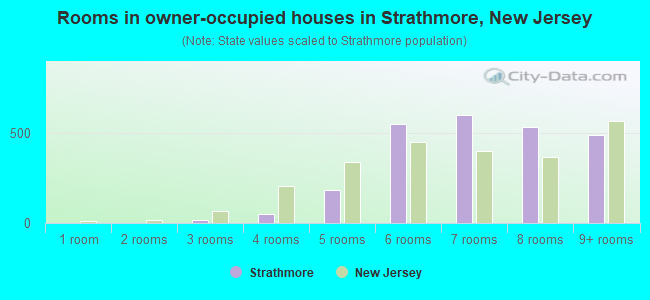
- Rooms in owner-occupied houses in Strathmore, New Jersey
- 01 room
- 02 rooms
- 183 rooms
- 494 rooms
- 1845 rooms
- 5466 rooms
- 5987 rooms
- 5328 rooms
- 4909+ rooms
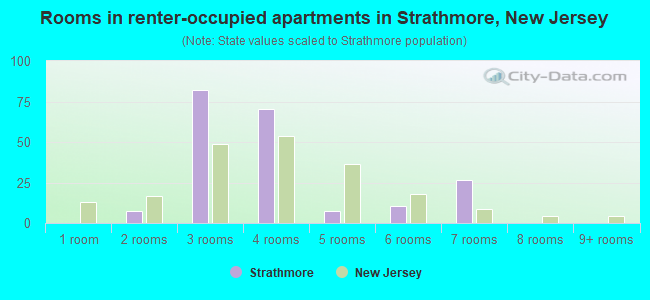
- Rooms in renter-occupied apartments in Strathmore, New Jersey
- 01 room
- 72 rooms
- 823 rooms
- 714 rooms
- 75 rooms
- 106 rooms
- 277 rooms
- 08 rooms
- 09+ rooms
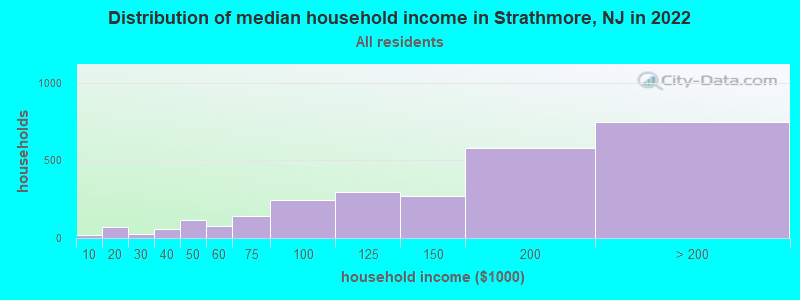
Strathmore, NJ household income distribution

- 17Less than $10,000
- 69$10,000 to $19,999
- 23$20,000 to $29,999
- 56$30,000 to $39,999
- 118$40,000 to $49,999
- 75$50,000 to $59,999
- 143$60,000 to $74,999
- 242$75,000 to $99,999
- 295$100,000 to $124,999
- 270$125,000 to $149,999
- 578$150,000 to $199,999
- 748$200,000 or more
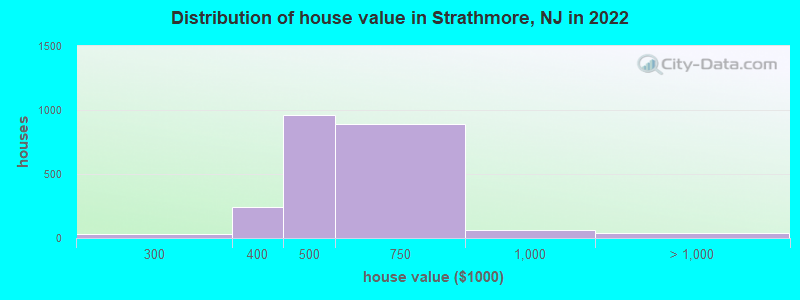
Home value of owner - occupied houses in 2022 in Strathmore, NJ
-
- 32$250,000 to $299,999
- 240$300,000 to $399,999
- 960$400,000 to $499,999
- 888$500,000 to $749,999
- 58$750,000 to $999,999
- 41$2,000,000 or more
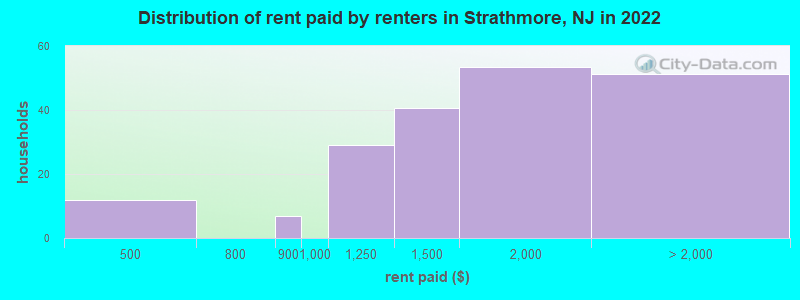
Rent paid by renters in 2022 in Strathmore, NJ
-
- 11$450 to $499
- 6$800 to $899
- 29$1,000 to $1,249
- 40$1,250 to $1,499
- 53$1,500 to $1,999
- 20$2,000 to $2,499
- 7$3,000 to $3,499
- 23No cash rent
Percentage of workers working in this county: 57.1%
Number of people working at home: 846 (21.6% of all workers)
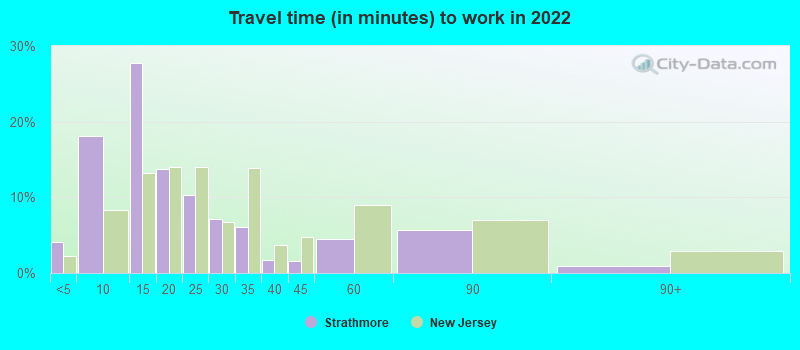
Travel time to work (commute)
- Less than 5 minutes: 67
- 5 to 9 minutes: 272
- 10 to 14 minutes: 337
- 15 to 19 minutes: 260
- 20 to 24 minutes: 279
- 25 to 29 minutes: 248
- 30 to 34 minutes: 224
- 35 to 39 minutes: 92
- 40 to 44 minutes: 135
- 45 to 59 minutes: 301
- 60 to 89 minutes: 420
- 90 or more minutes: 402
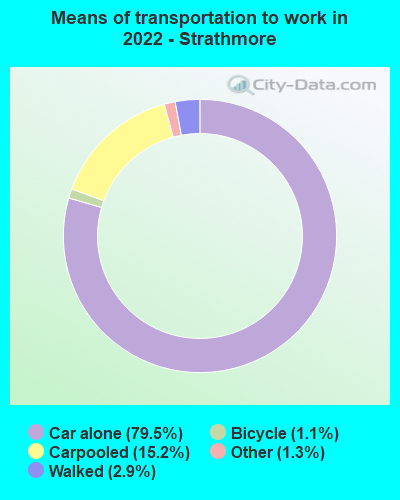
Means of transportation to work:
- Drove a car alone: 1,810 (57.1%)
- Carpooled: 412 (13.0%)
- Taxi: 45 (1.4%)
- Bicycle: 18 (0.6%)
- Walked: 98 (3.1%)
- Worked at home: 846 (26.7%)
- Unemployment by race in 2022
- Unemployment rate for White non-Hispanic residents
- 4.5%Males
- 1.6%Females
- Unemployment rate for Black residents
- 22.8%Males
- Unemployment rate for Asian residents
- 5.7%Males
- Unemployment rate for other race residents
- 24.7%Males
- Unemployment rate for Hispanic or Latino residents
- 17.2%Males
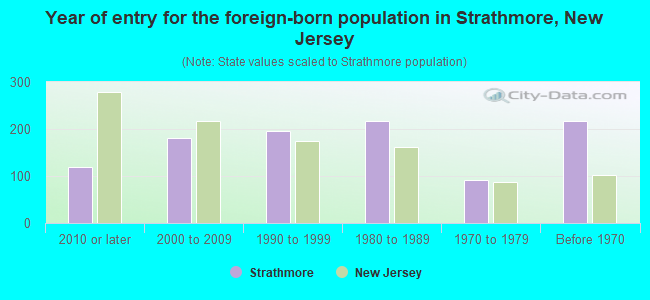
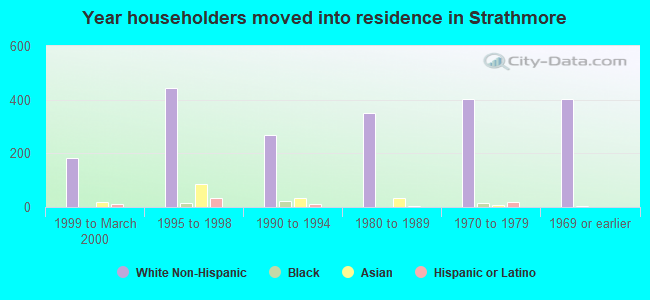
- Year of entry for the foreign-born population in Strathmore, New Jersey
- 1192010 or later
- 1802000 to 2009
- 1961990 to 1999
- 2161980 to 1989
- 921970 to 1979
- 216Before 1970
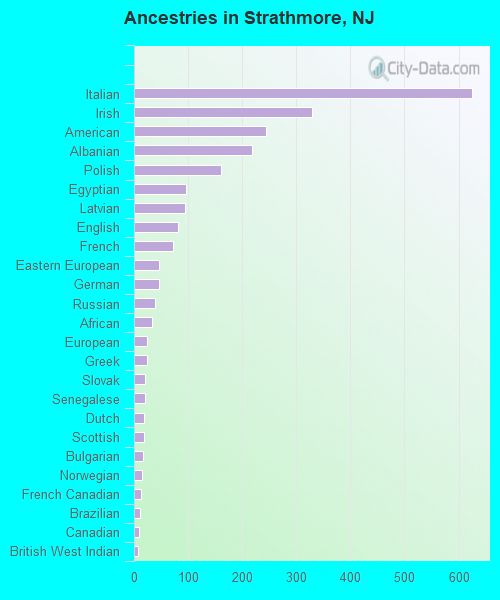
First ancestries reported:
- Italian: 625 (20.1%)
- Irish: 329 (10.6%)
- American: 244 (7.8%)
- Albanian: 218 (7.0%)
- Polish: 160 (5.1%)
- Egyptian: 97 (3.1%)
- Latvian: 95 (3.0%)
- English: 81 (2.6%)
- French: 73 (2.3%)
- Eastern European: 47 (1.5%)
- German: 46 (1.5%)
- Russian: 39 (1.3%)
- African: 33 (1.1%)
- European: 24 (0.8%)
- Greek: 24 (0.8%)
- Slovak: 20 (0.6%)
- Senegalese: 20 (0.6%)
- Dutch: 18 (0.6%)
- Scottish: 18 (0.6%)
- Bulgarian: 17 (0.5%)
- Norwegian: 14 (0.4%)
- French Canadian: 13 (0.4%)
- Brazilian: 11 (0.4%)
- Canadian: 10 (0.3%)
- British West Indian: 7 (0.2%)
- British: 6 (0.2%)
- Ukrainian: 4 (0.1%)
Most common places of birth for foreign-born residents (%):
| Strathmore: | 16.7% (170) |
| New Jersey: | 0.1% (1,789) |
| Strathmore: | 11.1% (113) |
| New Jersey: | 12.8% (274,609) |
| Strathmore: | 8.7% (88) |
| New Jersey: | 0.4% (7,791) |
| Strathmore: | 8.7% (88) |
| New Jersey: | 1.6% (33,678) |
| Strathmore: | 5.1% (52) |
| New Jersey: | 0.1% (2,890) |
| Strathmore: | 4.9% (50) |
| New Jersey: | 1.2% (26,173) |
| Strathmore: | 4.8% (49) |
| New Jersey: | 0.2% (4,290) |
| Strathmore: | 4.4% (45) |
| New Jersey: | 1.5% (33,198) |
| Strathmore: | 4.2% (43) |
| New Jersey: | 1.3% (27,580) |
| Strathmore: | 3.8% (39) |
| New Jersey: | 4.0% (85,934) |
| Strathmore: | 3.5% (36) |
| New Jersey: | 0.1% (2,316) |
| Strathmore: | 3.1% (31) |
| New Jersey: | 0.8% (17,217) |
| Strathmore: | 2.9% (29) |
| New Jersey: | 4.2% (90,817) |
| Strathmore: | 2.3% (23) |
| New Jersey: | 3.7% (78,969) |
| Strathmore: | 2.2% (22) |
| New Jersey: | 0.6% (12,793) |
| Strathmore: | 2.0% (20) |
| New Jersey: | 9.7% (209,055) |
Place of birth for U.S.-born residents:
- This state: 3,498
- Other state: 2,346
- Northeast: 2,111
- Midwest: 76
- South: 68
- West: 67
95.2% of Strathmore residents lived in the same house 1 years ago.
Out of people who lived in different houses, 21.6% lived in this county.
Out of people who lived in different counties, 77.7% lived in New Jersey.
| Strathmore: | 95.2% |
| State average: | 90.4% |
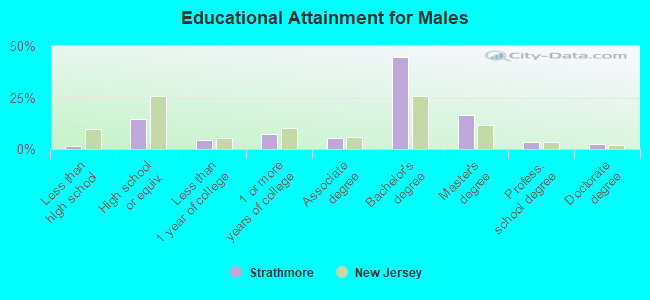
Education attainment for males 25 years and older:
- No schooling: 23
- Nursery to 4th grade: 0
- 5th and 6th grade: 0
- 7th and 8th grade: 0
- 9th grade: 0
- 10th grade: 0
- 11th grade: 6
- 12th grade, no diploma: 9
- High school graduate (or equivalency): 354
- Less than 1 year of college: 102
- Some college more than 1 year, no degree: 178
- Associate degree: 126
- Bachelor's degree: 1,097
- Master's degree: 406
- Professional school degree: 85
- Doctorate degree: 64
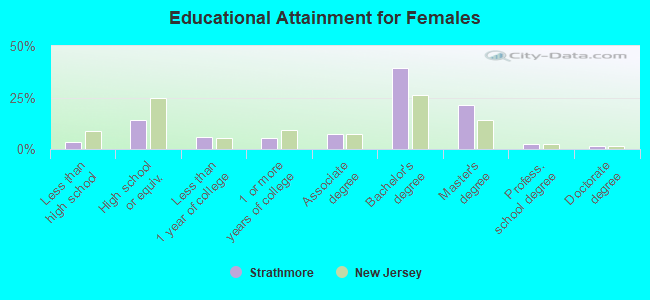
Education attainment for females 25 years and older:
- No schooling: 11
- Nursery to 4th grade: 0
- 5th and 6th grade: 0
- 7th and 8th grade: 0
- 9th grade: 0
- 10th grade: 12
- 11th grade: 25
- 12th grade, no diploma: 37
- High school graduate (or equivalency): 371
- Less than 1 year of college: 154
- Some college more than 1 year, no degree: 134
- Associate degree: 192
- Bachelor's degree: 1,028
- Master's degree: 555
- Professional school degree: 61
- Doctorate degree: 43
Housing units in structures:
- One, detached: 2,332
- One, attached: 118
- Two: 17
- 3 or 4: 27
- 5 to 9: 20
- 10 to 19: 10
- 20 to 49: 35
- 50 or more: 48
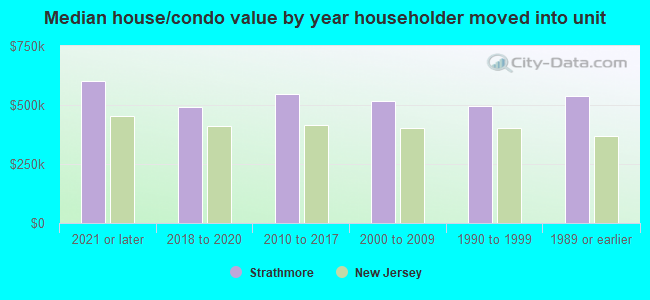
House/condo owner moved in on average 16 years ago
Renter moved in on average 1 years ago
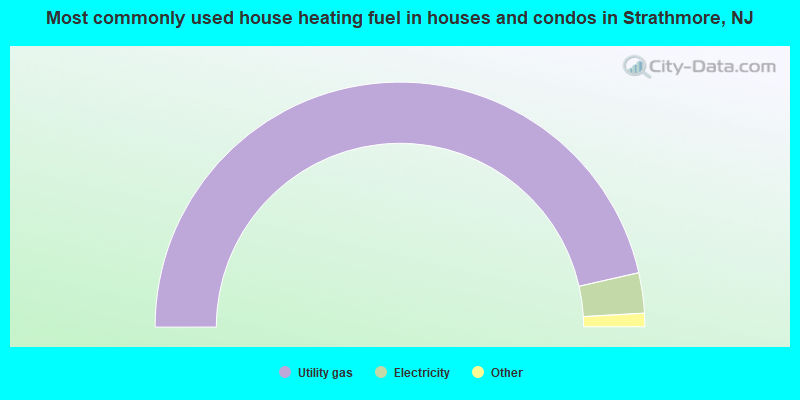
- 93.0%Utility gas
- 5.3%Electricity
- 1.1%Bottled, tank, or LP gas
- 0.5%Fuel oil, kerosene, etc.
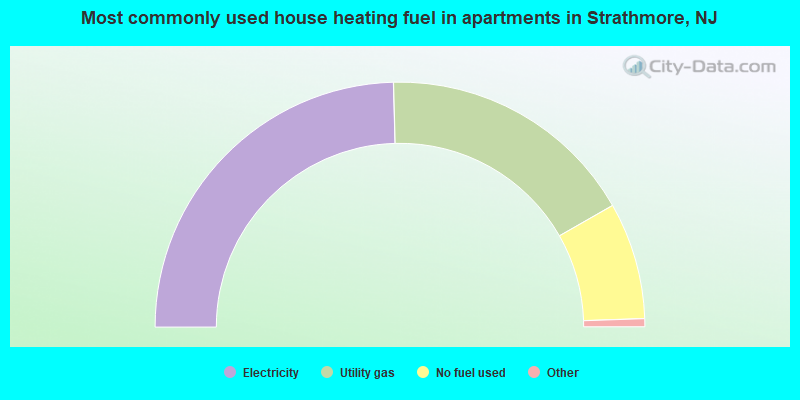
- 49.7%Electricity
- 34.7%Utility gas
- 15.6%No fuel used
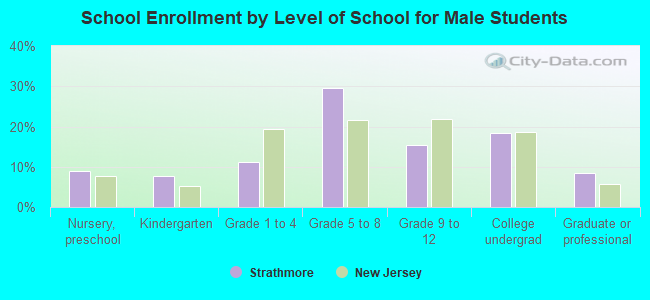
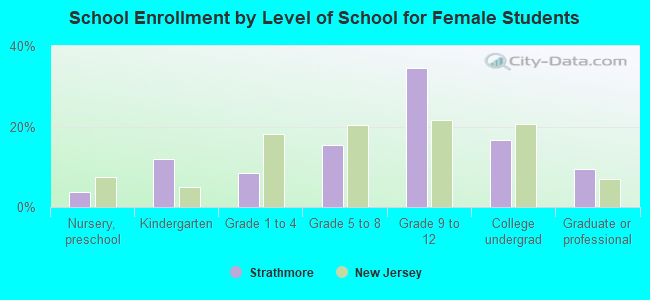
Private vs. public school enrollment:
| Here: | 16.2% |
| New Jersey: | 12.3% |
| Here: | 18.3% |
| New Jersey: | 13.1% |
| Here: | 6.1% |
| New Jersey: | 33.2% |