Strongsville, OH (Ohio) Houses and Residents
| Strongsville: | $286,395 |
| Ohio: | $204,100 |
Total population: 44,654 (Urban population: 43,468, Rural population: 393 (all nonfarm))
Houses: 19,449 (18,761 occupied: 15,580 owner occupied, 3,291 renter occupied)
| % of renters here: | 17% |
| State: | 33% |
Housing density: 789 houses/condos per square mile
Median price asked for vacant for-sale houses and condos in 2022: $177,303.
Median contract rent in 2022: $1,022 (lower quartile is $852, upper quartile is $1,365)
Median rent asked for vacant for-rent units in 2022: $1,435
Median gross rent in Strongsville, OH in 2022: $1,221
Housing units in Strongsville with a mortgage: 9,569 (1,412 second mortgage, 85 home equity loan, 1,205 both second mortgage and home equity loan)
Houses without a mortgage: 714
Median household income for houses/condos with a mortgage: $129,731
Median household income for apartments without a mortgage: $89,291
Median monthly housing costs: $1,296
Compare current foreclosures in Strongsville, OH:
| Photo | Address | Area | Beds / Baths | Price | Details |
|---|---|---|---|---|---|

|
#1
Bridge Path
Strongsville, OH 44136
|
2,342 sq. feet
|
2 baths 2 beds |
show details | |

|
#2
Lenox Dr
Strongsville, OH 44136
|
1,145 sq. feet
|
2 baths 2 beds |
show details | |

|
#3
Ordner Dr
Strongsville, OH 44136
|
1,220 sq. feet
|
2 baths 2 beds |
show details | |

|
#4
Walnut Creek Dr
Strongsville, OH 44149
|
2,406 sq. feet
|
2 baths 4 beds |
show details | |

|
#5
Meadow Trl
Strongsville, OH 44149
|
2,176 sq. feet
|
2 baths 2 beds |
show details | |

|
#6
Evergreen Dr
Strongsville, OH 44149
|
2,029 sq. feet
|
2 baths 4 beds |
show details | |

|
#7
Overland Park Dr
Strongsville, OH 44149
|
2,116 sq. feet
|
2 baths 4 beds |
show details | |

|
#8
Janette Ave
Strongsville, OH 44136
|
1,040 sq. feet
|
1 baths 3 beds |
show details | |

|
#9
Turkey Meadow Ln
Strongsville, OH 44136
|
1,728 sq. feet
|
1 baths 3 beds |
show details | |

|
#10
Albion Rd
Strongsville, OH 44149
|
1,928 sq. feet
|
2 baths 3 beds |
show details |
| Photo | Address | Area | Beds / Baths | Price | Details |
|---|---|---|---|---|---|

|
#11
Hunting Meadows Dr
Strongsville, OH 44136
|
2,792 sq. feet
|
2 baths 4 beds |
show details | |

|
#12
Sun Meadow Trl
Strongsville, OH 44149
|
1,626 sq. feet
|
1 baths 2 beds |
show details | |

|
#13
Admiralty Dr
Strongsville, OH 44136
|
1,924 sq. feet
|
2 baths 4 beds |
show details | |

|
#14
Lenox Dr
Strongsville, OH 44136
|
1,397 sq. feet
|
2 baths 3 beds |
show details | |

|
#15
Hunt Rd
Strongsville, OH 44136
|
1,098 sq. feet
|
1 baths 3 beds |
show details | |

|
#16
Lenox Dr
Strongsville, OH 44136
|
1,205 sq. feet
|
2 baths 2 beds |
show details | |

|
#17
Stoughton Dr
Strongsville, OH 44149
|
2,302 sq. feet
|
2 baths 4 beds |
show details | |

|
#18
Park View Cir
Strongsville, OH 44136
|
2,254 sq. feet
|
2 baths 4 beds |
show details | |

|
#19
Albion Rd
Strongsville, OH 44149
|
3,811 sq. feet
|
3 baths 4 beds |
show details | |

|
#20
Cartwright Pkwy
Strongsville, OH 44136
|
2,010 sq. feet
|
2 baths 3 beds |
show details |
| Photo | Address | Area | Beds / Baths | Price | Details |
|---|---|---|---|---|---|

|
#21
Oak Branch Trl
Strongsville, OH 44149
|
2,116 sq. feet
|
2 baths 3 beds |
show details | |

|
#22
Trenton Ave
Strongsville, OH 44136
|
2,507 sq. feet
|
2 baths 4 beds |
show details | |

|
#23
N White Oaks Dr
Strongsville, OH 44136
|
2,900 sq. feet
|
2 baths 5 beds |
show details | |

|
#24
Kelsey Ln
Strongsville, OH 44149
|
5,228 sq. feet
|
4 baths 5 beds |
show details | |

|
#25
Willow Wood Dr
Strongsville, OH 44136
|
3,026 sq. feet
|
2 baths 4 beds |
show details | |

|
#26
Squirrel Hollow Ln
Strongsville, OH 44136
|
- sq. feet
|
- baths - beds |
show details | |

|
#27
Whitney Rd
Strongsville, OH 44136
|
- sq. feet
|
- baths - beds |
show details | |

|
#28
Englewood Drive
Strongsville, OH 44136
|
- sq. feet
|
- baths - beds |
show details | |

|
#29
Deerfield Dr
Strongsville, OH 44136
|
- sq. feet
|
- baths - beds |
show details | |

|
#30
Whitney Rd Apt 305
Strongsville, OH 44136
|
- sq. feet
|
- baths - beds |
show details |
| Photo | Address | Area | Beds / Baths | Price | Details |
|---|---|---|---|---|---|

|
#31
Whitney Rd Apt 110
Strongsville, OH 44136
|
- sq. feet
|
- baths - beds |
show details | |

|
#32
Whitney Rd Apt 109
Strongsville, OH 44136
|
- sq. feet
|
- baths - beds |
show details | |

|
#33
Westwood Dr # 204
Strongsville, OH 44136
|
- sq. feet
|
- baths - beds |
show details | |

|
#34
Settlers Run
Strongsville, OH 44136
|
- sq. feet
|
- baths - beds |
show details | |

|
Check over 1 million property listings on Foreclosure.com!
|
browse all offers | |||

Latest news about housing in Strongsville, OH collected exclusively by city-data.com from local newspapers, TV, and radio stations

 | Need guidance to find apartments where Indians (Bhartiya) do live (6 replies) |
| Should Abandoned Houses Be Torn Down? (75 replies) |
| relocating back to Cleveland, best area for family to RENT a house (7 replies) |
| Apartments in Cleveland suburbs (2 replies) |
| Renting vs Buying (13 replies) |
| Official Cleveland relocation thread (517 replies) |

Median year apartment built: 1979
Household type by relationship:
Households: 45,408- Male householders: 9,592 (2,072 living alone), Female householders: 8,885 (3,003 living alone)
10,864 spouses (10,795 opposite-sex spouses), 1,006 unmarried partners, (1,001 opposite-sex unmarried partners), 12,498 children (11,772 natural, 322 adopted, 403 stepchildren), 610 grandchildren, 126 brothers or sisters, 693 parents, 0 foster children, 181 other relatives, 527 non-relatives
- In group quarters: 421
Size of family households: 6,480 2-persons, 2,410 3-persons, 2,934 4-persons, 724 5-persons, 358 6-persons, 85 7-or-more-persons.
Size of nonfamily households: 5,112 1-person, 763 2-persons, 60 3-persons, 19 4-persons.
7,334 married couples with children.
1,082 single-parent households (419 men, 663 women).
87.6% of residents of Strongsville speak English at home.
1.7% of residents speak Spanish at home (58% speak English very well, 20% speak English well, 18% speak English not well, 5% don't speak English at all).
8.0% of residents speak other Indo-European language at home (72% speak English very well, 26% speak English well, 2% speak English not well).
1.7% of residents speak Asian or Pacific Island language at home (53% speak English very well, 45% speak English well, 2% speak English not well).
2.0% of residents speak other language at home (70% speak English very well, 21% speak English well, 5% speak English not well, 4% don't speak English at all).
Foreign born population: 4,839 (10.7%)
(76.1% of them are naturalized citizens)
| Here: | 7.7 |
| State: | 6.7 |
| Here: | 3.9 |
| State: | 4.4 |

- Bedrooms in owner-occupied houses and condos in Strongsville, Ohio
- 31no bedroom
- 311 bedroom
- 1,4602 bedrooms
- 6,2533 bedrooms
- 6,9364 bedrooms
- 8705+ bedrooms

- Bedrooms in renter-occupied apartments in Strongsville, Ohio
- 189no bedroom
- 9471 bedroom
- 1,7662 bedrooms
- 2293 bedrooms
- 1354 bedrooms
- 255+ bedrooms

- Cars and other vehicles available in Strongsville in owner-occupied houses/condos
- 432no vehicle
- 3,6471 vehicle
- 7,3892 vehicles
- 2,9063 vehicles
- 1,0084 vehicles
- 1995+ vehicles

- Cars and other vehicles available in Strongsville in renter-occupied apartments
- 647no vehicle
- 1,7261 vehicle
- 8232 vehicles
- 653 vehicles
- 104 vehicles
- 205+ vehicles

- Rooms in owner-occupied houses in Strongsville, Ohio
- 201 room
- 342 rooms
- 313 rooms
- 4884 rooms
- 1,3035 rooms
- 2,4346 rooms
- 2,7517 rooms
- 3,0458 rooms
- 5,4749+ rooms

- Rooms in renter-occupied apartments in Strongsville, Ohio
- 1891 room
- 2092 rooms
- 6863 rooms
- 1,1794 rooms
- 5605 rooms
- 1886 rooms
- 1387 rooms
- 268 rooms
- 1179+ rooms


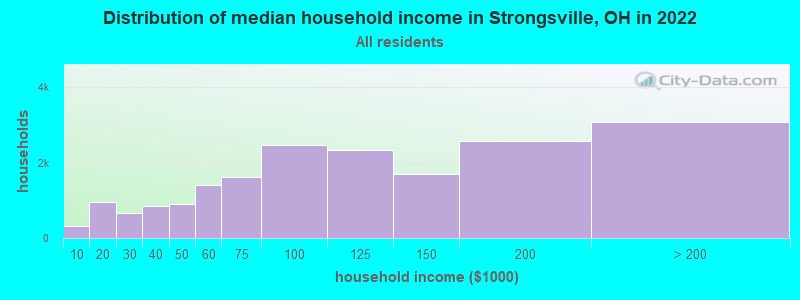
Strongsville, OH household income distribution

- 321Less than $10,000
- 952$10,000 to $19,999
- 676$20,000 to $29,999
- 860$30,000 to $39,999
- 906$40,000 to $49,999
- 1,401$50,000 to $59,999
- 1,609$60,000 to $74,999
- 2,460$75,000 to $99,999
- 2,322$100,000 to $124,999
- 1,694$125,000 to $149,999
- 2,579$150,000 to $199,999
- 3,077$200,000 or more
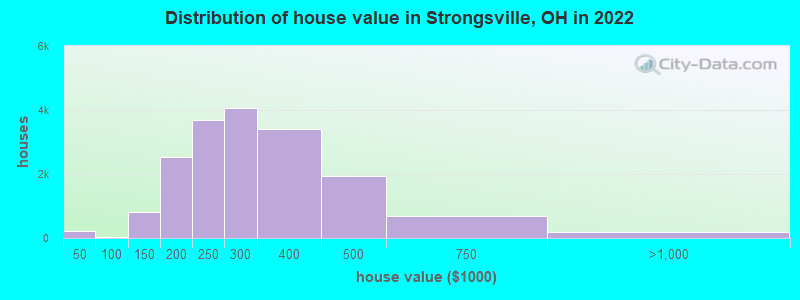
Home value of owner - occupied houses in 2022 in Strongsville, OH
-
- 82Less than $10,000
- 38$10,000 to $14,999
- 42$15,000 to $19,999
- 17$20,000 to $24,999
- 27$25,000 to $29,999
- 7$30,000 to $34,999
- 8$35,000 to $39,999
- 4$50,000 to $59,999
- 7$70,000 to $79,999
- 19$80,000 to $89,999
- 6$90,000 to $99,999
- 296$100,000 to $124,999
- 501$125,000 to $149,999
- 1,133$150,000 to $174,999
- 1,408$175,000 to $199,999
- 3,686$200,000 to $249,999
- 4,074$250,000 to $299,999
- 3,396$300,000 to $399,999
- 1,944$400,000 to $499,999
- 682$500,000 to $749,999
- 119$750,000 to $999,999
- 31$1,000,000 to $1,499,999
- 8$1,500,000 to $1,999,999
- 24$2,000,000 or more
Rent paid by renters in 2022 in Strongsville, OH
-
- 14$100 to $149
- 12$350 to $399
- 8$400 to $449
- 22$550 to $599
- 80$600 to $649
- 162$650 to $699
- 174$700 to $749
- 137$750 to $799
- 510$800 to $899
- 297$900 to $999
- 837$1,000 to $1,249
- 465$1,250 to $1,499
- 326$1,500 to $1,999
- 53$2,000 to $2,499
- 88$3,500 or more
- 114No cash rent


Percentage of workers working in this county: 85.8%
Number of people working at home: 4,786 (20.6% of all workers)
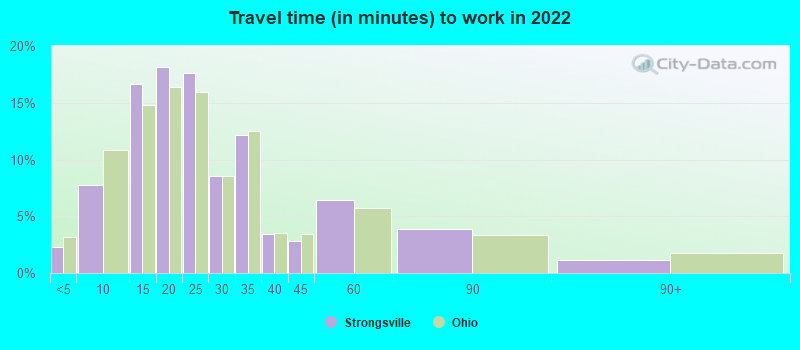
Travel time to work (commute)
- Less than 5 minutes: 433
- 5 to 9 minutes: 1,531
- 10 to 14 minutes: 2,729
- 15 to 19 minutes: 2,296
- 20 to 24 minutes: 2,337
- 25 to 29 minutes: 1,734
- 30 to 34 minutes: 2,771
- 35 to 39 minutes: 830
- 40 to 44 minutes: 944
- 45 to 59 minutes: 1,930
- 60 to 89 minutes: 579
- 90 or more minutes: 235
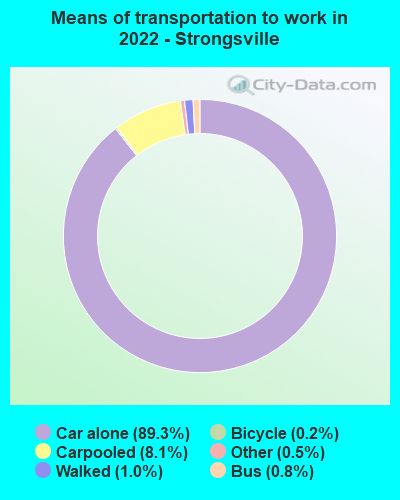
Means of transportation to work:
- Drove a car alone: 17,912 (73.3%)
- Carpooled: 1,635 (6.7%)
- Bus: 147 (0.6%)
- Taxi: 103 (0.4%)
- Bicycle: 71 (0.3%)
- Walked: 235 (1.0%)
- Worked at home: 4,786 (19.6%)

- Unemployment by race in 2022
- Unemployment rate for White non-Hispanic residents
- 1.9%Males
- 1.0%Females
- Unemployment rate for Black residents
- 12.0%Males
- 18.1%Females
- Unemployment rate for other race residents
- 1.1%Females
- Unemployment rate for two or more race residents
- 1.6%Males
- 4.5%Females
- Unemployment rate for Hispanic or Latino residents
- 0.3%Females

- Year of entry for the foreign-born population in Strongsville, Ohio
- 1,1772010 or later
- 8642000 to 2009
- 1,3461990 to 1999
- 5131980 to 1989
- 4891970 to 1979
- 954Before 1970

First ancestries reported:
- German: 2,985 (15.5%)
- Italian: 2,089 (10.9%)
- Polish: 1,394 (7.2%)
- Irish: 1,241 (6.4%)
- American: 1,202 (6.2%)
- English: 796 (4.1%)
- European: 414 (2.2%)
- Slovak: 414 (2.2%)
- Ukrainian: 360 (1.9%)
- Hungarian: 318 (1.7%)
- Czech: 263 (1.4%)
- Romanian: 242 (1.3%)
- Dutch: 211 (1.1%)
- Scottish: 199 (1.0%)
- Lebanese: 190 (1.0%)
- Russian: 173 (0.9%)
- Palestinian: 166 (0.9%)
- Iranian: 140 (0.7%)
- Greek: 139 (0.7%)
- Eastern European: 138 (0.7%)
- Slovene: 107 (0.6%)
- Scotch-Irish: 106 (0.6%)
- Pennsylvania German: 100 (0.5%)
- Serbian: 98 (0.5%)
- Swedish: 91 (0.5%)
- Welsh: 86 (0.4%)
- Albanian: 79 (0.4%)
- Egyptian: 71 (0.4%)
- Czechoslovakian: 58 (0.3%)
- Jamaican: 56 (0.3%)
- African: 52 (0.3%)
- Yugoslavian: 50 (0.3%)
- Austrian: 42 (0.2%)
- Canadian: 34 (0.2%)
- Bulgarian: 34 (0.2%)
- Ugandan: 31 (0.2%)
- Trinidadian and Tobagonian: 30 (0.2%)
- Syrian: 28 (0.1%)
- Swiss: 27 (0.1%)
- Norwegian: 26 (0.1%)
- Finnish: 26 (0.1%)
- Armenian: 25 (0.1%)
- French Canadian: 25 (0.1%)
- Lithuanian: 23 (0.1%)
- French: 22 (0.1%)
- Macedonian: 20 (0.1%)
- Croatian: 18 (0.09%)
- Slavic: 18 (0.09%)
- Scandinavian: 14 (0.07%)
- Northern European: 14 (0.07%)
- Portuguese: 12 (0.06%)
- Jordanian: 10 (0.05%)
- Brazilian: 8 (0.04%)
- Turkish: 6 (0.03%)
- British: 5 (0.03%)
Most common places of birth for foreign-born residents (%):
| Strongsville: | 19.6% (983) |
| Ohio: | 11.6% (66,525) |
| Strongsville: | 6.8% (343) |
| Ohio: | 3.1% (17,818) |
| Strongsville: | 6.6% (329) |
| Ohio: | 2.2% (12,846) |
| Strongsville: | 6.0% (302) |
| Ohio: | 0.4% (2,091) |
| Strongsville: | 5.3% (266) |
| Ohio: | 1.1% (6,346) |
| Strongsville: | 3.0% (152) |
| Ohio: | 1.5% (8,452) |
| Strongsville: | 2.9% (145) |
| Ohio: | 1.7% (9,564) |
| Strongsville: | 2.4% (118) |
| Ohio: | 0.8% (4,651) |
| Strongsville: | 2.4% (118) |
| Ohio: | 0.6% (3,552) |
| Strongsville: | 2.2% (111) |
| Ohio: | 0.7% (3,862) |
| Strongsville: | 2.2% (110) |
| Ohio: | 2.6% (14,988) |
| Strongsville: | 2.1% (105) |
| Ohio: | 0.4% (2,031) |
| Strongsville: | 1.9% (97) |
| Ohio: | 0.7% (4,187) |
| Strongsville: | 1.9% (95) |
| Ohio: | 6.2% (35,703) |
| Strongsville: | 1.8% (92) |
| Ohio: | 0.5% (2,962) |
| Strongsville: | 1.6% (81) |
| Ohio: | 0.6% (3,210) |
| Strongsville: | 1.6% (79) |
| Ohio: | 0.7% (4,155) |
| Strongsville: | 1.6% (79) |
| Ohio: | 0.5% (2,690) |
| Strongsville: | 1.6% (79) |
| Ohio: | 1.2% (6,679) |
| Strongsville: | 1.5% (76) |
| Ohio: | 0.5% (2,631) |
Place of birth for U.S.-born residents:
- This state: 32,522
- Other state: 7,575
- Northeast: 2,905
- Midwest: 1,818
- South: 2,279
- West: 623
90.3% of Strongsville residents lived in the same house 1 years ago.
Out of people who lived in different houses, 38.1% lived in this county.
Out of people who lived in different counties, 54.2% lived in Ohio.
| Strongsville: | 90.3% |
| State average: | 87.8% |
Education attainment for males 25 years and older:
- No schooling: 177
- Nursery to 4th grade: 1
- 5th and 6th grade: 23
- 7th and 8th grade: 60
- 9th grade: 34
- 10th grade: 39
- 11th grade: 48
- 12th grade, no diploma: 114
- High school graduate (or equivalency): 3,226
- Less than 1 year of college: 853
- Some college more than 1 year, no degree: 1,725
- Associate degree: 1,444
- Bachelor's degree: 5,684
- Master's degree: 2,289
- Professional school degree: 402
- Doctorate degree: 313

Education attainment for females 25 years and older:
- No schooling: 139
- Nursery to 4th grade: 40
- 5th and 6th grade: 17
- 7th and 8th grade: 183
- 9th grade: 137
- 10th grade: 136
- 11th grade: 54
- 12th grade, no diploma: 125
- High school graduate (or equivalency): 3,847
- Less than 1 year of college: 1,061
- Some college more than 1 year, no degree: 1,772
- Associate degree: 1,564
- Bachelor's degree: 5,204
- Master's degree: 2,938
- Professional school degree: 392
- Doctorate degree: 239


Housing units in structures:
- One, detached: 15,415
- One, attached: 1,168
- Two: 104
- 3 or 4: 79
- 5 to 9: 142
- 10 to 19: 760
- 20 to 49: 256
- 50 or more: 1,501
- Boats, RVs, vans, etc.: 19
Housing units lacking complete kitchen facilities in 2022: 2.1%
House/condo owner moved in on average 12 years ago
Renter moved in on average 2 years ago

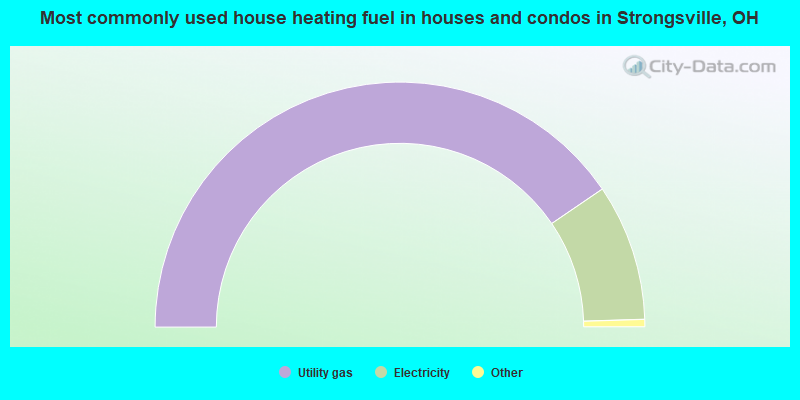
- 80.9%Utility gas
- 18.0%Electricity
- 0.8%Bottled, tank, or LP gas
- 0.2%Fuel oil, kerosene, etc.
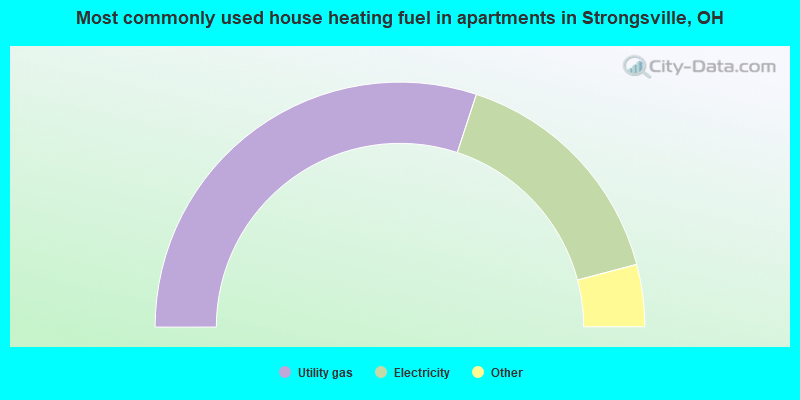
- 60.1%Utility gas
- 31.7%Electricity
- 4.0%No fuel used
- 3.2%Bottled, tank, or LP gas
- 1.0%Other fuel
Private vs. public school enrollment:
| Here: | 18.0% |
| Ohio: | 16.0% |
| Here: | 16.0% |
| Ohio: | 13.1% |
| Here: | 28.3% |
| Ohio: | 22.3% |


