Sturbridge, MA (Massachusetts) Houses and Residents
| Sturbridge: | $404,968 |
| Massachusetts: | $534,700 |
Total population: 2,253 (Urban population: 1,152, Rural population: 870 (all nonfarm))
Houses: 1,131 (920 occupied: 747 owner occupied, 184 renter occupied)
| % of renters here: | 20% |
| State: | 38% |
Housing density: 211 houses/condos per square mile
Median price asked for vacant for-sale houses and condos in 2022 in this county: $182,682.
Median contract rent in 2022: $1,602 (lower quartile is $1,179, upper quartile is $1,877)
Median rent asked for vacant for-rent units in 2022: $1,178
Median gross rent in Sturbridge, MA in 2022: $1,702
Housing units in Sturbridge with a mortgage: 542 (134 second mortgage, 0 home equity loan, 125 both second mortgage and home equity loan)
Houses without a mortgage: 14
Median household income for houses/condos with a mortgage: $141,818
Median household income for apartments without a mortgage: $131,787
Median monthly housing costs: $2,087
Compare current foreclosures near Sturbridge, MA:
| Photo | Address | Area | Beds / Baths | Price | Details |
|---|---|---|---|---|---|

|
#1
Old Village Rd
Sturbridge, MA 01566
|
1,353 sq. feet
|
2 baths 4 beds |
show details | |

|
#2
Cricket Dr
Sturbridge, MA 01566
|
816 sq. feet
|
1 baths 2 beds |
show details | |

|
#3
Mashapaug Rd
Sturbridge, MA 01566
|
1,512 sq. feet
|
2 baths 4 beds |
show details | |

|
#4
Woodlawn Dr
Sturbridge, MA 01566
|
1,655 sq. feet
|
2 baths 3 beds |
show details | |

|
#5
Simpson St
Sturbridge, MA 01566
|
1,560 sq. feet
|
2 baths 3 beds |
show details | |

|
#6
New Boston Rd
Sturbridge, MA 01566
|
1,667 sq. feet
|
2 baths 4 beds |
show details | |

|
#7
New Boston Rd
Sturbridge, MA 01566
|
2,608 sq. feet
|
2 baths 4 beds |
show details | |

|
#8
Old Village Rd
Sturbridge, MA 01566
|
3,364 sq. feet
|
4 baths 5 beds |
show details | |

|
#9
Podunk Rd
Sturbridge, MA 01566
|
- sq. feet
|
- baths - beds |
show details | |

|
#10
Benefit St
Sturbridge, MA 01566
|
- sq. feet
|
- baths - beds |
show details |
| Photo | Address | Area | Beds / Baths | Price | Details |
|---|---|---|---|---|---|

|
#11
Clarence Dr
Oxford, MA 01540
|
3,010 sq. feet
|
3 baths 5 beds |
$569,900
|
show details |

|
#12
N Brookfield Rd
Oakham, MA 01068
|
1,078 sq. feet
|
1 baths 2 beds |
$439,900
|
show details |

|
#13
W Main St
Ware, MA 01082
|
3,645 sq. feet
|
3 baths 5 beds |
show details | |

|
#14
Old West Brookfield Road
Warren, MA 01083
|
1,760 sq. feet
|
2 baths 4 beds |
show details | |

|
#15
Nelson Street
Warren, MA 01083
|
- sq. feet
|
2 baths 3 beds |
show details | |

|
#16
Treadwell Ter
Spencer, MA 01562
|
960 sq. feet
|
1 baths 3 beds |
show details | |

|
#17
Pine St
Dudley, MA 01571
|
1,414 sq. feet
|
2 baths 4 beds |
show details | |

|
#18
Redfield Rd
Cherry Valley, MA 01611
|
1,412 sq. feet
|
1 baths 3 beds |
show details | |

|
#19
1/2 Putnam Hill Road
Sutton, MA 01590
|
1,415 sq. feet
|
1 baths 3 beds |
show details | |

|
#20
Paine District Rd
Woodstock, CT 06281
|
1,092 sq. feet
|
1 baths 2 beds |
show details |
| Photo | Address | Area | Beds / Baths | Price | Details |
|---|---|---|---|---|---|

|
#21
Stafford Rd
Monson, MA 01057
|
1,464 sq. feet
|
1 baths 3 beds |
show details | |

|
#22
Wales Rd
Brimfield, MA 01010
|
2,312 sq. feet
|
2 baths 3 beds |
show details | |

|
#23
Brookfield Rd
Brimfield, MA 01010
|
1,482 sq. feet
|
3 baths 3 beds |
show details | |

|
#24
Hovey Rd
Monson, MA 01057
|
2,256 sq. feet
|
1 baths 4 beds |
show details | |

|
#25
Leicester St
Auburn, MA 01501
|
912 sq. feet
|
1 baths 2 beds |
show details | |

|
#26
Roberts Park Rd
Holland, MA 01521
|
660 sq. feet
|
1 baths 3 beds |
show details | |

|
#27
Southbridge Rd Unit 104
Charlton, MA 01507
|
1,266 sq. feet
|
2 baths 2 beds |
show details | |

|
#28
Route 169 # 169
Woodstock, CT 06281
|
1,440 sq. feet
|
1 baths 4 beds |
show details | |

|
#29
Marc Ave
Southbridge, MA 01550
|
960 sq. feet
|
1 baths 3 beds |
show details | |

|
#30
Beckman St
Worcester, MA 01607
|
1,685 sq. feet
|
2 baths 4 beds |
show details |
| Photo | Address | Area | Beds / Baths | Price | Details |
|---|---|---|---|---|---|

|
#31
Mill Rd
North Brookfield, MA 01535
|
1,026 sq. feet
|
1 baths 4 beds |
show details | |

|
#32
Norma St
Palmer, MA 01069
|
1,144 sq. feet
|
1 baths 3 beds |
show details | |

|
#33
Central Tpke
Sutton, MA 01590
|
1,450 sq. feet
|
2 baths 3 beds |
show details | |

|
#34
Marion Ave
Auburn, MA 01501
|
1,544 sq. feet
|
1 baths 4 beds |
show details | |

|
#35
Winchester Ave
Auburn, MA 01501
|
1,926 sq. feet
|
2 baths 3 beds |
show details | |

|
#36
Flynt St
Palmer, MA 01069
|
1,200 sq. feet
|
1 baths 3 beds |
show details | |

|
#37
Vesper St
Worcester, MA 01602
|
2,128 sq. feet
|
2 baths 6 beds |
show details | |

|
#38
Beaconsfield Rd
Worcester, MA 01602
|
1,668 sq. feet
|
1 baths 3 beds |
show details | |

|
#39
Auburn St
Cherry Valley, MA 01611
|
900 sq. feet
|
1 baths 3 beds |
show details | |

|
#40
Tucker Rd
West Brookfield, MA 01585
|
2,240 sq. feet
|
2 baths 3 beds |
show details |
| Photo | Address | Area | Beds / Baths | Price | Details |
|---|---|---|---|---|---|

|
#41
Upper Rd
Stafford Springs, CT 06076
|
2,242 sq. feet
|
3 baths 3 beds |
show details | |

|
#42
Bel Air Dr
Ware, MA 01082
|
2,412 sq. feet
|
2 baths 3 beds |
show details | |

|
#43
Mechanic St
Monson, MA 01057
|
3,136 sq. feet
|
2 baths 4 beds |
show details | |

|
#44
Breckenridge St
Palmer, MA 01069
|
808 sq. feet
|
1 baths 2 beds |
show details | |

|
#45
Fox St
Palmer, MA 01069
|
1,924 sq. feet
|
2 baths 3 beds |
show details | |

|
#46
Chapel St
Leicester, MA 01524
|
1,152 sq. feet
|
1 baths 3 beds |
show details | |

|
#47
Northwest Rd
Spencer, MA 01562
|
1,476 sq. feet
|
1 baths 3 beds |
show details | |

|
#48
Upper Palmer Rd
Monson, MA 01057
|
1,456 sq. feet
|
1 baths 3 beds |
show details | |

|
#49
Wicker St
Putnam, CT 06260
|
1,144 sq. feet
|
1 baths 3 beds |
show details | |

|
Check over 1 million property listings on Foreclosure.com!
|
browse all offers | |||

Latest news about housing in Sturbridge, MA collected exclusively by city-data.com from local newspapers, TV, and radio stations

 | How Much Massachusetts Households Make Per Year: Census Data (37 replies) |
| 2023 Real Estate Observations (5278 replies) |
| jobs and cheap apartments in Leominster or Worcester to move in September 2019 (17 replies) |
| Quincy to open "migrant" shelter in Wollaston (251 replies) |
| Is Massachusetts Real Estate Affordable? (132 replies) |
| Oklahoma to (likely Western) Massachusetts - Beginning Research (274 replies) |

Median year apartment built: 1974
Household type by relationship:
Households: 2,232- Male householders: 469 (40 living alone), Female householders: 445 (137 living alone)
570 spouses (560 opposite-sex spouses), 106 unmarried partners, (106 opposite-sex unmarried partners), 578 children (562 natural, 0 adopted, 16 stepchildren), 0 grandchildren, 9 brothers or sisters, 40 parents, 0 foster children, 0 other relatives, 6 non-relatives
- In group quarters: 7
Size of family households: 331 2-persons, 139 3-persons, 178 4-persons, 28 5-persons.
Size of nonfamily households: 183 1-person, 67 2-persons.
357 married couples with children.
104 single-parent households (31 men, 73 women).
95.8% of residents of Sturbridge speak English at home.
2.5% of residents speak other Indo-European language at home (74% speak English very well, 26% speak English not well).
1.0% of residents speak other language at home (100% speak English very well).
Foreign born population: 68 (3.0%)
(54.4% of them are naturalized citizens)
| Here: | 9.8 |
| State: | 6.5 |
| Here: | 3.9 |
| State: | 4.0 |

- Bedrooms in owner-occupied houses and condos in Sturbridge, Massachusetts
- 0no bedroom
- 141 bedroom
- 682 bedrooms
- 3053 bedrooms
- 3094 bedrooms
- 515+ bedrooms

- Bedrooms in renter-occupied apartments in Sturbridge, Massachusetts
- 0no bedroom
- 731 bedroom
- 1122 bedrooms
- 03 bedrooms
- 04 bedrooms
- 05+ bedrooms

- Cars and other vehicles available in Sturbridge in owner-occupied houses/condos
- 39no vehicle
- 781 vehicle
- 3542 vehicles
- 2763 vehicles
- 04 vehicles
- 05+ vehicles

- Cars and other vehicles available in Sturbridge in renter-occupied apartments
- 13no vehicle
- 741 vehicle
- 882 vehicles
- 93 vehicles
- 04 vehicles
- 05+ vehicles

- Rooms in owner-occupied houses in Sturbridge, Massachusetts
- 01 room
- 02 rooms
- 03 rooms
- 594 rooms
- 145 rooms
- 1396 rooms
- 897 rooms
- 628 rooms
- 3839+ rooms

- Rooms in renter-occupied apartments in Sturbridge, Massachusetts
- 01 room
- 192 rooms
- 453 rooms
- 864 rooms
- 125 rooms
- 216 rooms
- 07 rooms
- 08 rooms
- 09+ rooms


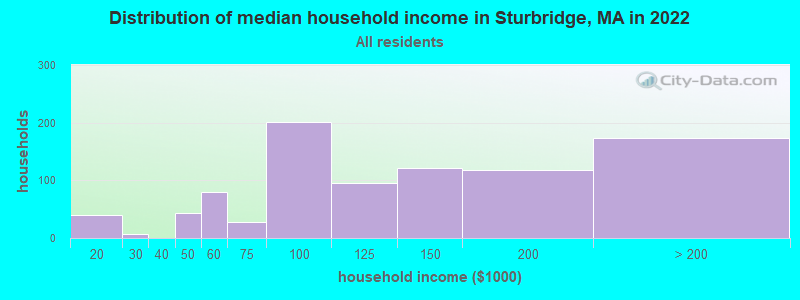
Sturbridge, MA household income distribution

- 40$10,000 to $19,999
- 7$20,000 to $29,999
- 44$40,000 to $49,999
- 80$50,000 to $59,999
- 28$60,000 to $74,999
- 201$75,000 to $99,999
- 96$100,000 to $124,999
- 122$125,000 to $149,999
- 118$150,000 to $199,999
- 174$200,000 or more
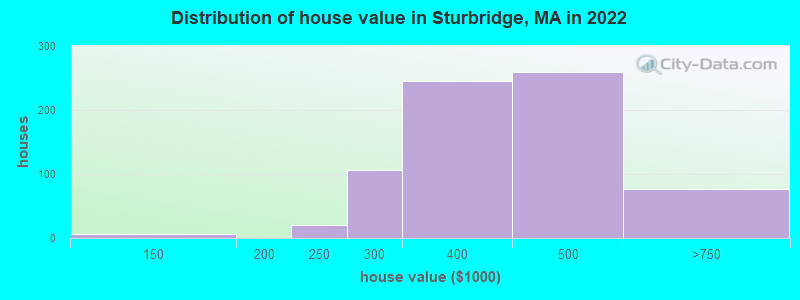
Home value of owner - occupied houses in 2022 in Sturbridge, MA
-
- 7$125,000 to $149,999
- 20$200,000 to $249,999
- 106$250,000 to $299,999
- 246$300,000 to $399,999
- 260$400,000 to $499,999
- 76$500,000 to $749,999
Rent paid by renters in 2022 in Sturbridge, MA
-
- 41$800 to $899
- 13$1,000 to $1,249
- 29$1,250 to $1,499
- 131$1,500 to $1,999


Percentage of workers working in this county: 71.6%
Number of people working at home: 55 (4.6% of all workers)
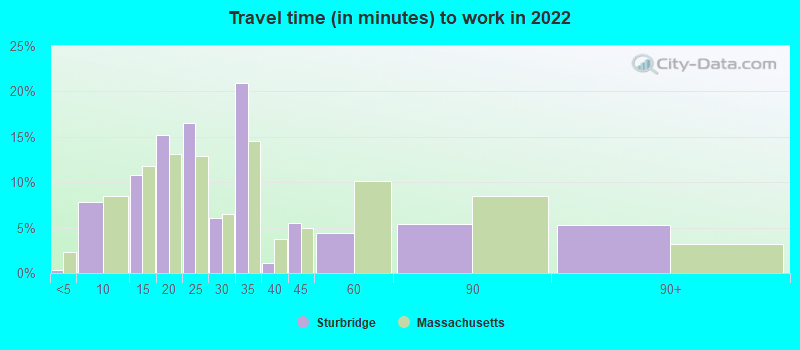
Travel time to work (commute)
- Less than 5 minutes: 19
- 5 to 9 minutes: 65
- 10 to 14 minutes: 115
- 15 to 19 minutes: 37
- 20 to 24 minutes: 0
- 25 to 29 minutes: 90
- 30 to 34 minutes: 91
- 35 to 39 minutes: 214
- 40 to 44 minutes: 231
- 45 to 59 minutes: 113
- 60 to 89 minutes: 142
- 90 or more minutes: 9
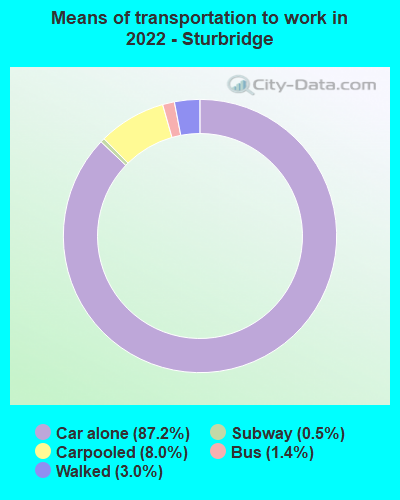
Means of transportation to work:
- Drove a car alone: 1,659 (81.7%)
- Carpooled: 162 (8.0%)
- Bus: 30 (1.5%)
- Long-distance train or commuter rail: 6 (0.3%)
- Walked: 41 (2.0%)
- Worked at home: 55 (2.7%)


- Year of entry for the foreign-born population in Sturbridge, Massachusetts
- 142010 or later
- 92000 to 2009
- 91990 to 1999
- 341980 to 1989
- 141970 to 1979
- 64Before 1970

First ancestries reported:
- English: 158 (27.3%)
- Irish: 78 (13.5%)
- American: 65 (11.2%)
- French Canadian: 39 (6.7%)
- Portuguese: 34 (5.9%)
- French: 27 (4.7%)
- Polish: 26 (4.5%)
- German: 24 (4.1%)
- Brazilian: 14 (2.4%)
- Italian: 14 (2.4%)
- African: 14 (2.4%)
- Eastern European: 10 (1.7%)
- British: 8 (1.4%)
- Czech: 8 (1.4%)
- Danish: 6 (1.0%)
Most common places of birth for foreign-born residents (%):
| Sturbridge: | 35.8% (24) |
| Massachusetts: | 0.1% (1,092) |
| Sturbridge: | 31.3% (21) |
| Massachusetts: | 0.7% (8,746) |
| Sturbridge: | 20.9% (14) |
| Massachusetts: | 7.6% (92,959) |
| Sturbridge: | 14.9% (10) |
| Massachusetts: | 0.9% (10,915) |
Place of birth for U.S.-born residents:
- This state: 1,683
- Other state: 438
- Northeast: 309
- Midwest: 58
- South: 49
- West: 17
89.8% of Sturbridge residents lived in the same house 1 years ago.
Out of people who lived in different houses, 38.9% lived in this county.
Out of people who lived in different counties, 91.7% lived in Massachusetts.
| Sturbridge: | 89.8% |
| State average: | 87.7% |
Education attainment for males 25 years and older:
- No schooling: 0
- Nursery to 4th grade: 0
- 5th and 6th grade: 0
- 7th and 8th grade: 0
- 9th grade: 0
- 10th grade: 0
- 11th grade: 0
- 12th grade, no diploma: 0
- High school graduate (or equivalency): 75
- Less than 1 year of college: 70
- Some college more than 1 year, no degree: 37
- Associate degree: 107
- Bachelor's degree: 256
- Master's degree: 216
- Professional school degree: 9
- Doctorate degree: 0

Education attainment for females 25 years and older:
- No schooling: 0
- Nursery to 4th grade: 0
- 5th and 6th grade: 0
- 7th and 8th grade: 0
- 9th grade: 0
- 10th grade: 1
- 11th grade: 0
- 12th grade, no diploma: 0
- High school graduate (or equivalency): 159
- Less than 1 year of college: 21
- Some college more than 1 year, no degree: 165
- Associate degree: 180
- Bachelor's degree: 160
- Master's degree: 144
- Professional school degree: 17
- Doctorate degree: 69


Housing units in structures:
- One, detached: 862
- Two: 44
- 3 or 4: 37
- 5 to 9: 46
- 10 to 19: 69
- 20 to 49: 12
- 50 or more: 8
- Mobile homes: 50
House/condo owner moved in on average 15 years ago
Renter moved in on average 1 years ago

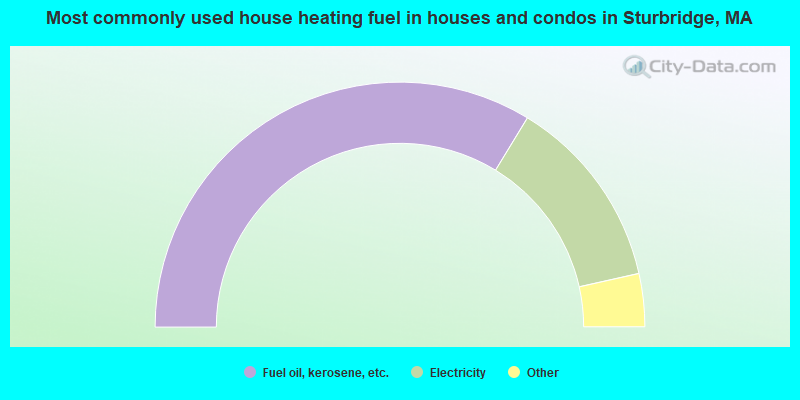
- 67.5%Fuel oil, kerosene, etc.
- 25.6%Electricity
- 3.2%Wood
- 1.4%Other fuel
- 1.2%Utility gas
- 1.1%Bottled, tank, or LP gas
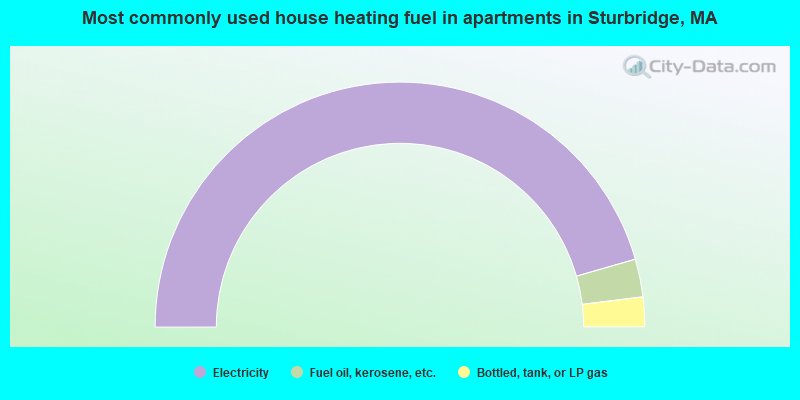
- 91.1%Electricity
- 5.0%Fuel oil, kerosene, etc.
- 3.9%Bottled, tank, or LP gas
Private vs. public school enrollment:
| Here: | 11.5% |
| Massachusetts: | 10.3% |
| Here: | 6.6% |
| Massachusetts: | 12.3% |
| Here: | 27.1% |
| Massachusetts: | 51.2% |


