Stuttgart, AR (Arkansas) Houses and Residents
Estimated median house or condo value in 2022: $166,957 (it was $58,500 in 2000 )
Stuttgart:
$166,957Arkansas:
$179,800
Lower value quartile - upper value quartile: $85,366 - $235,883Mean price in 2022: Detached houses: $178,940 Here:
$178,940State:
$243,881
Mobile homes: $42,266 Here:
$42,266State:
$79,566
Total population: 9,132 (All urban)
Houses: 4,083 (3,128 occupied: 1,780 owner occupied, 1,411 renter occupied )
% of renters here:
44%State:
34%
Housing density: 663 houses/condos per square mile
Median price asked for vacant for-sale houses and condos in 2022: $303,238.
Median contract rent in 2022: $529 (lower quartile is $408, upper quartile is $632)
Median rent asked for vacant for-rent units in 2022: $681
Median gross rent in Stuttgart, AR in 2022: $739
Housing units in Stuttgart with a mortgage: 875 (30 second mortgage, 0 home equity loan, 0 both second mortgage and home equity loan )Houses without a mortgage: 20
Median household income for houses/condos with a mortgage: $85,881
Median household income for apartments without a mortgage: $70,658
Median monthly housing costs: $738
Data:
Median house or condo value ($)
Median house or condo value ($ change since 2000)
Median house or condo value ($) - White
Median house or condo value ($) - Black or African American
Median house or condo value ($) - Asian
Median house or condo value ($) - Hispanic or Latino
Median house or condo value ($) - American Indian and Alaska Native
Median house or condo value ($) - Multirace
Median house or condo value ($) - Other Race
Median price asked for mobile homes ($)
Household density (households per square mile)
Mean house or condo value by units in structure - 1, detached ($)
Mean house or condo value by units in structure - 1, attached ($)
Mean house or condo value by units in structure - 2 ($)
Mean house or condo value by units in structure by units in structure - 3 or 4 ($)
Mean house or condo value by units in structure - 5 or more ($)
Mean house or condo value by units in structure - Boat, RV, van, etc. ($)
Mean house or condo value by units in structure - Mobile home ($)
Median contract rent ($)
Median contract rent - Lower quartile ($)
Median contract rent - Upper quartile ($)
Median gross rent ($)
Urban houses (%)
Rural houses (%)
Houses occupied (%)
Houses occupied (% change since 2000)
Houses owner occupied (%)
Houses owner occupied (% change since 2000)
Houses renter occupied (%)
Houses renter occupied (% change since 2000)
Vacant housing units - For rent (%)
Vacant housing units - For rent (% change since 2000)
Vacant housing units - For sale only (%)
Vacant housing units - For sale only (% change since 2000)
Vacant housing units - Rented or sold, not occupied (%)
Vacant housing units - Rented or sold, not occupied (% change since 2000)
Vacant housing units - For seasonal, recreational, or occasional use (%)
Vacant housing units - For seasonal, recreational, or occasional use (% change since 2000)
Vacant housing units - For migrant workers (%)
Vacant housing units - For migrant workers (% change since 2000)
Vacant housing units - Other vacant (%)
Vacant housing units - Other vacant (% change since 2000)
Median monthly housing costs ($)
Median household income for houses/condos with a mortgage ($)
Median household income for houses/condos without a mortgage ($)
Median household income ($)
Median household income ($) - White
Median household income ($) - Black or African American
Median household income ($) - Asian
Median household income ($) - Hispanic or Latino
Median household income ($) - American Indian and Alaska Native
Median household income ($) - Multirace
Median household income ($) - Other Race
Mortgage status - with mortgage (%)
Mortgage status - with second mortgage (%)
Mortgage status - with home equity loan (%)
Mortgage status - with both second mortgage and home equity loan (%)
Mortgage status - without a mortgage (%)
Median year house/condo built
Median year apartment built
Household type by relationship - Male householder living alone (%)
Household type by relationship - Male householder not living alone (%)
Household type by relationship - Female householder living alone (%)
Household type by relationship - Female householder not living alone (%)
Household type by relationship - Opposite-Sex spouse (%)
Household type by relationship - Same-Sex spouse (%)
Household type by relationship - Opposite-Sex unmarried partner (%)
Household type by relationship - Same-Sex unmarried partner (%)
Household type by relationship - In group quarters (%)
Size of family households - 2-person household (%)
Size of family households - 3-person household (%)
Size of family households - 4-person household (%)
Size of family households - 5-person household (%)
Size of family households - 6-person household (%)
Size of family households - 7-or-more-person household (%)
Size of nonfamily households - 1-person household (%)
Size of nonfamily households - 2-person household (%)
Size of nonfamily households - 3-person household (%)
Size of nonfamily households - 4-person household (%)
Size of nonfamily households - 5-person household (%)
Size of nonfamily households - 6-person household (%)
Size of nonfamily households - 7-or-moreperson household (%)
Year house built - Built 2010 or later (%)
Year house built - Built 2000 to 2009 (%)
Year house built - Built 1990 to 1999 (%)
Year house built - Built 1980 to 1989 (%)
Year house built - Built 1970 to 1979 (%)
Year house built - Built 1960 to 1969 (%)
Year house built - Built 1950 to 1959 (%)
Year house built - Built 1940 to 1949 (%)
Year house built - Built 1939 or earlier (%)
Median number of rooms in houses and condos
Median number of rooms in apartments
Median number of bedrooms in owner occupied houses
Mean number of bedrooms in owner occupied houses
Median number of bedrooms in renter occupied houses
Mean number of bedrooms in renter occupied houses
Median number of vehichles in owner occupied houses
Mean number of vehichles in owner occupied houses
Median number of vehichles in renter occupied houses
Mean number of vehichles in renter occupied houses
Rooms in owner-occupied houses - 1 room (%)
Rooms in owner-occupied houses - 2 rooms (%)
Rooms in owner-occupied houses - 3 rooms (%)
Rooms in owner-occupied houses - 4 rooms (%)
Rooms in owner-occupied houses - 5 rooms (%)
Rooms in owner-occupied houses - 6 rooms (%)
Rooms in owner-occupied houses - 7 rooms (%)
Rooms in owner-occupied houses - 8 rooms (%)
Rooms in owner-occupied houses - 9+ rooms (%)
Rooms in renter-occupied houses - 1 room (%)
Rooms in renter-occupied houses - 2 rooms (%)
Rooms in renter-occupied houses - 3 rooms (%)
Rooms in renter-occupied houses - 4 rooms (%)
Rooms in renter-occupied houses - 5 rooms (%)
Rooms in renter-occupied houses - 6 rooms (%)
Rooms in renter-occupied houses - 7 rooms (%)
Rooms in renter-occupied houses - 8 rooms (%)
Rooms in renter-occupied houses - 9+ rooms (%)
Bedrooms in owner-occupied houses - no bedrooms (%)
Bedrooms in owner-occupied houses - 1 bedroom (%)
Bedrooms in owner-occupied houses - 2 bedrooms (%)
Bedrooms in owner-occupied houses - 3 bedrooms (%)
Bedrooms in owner-occupied houses - 4 bedrooms (%)
Bedrooms in owner-occupied houses - 5+ bedrooms (%)
Bedrooms in renter-occupied houses - no bedrooms (%)
Bedrooms in renter-occupied houses - 1 bedroom (%)
Bedrooms in renter-occupied houses - 2 bedrooms (%)
Bedrooms in renter-occupied houses - 3 bedrooms (%)
Bedrooms in renter-occupied houses - 4 bedrooms (%)
Bedrooms in renter-occupied houses - 5+ bedrooms (%)
Vehicles available in owner-occupied houses - no vehicle available (%)
Vehicles available in owner-occupied houses - 1 vehicle available(%)
Vehicles available in owner-occupied houses - 2 Vehicles available (%)
Vehicles available in owner-occupied houses - 3 Vehicles available (%)
Vehicles available in owner-occupied houses - 4 Vehicles available (%)
Vehicles available in owner-occupied houses - 5+ Vehicles available (%)
Vehicles available in renter-occupied houses - no vehicle available (%)
Vehicles available in renter-occupied houses - 1 vehicle available (%)
Vehicles available in renter-occupied houses - 2 Vehicles available (%)
Vehicles available in renter-occupied houses - 3 Vehicles available (%)
Vehicles available in renter-occupied houses - 4 Vehicles available (%)
Vehicles available in renter-occupied houses - 5+ Vehicles available (%)
Housing units in structures - 1, detached (%)
Housing units in structures - 1, attached (%)
Housing units in structures - 2 (%)
Housing units in structures - 3 or 4 (%)
Housing units in structures - 5 to 9 (%)
Housing units in structures - 10 to 19 (%)
Housing units in structures - 20 to 49 (%)
Housing units in structures - 50 or more (%)
Housing units in structures - Mobile home (%)
Housing units in structures - Boat, RV, van, etc. (%)
Housing units in structures - Owners - 1, detached (%)
Housing units in structures - Owners - 1, attached (%)
Housing units in structures - Owners - 2 (%)
Housing units in structures - Owners - 3 or 4 (%)
Housing units in structures - Owners - 5 to 9 (%)
Housing units in structures - Owners - 10 to 19 (%)
Housing units in structures - Owners - 20 to 49 (%)
Housing units in structures - Owners - 50 or more (%)
Housing units in structures - Owners - Mobile home (%)
Housing units in structures - Owners - Boat, RV, van, etc. (%)
Housing units in structures - Renters - 1, detached (%)
Housing units in structures - Renters - 1, attached (%)
Housing units in structures - Renters - 2 (%)
Housing units in structures - Renters - 3 or 4 (%)
Housing units in structures - Renters - 5 to 9 (%)
Housing units in structures - Renters - 10 to 19 (%)
Housing units in structures - Renters - 20 to 49 (%)
Housing units in structures - Renters - 50 or more (%)
Housing units in structures - Renters - Mobile home (%)
Housing units in structures - Renters - Boat, RV, van, etc. (%)
House/condo owner moved in on average (years ago)
Renter moved in on average (years ago)
Year householder moved into unit - Moved in 1999 to March 2000 (%)
Year householder moved into unit - Moved in 1999 to March 2000 (%) - White
Year householder moved into unit - Moved in 1999 to March 2000 (%) - Black or African American
Year householder moved into unit - Moved in 1999 to March 2000 (%) - Asian
Year householder moved into unit - Moved in 1999 to March 2000 (%) - Hispanic or Latino
Year householder moved into unit - Moved in 1999 to March 2000 (%) - American Indian and Alaska Native
Year householder moved into unit - Moved in 1999 to March 2000 (%) - Multirace
Year householder moved into unit - Moved in 1999 to March 2000 (%) - Other Race
Year householder moved into unit - Moved in 1995 to 1998 (%)
Year householder moved into unit - Moved in 1995 to 1998 (%) - White
Year householder moved into unit - Moved in 1995 to 1998 (%) - Black or African American
Year householder moved into unit - Moved in 1995 to 1998 (%) - Asian
Year householder moved into unit - Moved in 1995 to 1998 (%) - Hispanic or Latino
Year householder moved into unit - Moved in 1995 to 1998 (%) - American Indian and Alaska Native
Year householder moved into unit - Moved in 1995 to 1998 (%) - Multirace
Year householder moved into unit - Moved in 1995 to 1998 (%) - Other Race
Year householder moved into unit - Moved in 1990 to 1994 (%)
Year householder moved into unit - Moved in 1990 to 1994 (%) - White
Year householder moved into unit - Moved in 1990 to 1994 (%) - Black or African American
Year householder moved into unit - Moved in 1990 to 1994 (%) - Asian
Year householder moved into unit - Moved in 1990 to 1994 (%) - Hispanic or Latino
Year householder moved into unit - Moved in 1990 to 1994 (%) - American Indian and Alaska Native
Year householder moved into unit - Moved in 1990 to 1994 (%) - Multirace
Year householder moved into unit - Moved in 1990 to 1994 (%) - Other Race
Year householder moved into unit - Moved in 1980 to 1989 (%)
Year householder moved into unit - Moved in 1980 to 1989 (%) - White
Year householder moved into unit - Moved in 1980 to 1989 (%) - Black or African American
Year householder moved into unit - Moved in 1980 to 1989 (%) - Asian
Year householder moved into unit - Moved in 1980 to 1989 (%) - Hispanic or Latino
Year householder moved into unit - Moved in 1980 to 1989 (%) - American Indian and Alaska Native
Year householder moved into unit - Moved in 1980 to 1989 (%) - Multirace
Year householder moved into unit - Moved in 1980 to 1989 (%) - Other Race
Year householder moved into unit - Moved in 1970 to 1979 (%)
Year householder moved into unit - Moved in 1970 to 1979 (%) - White
Year householder moved into unit - Moved in 1970 to 1979 (%) - Black or African American
Year householder moved into unit - Moved in 1970 to 1979 (%) - Asian
Year householder moved into unit - Moved in 1970 to 1979 (%) - Hispanic or Latino
Year householder moved into unit - Moved in 1970 to 1979 (%) - American Indian and Alaska Native
Year householder moved into unit - Moved in 1970 to 1979 (%) - Multirace
Year householder moved into unit - Moved in 1970 to 1979 (%) - Other Race
Year householder moved into unit - Moved in 1969 or earlier (%)
Year householder moved into unit - Moved in 1969 or earlier (%) - White
Year householder moved into unit - Moved in 1969 or earlier (%) - Black or African American
Year householder moved into unit - Moved in 1969 or earlier (%) - Asian
Year householder moved into unit - Moved in 1969 or earlier (%) - Hispanic or Latino
Year householder moved into unit - Moved in 1969 or earlier (%) - American Indian and Alaska Native
Year householder moved into unit - Moved in 1969 or earlier (%) - Multirace
Year householder moved into unit - Moved in 1969 or earlier (%) - Other Race
Housing units lacking complete plumbing facilities (%)
Housing units lacking complete kitchen facilities (%)
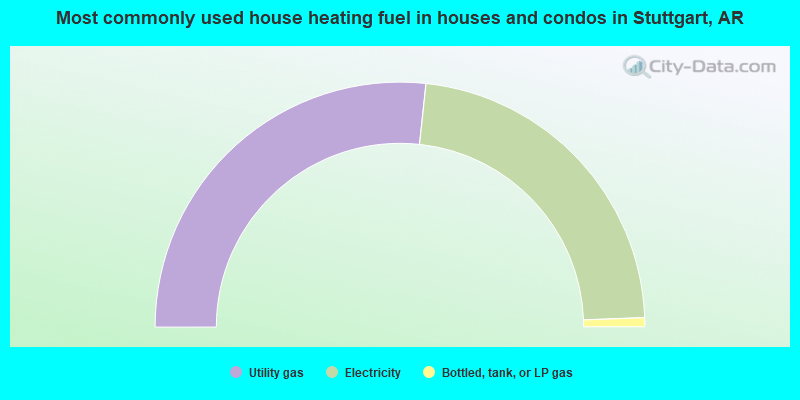
House heating fuel used in houses and condos - Utility gas (%)
House heating fuel used in houses and condos - Bottled, tank, or LP gas (%)
House heating fuel used in houses and condos - Electricity (%)
House heating fuel used in houses and condos - Fuel oil, kerosene, etc. (%)
House heating fuel used in houses and condos - Coal or coke (%)
House heating fuel used in houses and condos - Wood (%)
House heating fuel used in houses and condos - Solar energy (%)
House heating fuel used in houses and condos - Other fuel (%)
House heating fuel used in houses and condos - No fuel used (%)
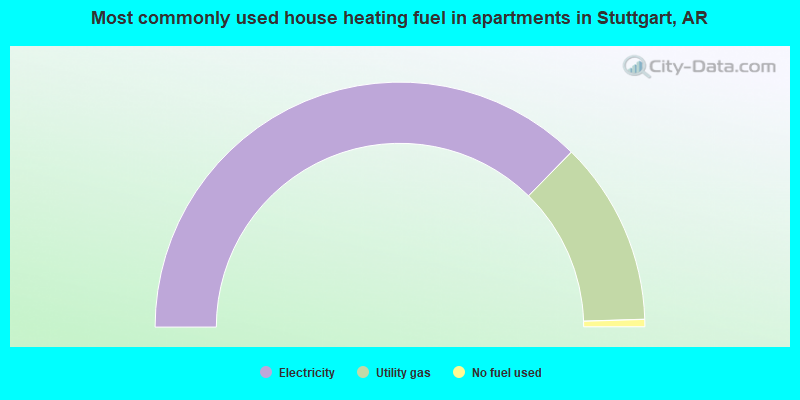
House heating fuel used in apartments - Utility gas (%)
House heating fuel used in apartments - Bottled, tank, or LP gas (%)
House heating fuel used in apartments - Electricity (%)
House heating fuel used in apartments - Fuel oil, kerosene, etc. (%)
House heating fuel used in apartments - Coal or coke (%)
House heating fuel used in apartments - Wood (%)
House heating fuel used in apartments - Solar energy (%)
House heating fuel used in apartments - Other fuel (%)
House heating fuel used in apartments - No fuel used (%)
Latest news about housing in Stuttgart, AR collected exclusively by city-data.com from local newspapers, TV, and radio stations
Median year house/condo built: 1973Median year apartment built: 1978Household type by relationship:
Households: 8,262
Male householders: 1,512 (329 living alone ), Female householders: 1,590 (659 living alone )1,510 spouses (1,510 opposite-sex spouses ), 357 unmarried partners , (357 opposite-sex unmarried partners ), 2,393 children (2,291 natural , 52 adopted , 49 stepchildren ), 326 grandchildren , 81 brothers or sisters , 102 parents , 19 foster children , 101 other relatives , 171 non-relatives In group quarters: 94
Size of family households: 1,050 2-persons , 429 3-persons , 267 4-persons , 123 5-persons , 84 6-persons , 27 7-or-more-persons .
Size of nonfamily households: 1,072 1-person , 110 2-persons , 38 3-persons .
1,294 married couples with children. single-parent households (228 men , 240 women ).
97.3% of residents of Stuttgart speak English at home. of residents speak Spanish at home (39% speak English very well , 46% speak English well , 15% speak English not well ).of residents speak other Indo-European language at home (100% speak English very well ).of residents speak Asian or Pacific Island language at home (100% speak English very well ).of residents speak other language at home (100% speak English well ).
Foreign born population: 155 (1.9%)of them are naturalized citizens )
Median number of rooms in houses and condos:
Median number of rooms in apartments
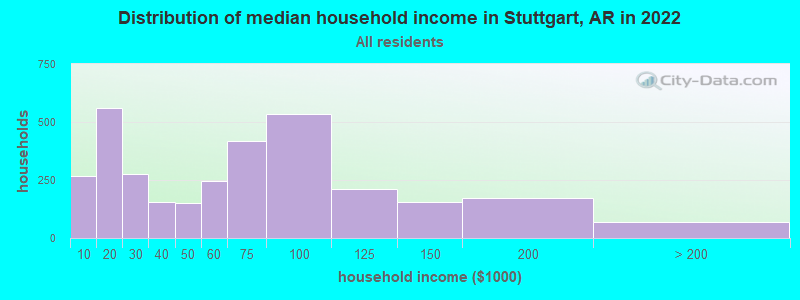
Stuttgart, AR household income distribution 267 Less than $10,000559 $10,000 to $19,999276 $20,000 to $29,999156 $30,000 to $39,999153 $40,000 to $49,999244 $50,000 to $59,999418 $60,000 to $74,999535 $75,000 to $99,999212 $100,000 to $124,999157 $125,000 to $149,999172 $150,000 to $199,99970 $200,000 or more
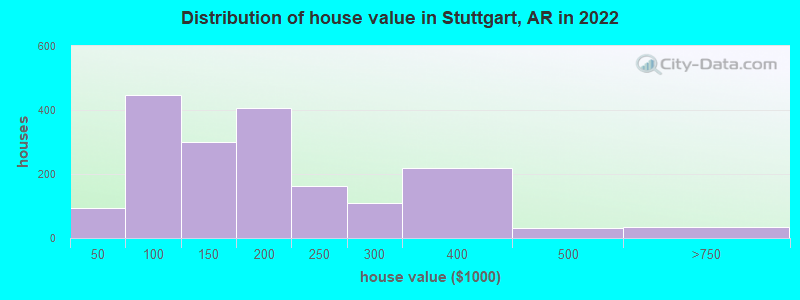
Home value of owner - occupied houses in 2022 in Stuttgart, AR 11 Less than $10,0005 $10,000 to $14,9996 $15,000 to $19,9999 $20,000 to $24,9997 $25,000 to $29,99926 $30,000 to $34,99926 $40,000 to $49,999103 $50,000 to $59,99972 $60,000 to $69,999154 $70,000 to $79,99981 $80,000 to $89,99910 $90,000 to $99,999264 $100,000 to $124,99935 $125,000 to $149,999251 $150,000 to $174,999153 $175,000 to $199,999163 $200,000 to $249,999109 $250,000 to $299,999217 $300,000 to $399,99932 $400,000 to $499,99928 $500,000 to $749,9995 $750,000 to $999,999Rent paid by renters in 2022 in Stuttgart, AR 22 Less than $1008 $100 to $14966 $150 to $19929 $200 to $2498 $250 to $29954 $300 to $349104 $350 to $399168 $400 to $44970 $450 to $499201 $500 to $549167 $550 to $59978 $600 to $64960 $650 to $69938 $700 to $74959 $750 to $79988 $800 to $89926 $900 to $99910 $1,250 to $1,499153 No cash rent
Percentage of workers working in this county: 93.1%Number of people working at home: 81 (2.4% of all workers )
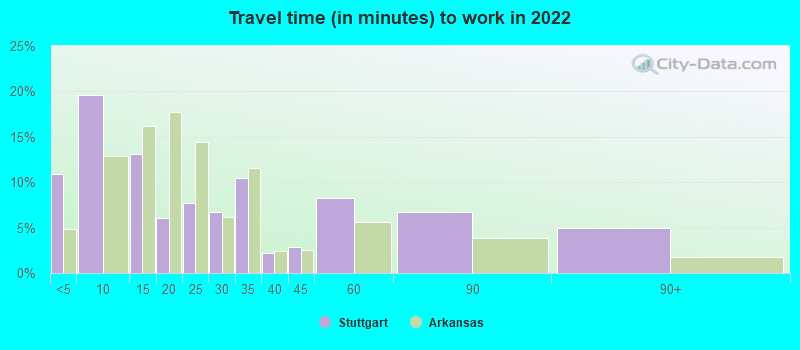
Travel time to work (commute)
Less than 5 minutes: 5985 to 9 minutes: 1,00610 to 14 minutes: 62815 to 19 minutes: 27420 to 24 minutes: 4225 to 29 minutes: 3930 to 34 minutes: 14635 to 39 minutes: 2440 to 44 minutes: 3945 to 59 minutes: 10260 to 89 minutes: 19890 or more minutes: 103
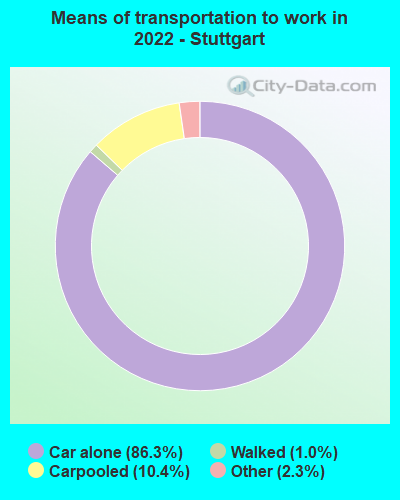
Means of transportation to work:
Drove a car alone: 5,042 (84.5%)Carpooled: 529 (8.9%)Bus : 2 (0.0%)Taxi: 146 (2.4%)Walked: 60 (1.0%)Worked at home: 81 (1.4%)
Unemployment by race in 2022
Unemployment rate for White non-Hispanic residents 3.6% Males1.4% FemalesUnemployment rate for Black residents 10.1% Males16.6% FemalesUnemployment rate for other race residents 38.4% FemalesUnemployment rate for Hispanic or Latino residents 37.4% Females
Year of entry for the foreign-born population in Stuttgart, Arkansas
9 2010 or later 84 2000 to 2009 29 1990 to 1999 12 1980 to 1989 0 1970 to 1979 11 Before 1970
First ancestries reported:
English: 439 (9.8%)
German: 353 (7.9%)
American: 258 (5.8%)
Irish: 131 (2.9%)
European: 62 (1.4%)
Ethiopian: 33 (0.7%)
Lebanese: 31 (0.7%)
British: 20 (0.4%)
French: 16 (0.4%)
Norwegian: 15 (0.3%)
Greek: 14 (0.3%)
Scottish: 11 (0.2%)
Nigerian: 11 (0.2%)
Scotch-Irish: 8 (0.2%)
Welsh: 8 (0.2%)
French Canadian: 3 (0.07%)
Dutch: 1 (0.02%) Most common places of birth for foreign-born residents (%): Mexico Stuttgart:
44.8% (69)Arkansas:
40.2% (61,075)
Ethiopia Stuttgart:
20.8% (32)Arkansas:
0.1% (80)
El Salvador Stuttgart:
18.8% (29)Arkansas:
10.7% (16,210)
Australia Stuttgart:
7.1% (11)Arkansas:
0.2% (371)
China, excluding Hong Kong and Taiwan Stuttgart:
3.9% (6)Arkansas:
2.3% (3,503)
Place of birth for U.S.-born residents:
This state: 6,865Other state: 1,121Northeast: 8Midwest: 367South: 688West: 50 85.2% of Stuttgart residents lived in the same house 1 years ago.
Out of people who lived in different houses, 37.8% lived in this county.
Out of people who lived in different counties, 55.7% lived in Arkansas.
Stuttgart:
85.2%State average:
87.0%
Education attainment for males 25 years and older:
No schooling: 42Nursery to 4th grade: 05th and 6th grade: 127th and 8th grade: 419th grade: 5210th grade: 10211th grade: 2312th grade, no diploma: 41High school graduate (or equivalency): 1,119Less than 1 year of college: 94Some college more than 1 year, no degree: 248Associate degree: 234Bachelor's degree: 327Master's degree: 104Professional school degree: 34Doctorate degree: 42
Education attainment for females 25 years and older:
No schooling: 25Nursery to 4th grade: 05th and 6th grade: 237th and 8th grade: 399th grade: 1810th grade: 13811th grade: 3212th grade, no diploma: 93High school graduate (or equivalency): 1,283Less than 1 year of college: 158Some college more than 1 year, no degree: 344Associate degree: 475Bachelor's degree: 307Master's degree: 153Professional school degree: 11Doctorate degree: 4
Housing units in structures:
One, detached: 3,126One, attached: 10Two: 1313 or 4: 2895 to 9: 25310 to 19: 9120 to 49: 24Mobile homes: 155Housing units lacking complete plumbing facilities in 2022: 7.8%Housing units lacking complete kitchen facilities in 2022: 7.3%House/condo owner moved in on average 14 years ago
Renter moved in on average 4 years ago
Private vs. public school enrollment:
Students in private schools in grades 1 to 8 (elementary and middle school): 126 Students in private schools in grades 9 to 12 (high school): 15 Students in private undergraduate colleges: 19