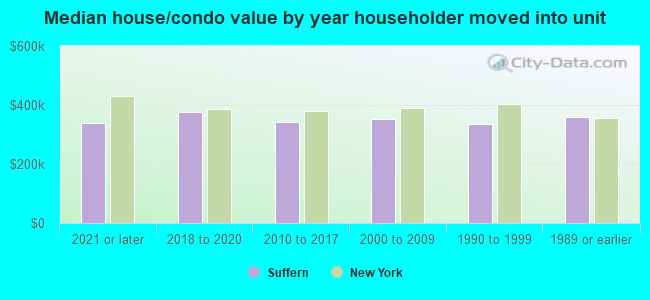
Suffern, NY (New York) Houses and Residents
| Suffern: | $351,306 |
| New York: | $400,400 |
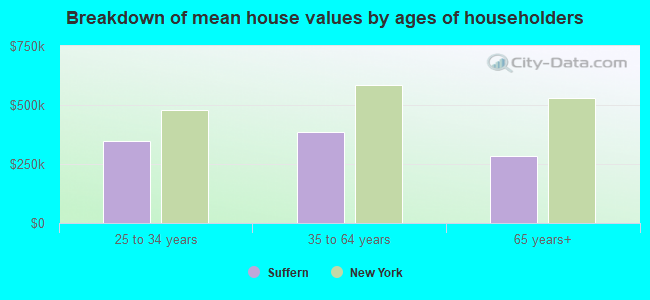
Mean price in 2022:
Detached houses: $473,694
Here: $473,694 State: $476,719 Townhouses or other attached units: $381,447
Here: $381,447 State: $699,270 In 2-unit structures: $348,429
Here: $348,429 State: $713,077 In 3-to-4-unit structures: $160,182
Here: $160,182 State: $764,568 In 5-or-more-unit structures: $223,321
Here: $223,321 State: $912,009
Total population: 10,991 (All urban)
Houses: 4,946 (4,696 occupied: 3,267 owner occupied, 1,459 renter occupied)
| % of renters here: | 31% |
| State: | 46% |
Housing density: 2,366 houses/condos per square mile
Median price asked for vacant for-sale houses and condos in 2022: $727,858.
Median contract rent in 2022: $1,693 (lower quartile is $1,308, upper quartile is $1,937)
Median rent asked for vacant for-rent units in 2022: $1,565
Median gross rent in Suffern, NY in 2022: $1,795
Housing units in Suffern with a mortgage: 1,894 (179 second mortgage, 0 home equity loan, 154 both second mortgage and home equity loan)
Houses without a mortgage: 81
Median household income for houses/condos with a mortgage: $146,399
Median household income for apartments without a mortgage: $61,666
Median monthly housing costs: $1,830
Compare current foreclosures in Suffern, NY:
| Photo | Address | Area | Beds / Baths | Price | Details |
|---|---|---|---|---|---|

|
#1
Oakdale Mnr Apt A6d
Suffern, NY 10901
|
750 sq. feet
|
1 baths 1 beds |
$99,900
|
show details |

|
#2
Fox Ct
Suffern, NY 10901
|
2,749 sq. feet
|
2 baths 3 beds |
show details | |

|
#3
Kevin Dr
Suffern, NY 10901
|
2,579 sq. feet
|
3 baths 5 beds |
show details | |

|
#4
A-B Ridge Ave
Suffern, NY 10901
|
- sq. feet
|
2 baths 4 beds |
show details | |

|
#5
Clinton Pl
Suffern, NY 10901
|
1,681 sq. feet
|
1 baths 3 beds |
show details | |

|
#6
Hunte Ct
Suffern, NY 10901
|
2,116 sq. feet
|
3 baths 4 beds |
show details | |

|
#7
Lonergan Dr
Suffern, NY 10901
|
1,326 sq. feet
|
1 baths 3 beds |
show details | |

|
#8
Somerset Dr
Suffern, NY 10901
|
1,620 sq. feet
|
2 baths 2 beds |
show details | |

|
#9
Doxbury Ln
Suffern, NY 10901
|
1,300 sq. feet
|
2 baths 2 beds |
show details | |

|
#10
Bolger Ln
Suffern, NY 10901
|
2,775 sq. feet
|
3 baths 5 beds |
show details |
| Photo | Address | Area | Beds / Baths | Price | Details |
|---|---|---|---|---|---|

|
#11
Lime Kiln Rd
Suffern, NY 10901
|
2,586 sq. feet
|
1 baths 3 beds |
show details | |

|
#12
Heather Dr
Suffern, NY 10901
|
1,816 sq. feet
|
2 baths 3 beds |
show details | |

|
#13
Lackawanna Trl
Suffern, NY 10901
|
1,400 sq. feet
|
2 baths 3 beds |
show details | |

|
#14
Ramapo Ave
Suffern, NY 10901
|
1,237 sq. feet
|
2 baths 3 beds |
show details | |

|
#15
Astri Ct
Suffern, NY 10901
|
2,469 sq. feet
|
2 baths 4 beds |
show details | |

|
#16
S Airmont Rd
Suffern, NY 10901
|
1,741 sq. feet
|
2 baths 4 beds |
show details | |

|
#17
Kevin Dr
Suffern, NY 10901
|
2,579 sq. feet
|
2 baths 3 beds |
show details | |

|
#18
Somerset Dr
Suffern, NY 10901
|
1,620 sq. feet
|
2 baths 2 beds |
show details | |

|
#19
Margo Ct
Suffern, NY 10901
|
3,512 sq. feet
|
3 baths 5 beds |
show details | |

|
#20
Dakota Ct
Suffern, NY 10901
|
2,632 sq. feet
|
2 baths 3 beds |
show details |
| Photo | Address | Area | Beds / Baths | Price | Details |
|---|---|---|---|---|---|

|
#21
Canterbury Ln
Suffern, NY 10901
|
2,153 sq. feet
|
3 baths 4 beds |
show details | |

|
#22
Blossom Rd
Suffern, NY 10901
|
2,130 sq. feet
|
2 baths 4 beds |
show details | |

|
#23
Mayer Dr
Suffern, NY 10901
|
1,906 sq. feet
|
3 baths 3 beds |
show details | |

|
#24
Dalewood Dr
Suffern, NY 10901
|
2,118 sq. feet
|
2 baths 3 beds |
show details | |

|
#25
Hillside Ct
Suffern, NY 10901
|
2,140 sq. feet
|
2 baths 5 beds |
show details | |

|
#26
Iroquois Ct
Suffern, NY 10901
|
1,626 sq. feet
|
2 baths 2 beds |
show details | |

|
#27
Crestwood Dr
Suffern, NY 10901
|
1,457 sq. feet
|
1 baths 3 beds |
show details | |

|
#28
Somerset Dr
Suffern, NY 10901
|
1,230 sq. feet
|
2 baths 2 beds |
show details | |

|
#29
Wayne Ave
Suffern, NY 10901
|
1,432 sq. feet
|
1 baths 3 beds |
show details | |

|
#30
Prospect Pl
Suffern, NY 10901
|
864 sq. feet
|
1 baths 2 beds |
show details |
| Photo | Address | Area | Beds / Baths | Price | Details |
|---|---|---|---|---|---|

|
#31
Ayden Ct
Suffern, NY 10901
|
3,196 sq. feet
|
2 baths 5 beds |
show details | |

|
#32
Prairie Ave
Suffern, NY 10901
|
2,128 sq. feet
|
1 baths 2 beds |
show details | |

|
#33
Somerset Dr Apt 11g
Suffern, NY 10901
|
1,270 sq. feet
|
2 baths 2 beds |
show details | |

|
#34
Lackawanna Trl
Suffern, NY 10901
|
1,170 sq. feet
|
2 baths 2 beds |
show details | |

|
#35
Hillcrest Rd
Suffern, NY 10901
|
6,353 sq. feet
|
2 baths 5 beds |
show details | |

|
#36
Ruby St # 1
Suffern, NY 10901
|
- sq. feet
|
- baths - beds |
show details | |

|
#37
Ridge A-B
Suffern, NY 10901
|
- sq. feet
|
- baths - beds |
show details | |

|
#38
Annette Ln
Suffern, NY 10901
|
- sq. feet
|
- baths - beds |
show details | |

|
#39
Cherry Ln
Suffern, NY 10901
|
- sq. feet
|
- baths - beds |
show details | |

|
#40
Montebello Commons Dr
Suffern, NY 10901
|
- sq. feet
|
- baths - beds |
show details |
| Photo | Address | Area | Beds / Baths | Price | Details |
|---|---|---|---|---|---|

|
#41
N De Baun Ave Unit 102
Suffern, NY 10901
|
- sq. feet
|
- baths - beds |
show details | |

|
#42
Pomona Rd
Suffern, NY 10901
|
- sq. feet
|
- baths - beds |
show details | |

|
#43
Washington Ave
Suffern, NY 10901
|
- sq. feet
|
- baths - beds |
show details | |

|
#44
Yorkshire Dr Apt Z5
Suffern, NY 10901
|
- sq. feet
|
- baths - beds |
show details | |

|
#45
Yorkshire Dr Unit Z 5
Suffern, NY 10901
|
- sq. feet
|
- baths - beds |
show details | |

|
#46
N Airmont Rd
Suffern, NY 10901
|
- sq. feet
|
- baths - beds |
show details | |

|
#47
Ridge Ave # B
Suffern, NY 10901
|
- sq. feet
|
- baths - beds |
show details | |

|
Check over 1 million property listings on Foreclosure.com!
|
browse all offers | |||

Latest news about housing in Suffern, NY collected exclusively by city-data.com from local newspapers, TV, and radio stations

 | House Upstate (46 replies) |
| Small towns with movie theaters (61 replies) |
| smaller Upstate NY cities and towns/African American communities (5992 replies) |
| Upper Middle class african-american communities in ny (2052 replies) |
| Looking for info on Suffern and similar nearby towns (2 replies) |
| LI High Schools in USN&WR 2021 Annual Rankings (87 replies) |

Median year apartment built: 1963
Household type by relationship:
Households: 11,433- Male householders: 2,041 (551 living alone), Female householders: 2,645 (1,277 living alone)
2,094 spouses (2,089 opposite-sex spouses), 245 unmarried partners, (239 opposite-sex unmarried partners), 3,113 children (2,932 natural, 2 adopted, 178 stepchildren), 155 grandchildren, 191 brothers or sisters, 165 parents, 0 foster children, 367 other relatives, 164 non-relatives
- In group quarters: 247
Size of family households: 1,142 2-persons, 650 3-persons, 451 4-persons, 277 5-persons, 35 6-persons, 65 7-or-more-persons.
Size of nonfamily households: 2,122 1-person, 166 2-persons, 10 5-persons.
1,719 married couples with children.
367 single-parent households (38 men, 329 women).
70.3% of residents of Suffern speak English at home.
12.1% of residents speak Spanish at home (50% speak English very well, 28% speak English well, 20% speak English not well, 2% don't speak English at all).
10.5% of residents speak other Indo-European language at home (66% speak English very well, 22% speak English well, 10% speak English not well, 2% don't speak English at all).
4.1% of residents speak Asian or Pacific Island language at home (64% speak English very well, 29% speak English well, 7% speak English not well).
1.9% of residents speak other language at home (55% speak English very well, 16% speak English well, 29% speak English not well).
Foreign born population: 2,632 (23.0%)
(56.4% of them are naturalized citizens)
| Here: | 5.3 |
| State: | 6.3 |
| Here: | 3.6 |
| State: | 3.8 |
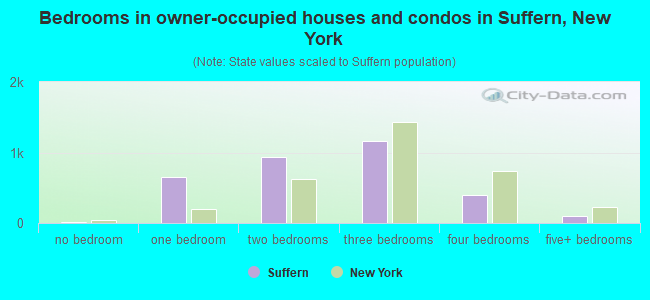
- Bedrooms in owner-occupied houses and condos in Suffern, New York
- 19no bedroom
- 6501 bedroom
- 9362 bedrooms
- 1,1643 bedrooms
- 4044 bedrooms
- 955+ bedrooms
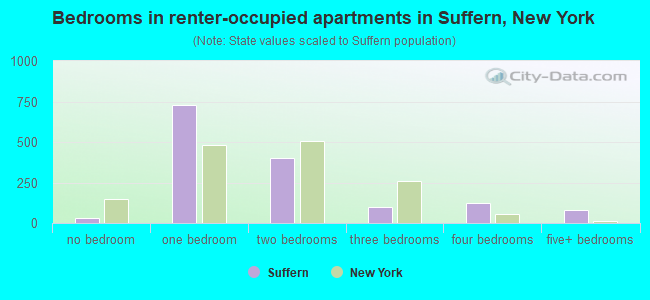
- Bedrooms in renter-occupied apartments in Suffern, New York
- 32no bedroom
- 7281 bedroom
- 4002 bedrooms
- 993 bedrooms
- 1224 bedrooms
- 785+ bedrooms
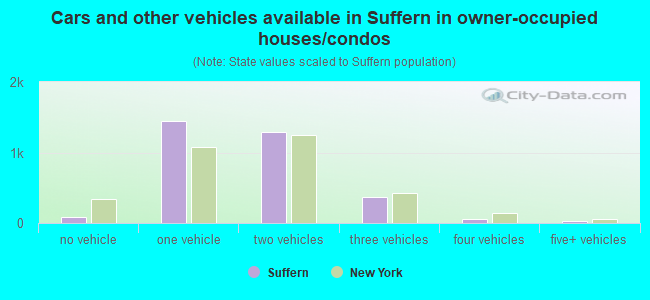
- Cars and other vehicles available in Suffern in owner-occupied houses/condos
- 91no vehicle
- 1,4401 vehicle
- 1,2862 vehicles
- 3663 vehicles
- 514 vehicles
- 345+ vehicles
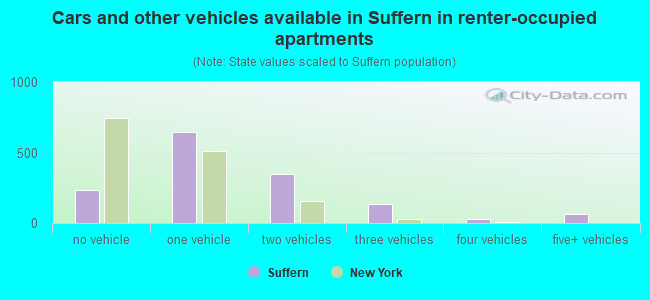
- Cars and other vehicles available in Suffern in renter-occupied apartments
- 236no vehicle
- 6441 vehicle
- 3512 vehicles
- 1363 vehicles
- 274 vehicles
- 665+ vehicles
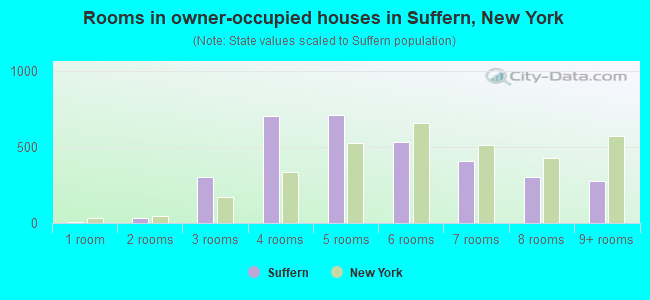
- Rooms in owner-occupied houses in Suffern, New York
- 71 room
- 312 rooms
- 3033 rooms
- 7024 rooms
- 7105 rooms
- 5296 rooms
- 4087 rooms
- 3058 rooms
- 2739+ rooms
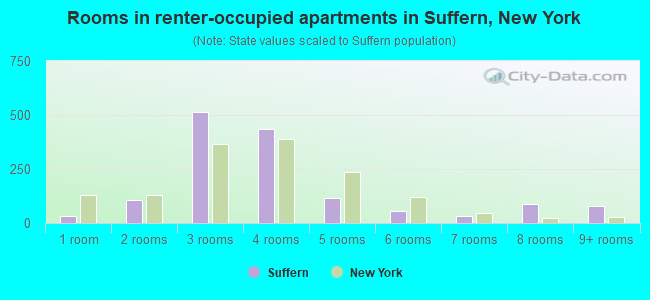
- Rooms in renter-occupied apartments in Suffern, New York
- 321 room
- 1072 rooms
- 5153 rooms
- 4354 rooms
- 1145 rooms
- 576 rooms
- 317 rooms
- 908 rooms
- 789+ rooms
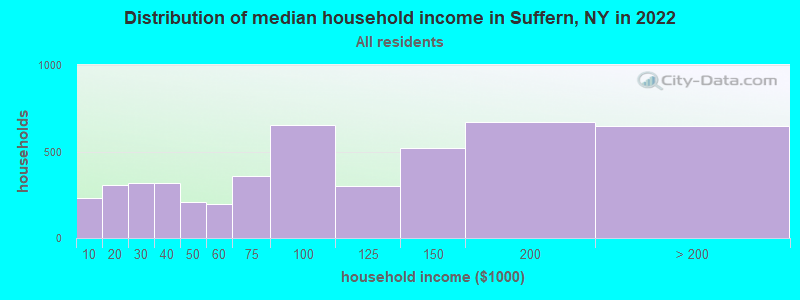
Suffern, NY household income distribution

- 229Less than $10,000
- 308$10,000 to $19,999
- 318$20,000 to $29,999
- 321$30,000 to $39,999
- 206$40,000 to $49,999
- 195$50,000 to $59,999
- 360$60,000 to $74,999
- 652$75,000 to $99,999
- 299$100,000 to $124,999
- 520$125,000 to $149,999
- 671$150,000 to $199,999
- 649$200,000 or more
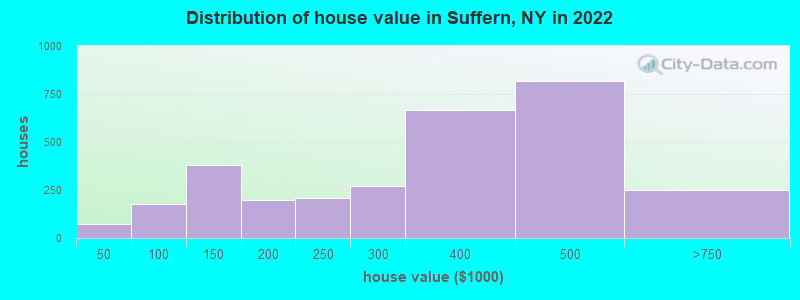
Home value of owner - occupied houses in 2022 in Suffern, NY
-
- 20Less than $10,000
- 23$30,000 to $34,999
- 27$35,000 to $39,999
- 49$50,000 to $59,999
- 14$60,000 to $69,999
- 24$70,000 to $79,999
- 49$80,000 to $89,999
- 41$90,000 to $99,999
- 57$100,000 to $124,999
- 322$125,000 to $149,999
- 119$150,000 to $174,999
- 79$175,000 to $199,999
- 206$200,000 to $249,999
- 271$250,000 to $299,999
- 667$300,000 to $399,999
- 815$400,000 to $499,999
- 239$500,000 to $749,999
- 4$1,000,000 to $1,499,999
- 8$1,500,000 to $1,999,999
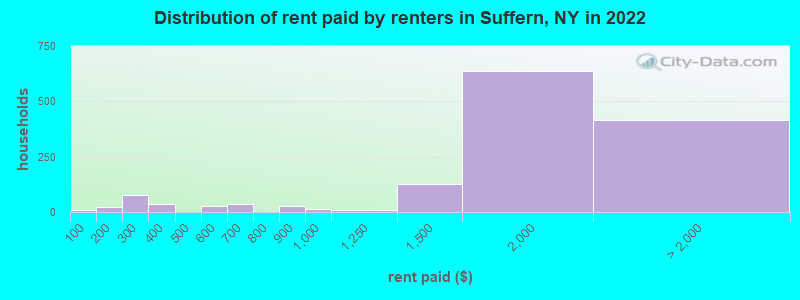
Rent paid by renters in 2022 in Suffern, NY
-
- 10Less than $100
- 20$150 to $199
- 67$200 to $249
- 10$250 to $299
- 37$350 to $399
- 22$500 to $549
- 5$550 to $599
- 37$600 to $649
- 25$800 to $899
- 11$900 to $999
- 6$1,000 to $1,249
- 127$1,250 to $1,499
- 636$1,500 to $1,999
- 157$2,000 to $2,499
- 72$2,500 to $2,999
- 41$3,000 to $3,499
- 7$3,500 or more
- 136No cash rent
Percentage of workers working in this county: 51.6%
Number of people working at home: 742 (12.6% of all workers)
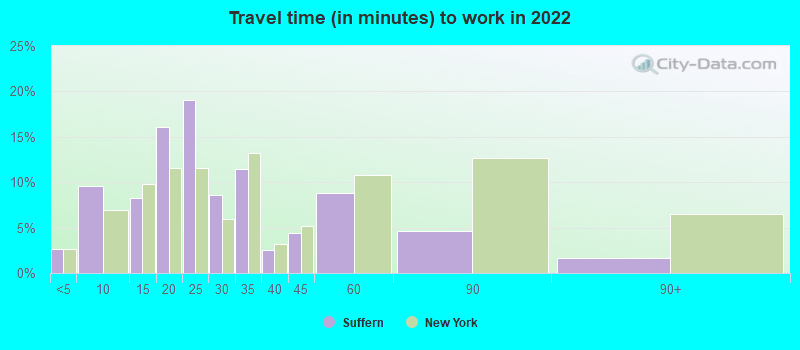
Travel time to work (commute)
- Less than 5 minutes: 102
- 5 to 9 minutes: 666
- 10 to 14 minutes: 433
- 15 to 19 minutes: 453
- 20 to 24 minutes: 547
- 25 to 29 minutes: 429
- 30 to 34 minutes: 780
- 35 to 39 minutes: 130
- 40 to 44 minutes: 249
- 45 to 59 minutes: 525
- 60 to 89 minutes: 487
- 90 or more minutes: 279
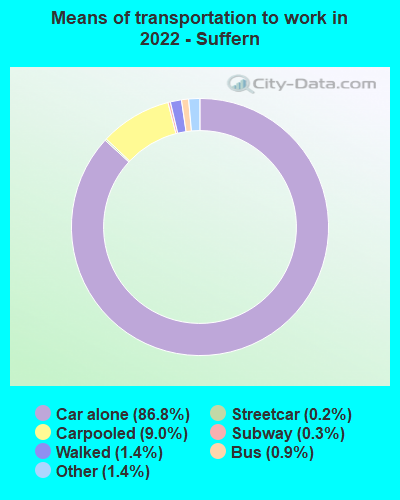
Means of transportation to work:
- Drove a car alone: 4,380 (70.8%)
- Carpooled: 580 (9.4%)
- Bus: 44 (0.7%)
- Subway or elevated rail: 7 (0.1%)
- Long-distance train or commuter rail: 21 (0.3%)
- Taxi: 95 (1.5%)
- Walked: 91 (1.5%)
- Worked at home: 742 (12.0%)
- Unemployment by race in 2022
- Unemployment rate for White non-Hispanic residents
- 3.3%Males
- 4.3%Females
- Unemployment rate for Black residents
- 7.9%Males
- 9.6%Females
- Unemployment rate for American Indian and Alaska Native residents
- 21.9%Males
- Unemployment rate for Asian residents
- 18.5%Males
- 0.9%Females
- Unemployment rate for other race residents
- 6.7%Females
- Unemployment rate for Hispanic or Latino residents
- 1.5%Males
- 5.4%Females
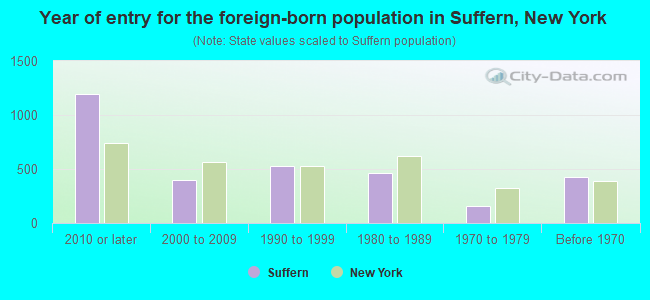
- Year of entry for the foreign-born population in Suffern, New York
- 1,1982010 or later
- 3992000 to 2009
- 5301990 to 1999
- 4641980 to 1989
- 1551970 to 1979
- 424Before 1970
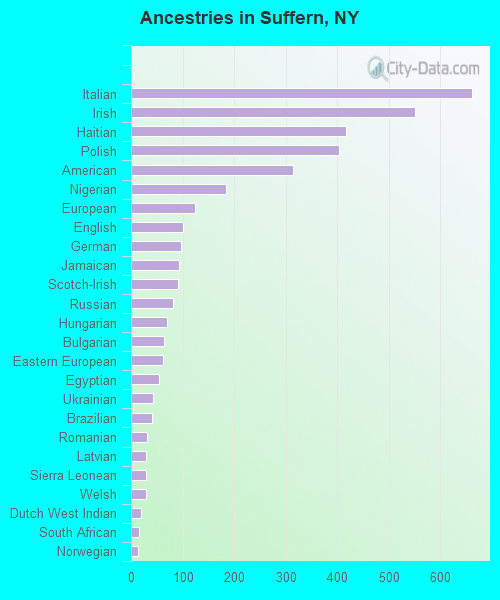
First ancestries reported:
- Italian: 661 (11.5%)
- Irish: 551 (9.6%)
- Haitian: 417 (7.3%)
- Polish: 404 (7.0%)
- American: 315 (5.5%)
- Nigerian: 184 (3.2%)
- European: 125 (2.2%)
- English: 101 (1.8%)
- German: 97 (1.7%)
- Jamaican: 93 (1.6%)
- Scotch-Irish: 92 (1.6%)
- Russian: 82 (1.4%)
- Hungarian: 69 (1.2%)
- Bulgarian: 64 (1.1%)
- Eastern European: 62 (1.1%)
- Egyptian: 54 (0.9%)
- Ukrainian: 43 (0.8%)
- Brazilian: 41 (0.7%)
- Romanian: 31 (0.5%)
- Latvian: 30 (0.5%)
- Sierra Leonean: 29 (0.5%)
- Welsh: 29 (0.5%)
- Dutch West Indian: 20 (0.3%)
- South African: 15 (0.3%)
- Norwegian: 13 (0.2%)
- Danish: 12 (0.2%)
- Swedish: 10 (0.2%)
- Arab: 9 (0.2%)
- Guyanese: 9 (0.2%)
- British: 8 (0.1%)
- Croatian: 8 (0.1%)
- Czech: 8 (0.1%)
- Slavic: 8 (0.1%)
- Canadian: 7 (0.1%)
- French Canadian: 7 (0.1%)
- Israeli: 6 (0.1%)
- Dutch: 6 (0.1%)
- Northern European: 5 (0.09%)
- French: 5 (0.09%)
- Scottish: 4 (0.07%)
- Austrian: 3 (0.05%)
Most common places of birth for foreign-born residents (%):
| Suffern: | 16.9% (453) |
| New York: | 4.8% (214,559) |
| Suffern: | 15.2% (406) |
| New York: | 2.8% (126,936) |
| Suffern: | 7.1% (189) |
| New York: | 1.4% (61,245) |
| Suffern: | 5.9% (158) |
| New York: | 0.1% (6,729) |
| Suffern: | 5.2% (140) |
| New York: | 3.5% (158,432) |
| Suffern: | 5.2% (139) |
| New York: | 0.7% (33,746) |
| Suffern: | 3.4% (92) |
| New York: | 1.8% (81,374) |
| Suffern: | 3.4% (91) |
| New York: | 3.9% (177,448) |
| Suffern: | 2.3% (61) |
| New York: | 5.0% (227,557) |
| Suffern: | 2.2% (60) |
| New York: | 1.4% (62,442) |
| Suffern: | 2.2% (59) |
| New York: | 0.6% (27,385) |
| Suffern: | 1.9% (50) |
| New York: | 0.1% (5,444) |
| Suffern: | 1.8% (49) |
| New York: | 0.1% (3,296) |
| Suffern: | 1.6% (44) |
| New York: | 0.7% (30,658) |
| Suffern: | 1.6% (43) |
| New York: | 0.1% (2,567) |
| Suffern: | 1.6% (42) |
| New York: | 1.7% (78,421) |
| Suffern: | 1.5% (41) |
| New York: | 0.6% (26,772) |
Place of birth for U.S.-born residents:
- This state: 6,736
- Other state: 1,686
- Northeast: 1,319
- Midwest: 77
- South: 207
- West: 100
90.8% of Suffern residents lived in the same house 1 years ago.
Out of people who lived in different houses, 39.1% lived in this county.
Out of people who lived in different counties, 74.2% lived in New York.
| Suffern: | 90.8% |
| State average: | 89.6% |
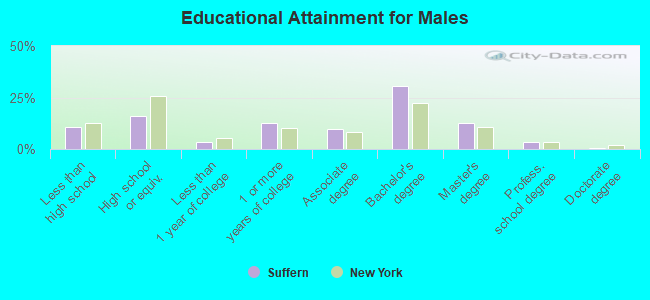
Education attainment for males 25 years and older:
- No schooling: 65
- Nursery to 4th grade: 10
- 5th and 6th grade: 63
- 7th and 8th grade: 7
- 9th grade: 38
- 10th grade: 54
- 11th grade: 29
- 12th grade, no diploma: 123
- High school graduate (or equivalency): 577
- Less than 1 year of college: 130
- Some college more than 1 year, no degree: 462
- Associate degree: 347
- Bachelor's degree: 1,103
- Master's degree: 452
- Professional school degree: 117
- Doctorate degree: 19
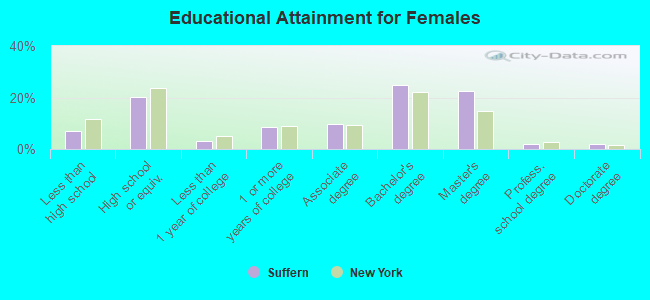
Education attainment for females 25 years and older:
- No schooling: 166
- Nursery to 4th grade: 9
- 5th and 6th grade: 42
- 7th and 8th grade: 17
- 9th grade: 17
- 10th grade: 1
- 11th grade: 27
- 12th grade, no diploma: 51
- High school graduate (or equivalency): 923
- Less than 1 year of college: 151
- Some college more than 1 year, no degree: 397
- Associate degree: 445
- Bachelor's degree: 1,142
- Master's degree: 1,045
- Professional school degree: 87
- Doctorate degree: 85


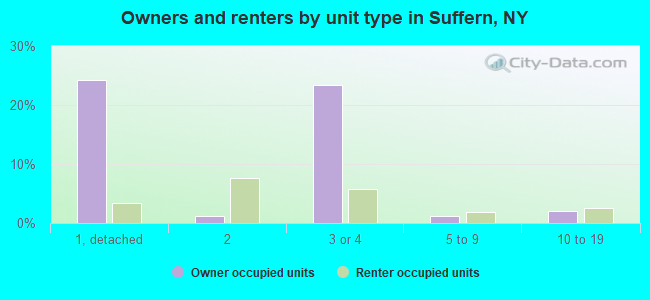
Housing units in structures:
- One, detached: 1,298
- One, attached: 806
- Two: 435
- 3 or 4: 1,286
- 5 to 9: 218
- 10 to 19: 265
- 20 to 49: 74
- 50 or more: 561
Housing units lacking complete kitchen facilities in 2022: 1.8%
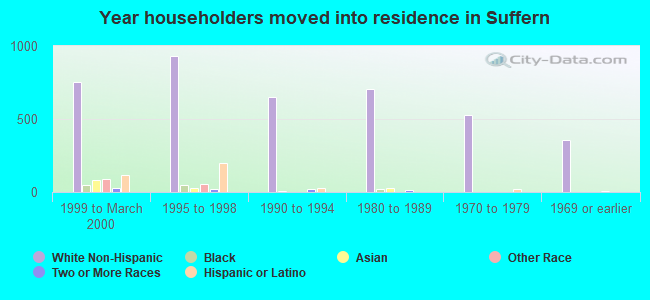
House/condo owner moved in on average 15 years ago
Renter moved in on average 4 years ago
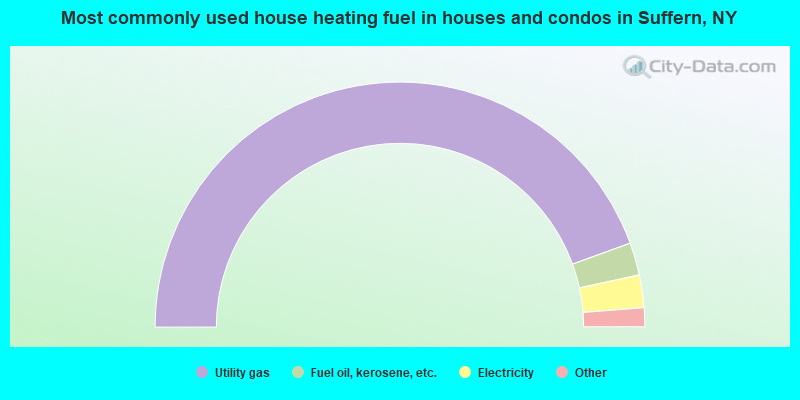
- 88.9%Utility gas
- 4.3%Fuel oil, kerosene, etc.
- 4.3%Electricity
- 2.2%Bottled, tank, or LP gas
- 0.2%No fuel used
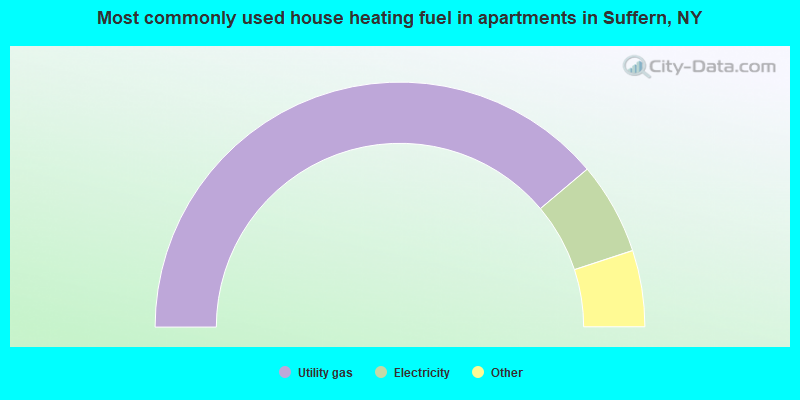
- 77.8%Utility gas
- 12.2%Electricity
- 3.4%Bottled, tank, or LP gas
- 3.1%Fuel oil, kerosene, etc.
- 2.4%No fuel used
- 0.8%Other fuel
- 0.3%Wood
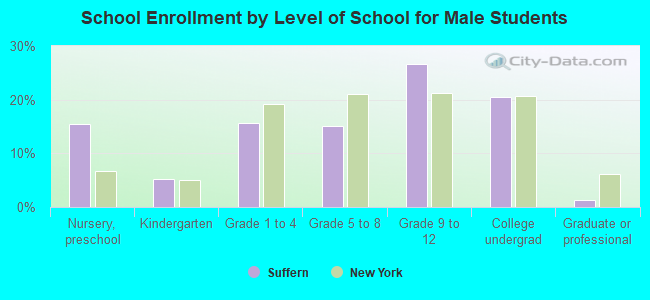
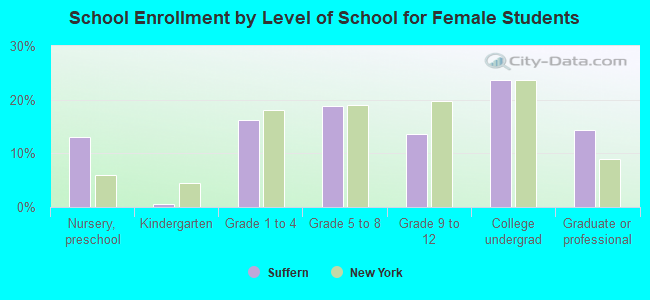
Private vs. public school enrollment:
| Here: | 2.5% |
| New York: | 15.6% |
| Here: | 1.0% |
| New York: | 15.0% |
| Here: | 49.0% |
| New York: | 39.2% |