Sugar Grove, IL (Illinois) Houses and Residents
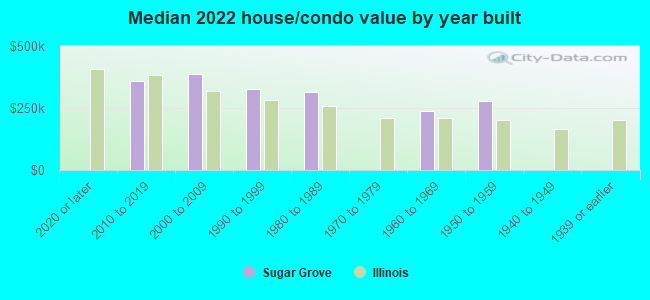
| Sugar Grove: | $360,722 |
| Illinois: | $251,600 |
Total population: 9,192 (Urban population: 3,375, Rural population: 693 (all nonfarm))
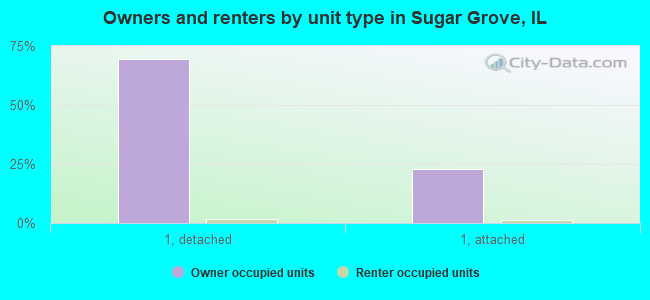
Houses: 3,470 (3,389 occupied: 3,121 owner occupied, 268 renter occupied)
| % of renters here: | 8% |
| State: | 33% |
Housing density: 538 houses/condos per square mile
Median price asked for vacant for-sale houses and condos in 2022 in this county: $350,134.
Median contract rent in 2022: $1,403 (lower quartile is $822, upper quartile is $1,686)
Median gross rent in Sugar Grove, IL in 2022: $1,469
Housing units in Sugar Grove with a mortgage: 1,889 (285 second mortgage, 0 home equity loan, 226 both second mortgage and home equity loan)
Houses without a mortgage: 26
Median household income for houses/condos with a mortgage: $164,502
Median household income for apartments without a mortgage: $84,369
Median monthly housing costs: $1,904
Compare current foreclosures near Sugar Grove, IL:
| Photo | Address | Area | Beds / Baths | Price | Details |
|---|---|---|---|---|---|

|
#1
Pine St
Sugar Grove, IL 60554
|
2,840 sq. feet
|
4 baths 4 beds |
show details | |

|
#2
Brompton Ln # A
Sugar Grove, IL 60554
|
- sq. feet
|
- baths - beds |
show details | |

|
#3
Maple St
Sugar Grove, IL 60554
|
- sq. feet
|
- baths - beds |
show details | |

|
#4
W Galena Blvd, Apt 211
Sugar Grove, IL 60554
|
- sq. feet
|
- baths - beds |
show details | |

|
#5
Terry Dr
Sugar Grove, IL 60554
|
- sq. feet
|
- baths - beds |
show details | |

|
#6
Corron Rd
Elgin, IL 60124
|
3,352 sq. feet
|
3 baths 4 beds |
$685,000
|
show details |

|
#7
Amsterdam Cir
Montgomery, IL 60538
|
2,793 sq. feet
|
2 baths 4 beds |
$459,900
|
show details |

|
#8
Tall Oaks Dr
Aurora, IL 60505
|
685 sq. feet
|
1 baths 1 beds |
$127,000
|
show details |

|
#9
Kathleen Cir
Montgomery, IL 60538
|
920 sq. feet
|
1 baths 2 beds |
$285,000
|
show details |

|
#10
W809 Bending Ln
Elgin, IL 60124
|
4,100 sq. feet
|
3 baths 4 beds |
$589,900
|
show details |
| Photo | Address | Area | Beds / Baths | Price | Details |
|---|---|---|---|---|---|

|
#11
Briargate Cir
Sugar Grove, IL 60554
|
- sq. feet
|
- baths - beds |
show details | |

|
#12
Carmen Rd
Sugar Grove, IL 60554
|
- sq. feet
|
- baths - beds |
show details | |

|
#13
Mossfield Ct
Sugar Grove, IL 60554
|
- sq. feet
|
- baths - beds |
show details | |

|
#14
Mallard Ln # B
Sugar Grove, IL 60554
|
- sq. feet
|
- baths - beds |
show details | |

|
#15
Dorr Dr
Sugar Grove, IL 60554
|
- sq. feet
|
- baths - beds |
show details | |

|
#16
Yolane Dr
Sugar Grove, IL 60554
|
- sq. feet
|
- baths - beds |
show details | |

|
#17
Brookhaven Cir
Sugar Grove, IL 60554
|
- sq. feet
|
- baths - beds |
show details | |

|
#18
Rolling Oaks Rd
Sugar Grove, IL 60554
|
- sq. feet
|
- baths - beds |
show details | |

|
#19
Brookhaven Cir
Sugar Grove, IL 60554
|
- sq. feet
|
- baths - beds |
show details | |

|
#20
Quarry Ridge Cir
Sugar Grove, IL 60554
|
- sq. feet
|
- baths - beds |
show details |
| Photo | Address | Area | Beds / Baths | Price | Details |
|---|---|---|---|---|---|

|
#21
Birchwood Ct
Sugar Grove, IL 60554
|
- sq. feet
|
- baths - beds |
show details | |

|
#22
Westbourne Ave
Sugar Grove, IL 60554
|
- sq. feet
|
- baths - beds |
show details | |

|
#23
Belle Vue Ln
Sugar Grove, IL 60554
|
- sq. feet
|
- baths - beds |
show details | |

|
#24
Farrier Point Lane
Saint Charles, IL 60175
|
- sq. feet
|
3 baths 5 beds |
$561,600
|
show details |

|
#25
Serendipity Dr
Aurora, IL 60504
|
- sq. feet
|
1 baths 3 beds |
$213,200
|
show details |

|
#26
Capista Dr
Plainfield, IL 60544
|
- sq. feet
|
2 baths 4 beds |
$405,600
|
show details |

|
#27
Phelps Ct
Yorkville, IL 60560
|
1,865 sq. feet
|
2 baths 3 beds |
show details | |

|
#28
Cottonwood Dr
Elgin, IL 60123
|
1,751 sq. feet
|
3 baths 3 beds |
show details | |

|
#29
Stoneridge Ct
Yorkville, IL 60560
|
- sq. feet
|
2 baths 3 beds |
show details | |

|
#30
Willoughby Ct Unit D
Yorkville, IL 60560
|
1,590 sq. feet
|
2 baths 3 beds |
show details |
| Photo | Address | Area | Beds / Baths | Price | Details |
|---|---|---|---|---|---|

|
#31
N Shady Ln.
Elgin, IL 60124
|
2,544 sq. feet
|
2 baths 3 beds |
show details | |

|
#32
Bonner Ave
Aurora, IL 60505
|
748 sq. feet
|
1 baths 2 beds |
show details | |

|
#33
Kristen Ct
Plano, IL 60545
|
2,500 sq. feet
|
3 baths 4 beds |
show details | |

|
#34
Foran Ln
Aurora, IL 60506
|
864 sq. feet
|
1 baths 3 beds |
show details | |

|
#35
Tamaira St
Plano, IL 60545
|
2,072 sq. feet
|
2 baths 4 beds |
show details | |

|
#36
Big Rock Ave
Plano, IL 60545
|
2,021 sq. feet
|
2 baths 3 beds |
show details | |

|
#37
Capital Dr
Plainfield, IL 60544
|
2,940 sq. feet
|
2 baths 4 beds |
show details | |

|
#38
Blume Dr
Elgin, IL 60124
|
3,373 sq. feet
|
3 baths 5 beds |
show details | |

|
#39
Laurel Dr
Aurora, IL 60506
|
1,600 sq. feet
|
2 baths 4 beds |
show details | |

|
#40
Hearthstone Ave
Yorkville, IL 60560
|
2,282 sq. feet
|
2 baths 3 beds |
show details |
| Photo | Address | Area | Beds / Baths | Price | Details |
|---|---|---|---|---|---|

|
#41
Kate Dr
Montgomery, IL 60538
|
2,667 sq. feet
|
3 baths 4 beds |
show details | |

|
#42
Breckenridge Cir
Aurora, IL 60504
|
2,250 sq. feet
|
2 baths 4 beds |
show details | |

|
#43
S Cherry St
Somonauk, IL 60552
|
- sq. feet
|
2 baths 3 beds |
show details | |

|
#44
Laurel Ln
Naperville, IL 60540
|
1,612 sq. feet
|
1 baths 4 beds |
show details | |

|
#45
2nd Ave
Aurora, IL 60505
|
864 sq. feet
|
1 baths 3 beds |
show details | |

|
#46
N May St
Aurora, IL 60506
|
822 sq. feet
|
1 baths 2 beds |
show details | |

|
#47
Meadow View Dr
Saint Charles, IL 60175
|
3,560 sq. feet
|
2 baths 4 beds |
show details | |

|
#48
Light Rd Apt 106
Oswego, IL 60543
|
724 sq. feet
|
1 baths 2 beds |
show details | |

|
#49
Grande Poplar Cir
Plainfield, IL 60585
|
3,141 sq. feet
|
3 baths 4 beds |
show details | |

|
Check over 1 million property listings on Foreclosure.com!
|
browse all offers | |||


 | What will happen when houses get their final pick? (9 replies) |
| Sugar Grove - What's the latest? (Hannaford Farms) (10 replies) |
| Suburbs of Suburbs (32 replies) |
| Talk to me about Aurora? (45 replies) |
| River Street Plaza Condos Downtown Aurora??? (16 replies) |
| Why are Oswego homes the lowest priced in the area? (10 replies) |
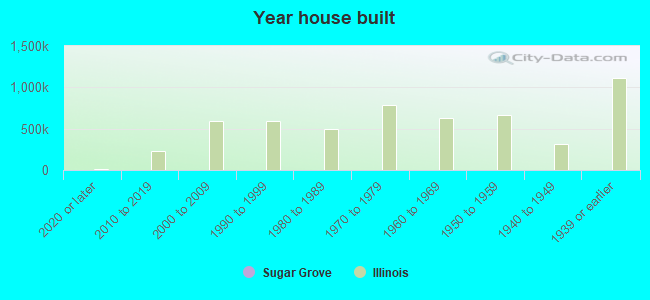
Median year apartment built: 1981
Household type by relationship:
Households: 9,196- Male householders: 1,738 (164 living alone), Female householders: 1,596 (451 living alone)
2,196 spouses (2,196 opposite-sex spouses), 215 unmarried partners, (215 opposite-sex unmarried partners), 2,851 children (2,836 natural, 13 adopted, 1 stepchildren), 238 grandchildren, 0 brothers or sisters, 144 parents, 0 foster children, 201 other relatives, 0 non-relatives
- In group quarters: 11
Size of family households: 1,319 2-persons, 463 3-persons, 820 4-persons, 94 5-persons, 4 6-persons, 65 7-or-more-persons.
Size of nonfamily households: 621 1-person, 66 2-persons.
1,398 married couples with children.
460 single-parent households (190 men, 270 women).
90.1% of residents of Sugar Grove speak English at home.
5.3% of residents speak Spanish at home (95% speak English very well, 5% speak English well).
3.9% of residents speak other Indo-European language at home (79% speak English very well, 16% speak English well, 5% speak English not well).
Foreign born population: 374 (4.1%)
(70.6% of them are naturalized citizens)
| Here: | 7.3 |
| State: | 6.4 |
| Here: | 5.3 |
| State: | 4.1 |
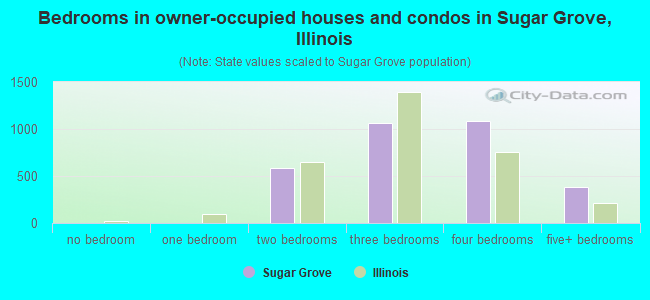
- Bedrooms in owner-occupied houses and condos in Sugar Grove, Illinois
- 0no bedroom
- 01 bedroom
- 5882 bedrooms
- 1,0673 bedrooms
- 1,0874 bedrooms
- 3795+ bedrooms
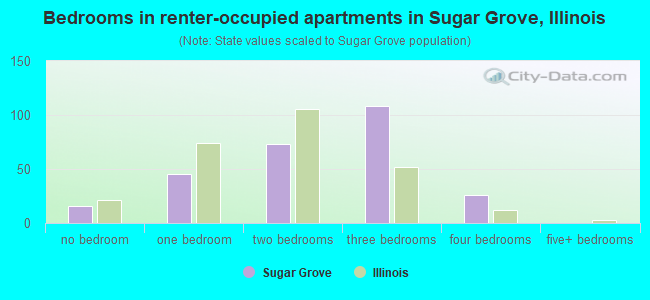
- Bedrooms in renter-occupied apartments in Sugar Grove, Illinois
- 16no bedroom
- 451 bedroom
- 732 bedrooms
- 1083 bedrooms
- 264 bedrooms
- 05+ bedrooms
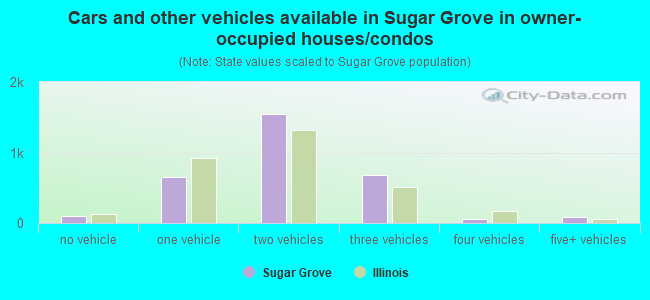
- Cars and other vehicles available in Sugar Grove in owner-occupied houses/condos
- 99no vehicle
- 6531 vehicle
- 1,5442 vehicles
- 6783 vehicles
- 624 vehicles
- 865+ vehicles
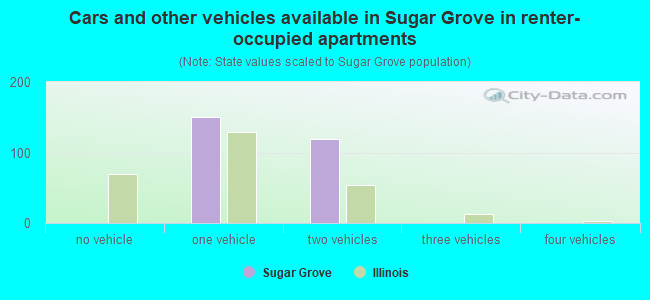
- Cars and other vehicles available in Sugar Grove in renter-occupied apartments
- 0no vehicle
- 1501 vehicle
- 1192 vehicles
- 03 vehicles
- 04 vehicles
- 05+ vehicles
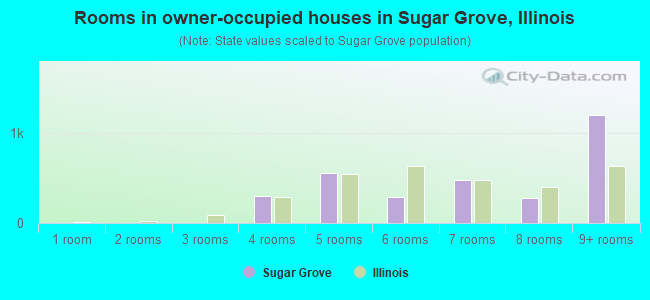
- Rooms in owner-occupied houses in Sugar Grove, Illinois
- 01 room
- 02 rooms
- 03 rooms
- 3054 rooms
- 5565 rooms
- 2906 rooms
- 4807 rooms
- 2848 rooms
- 1,2079+ rooms
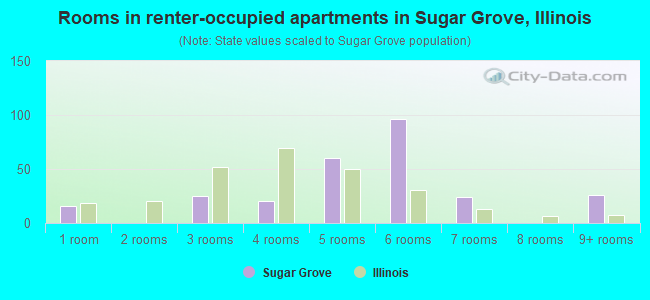
- Rooms in renter-occupied apartments in Sugar Grove, Illinois
- 161 room
- 02 rooms
- 253 rooms
- 204 rooms
- 615 rooms
- 966 rooms
- 247 rooms
- 08 rooms
- 269+ rooms
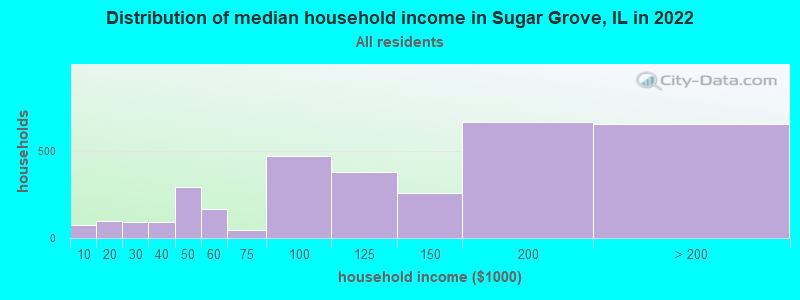
Sugar Grove, IL household income distribution

- 76Less than $10,000
- 98$10,000 to $19,999
- 93$20,000 to $29,999
- 90$30,000 to $39,999
- 294$40,000 to $49,999
- 166$50,000 to $59,999
- 43$60,000 to $74,999
- 472$75,000 to $99,999
- 378$100,000 to $124,999
- 258$125,000 to $149,999
- 664$150,000 to $199,999
- 650$200,000 or more
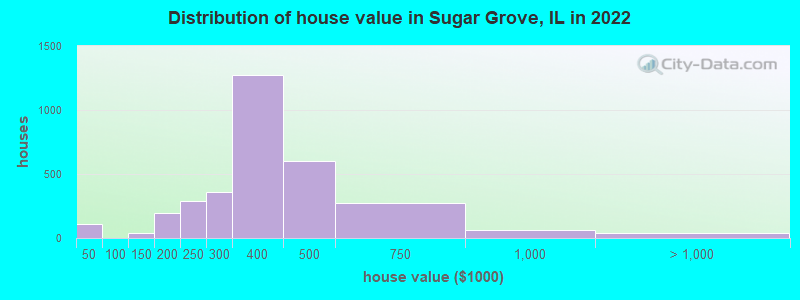
Home value of owner - occupied houses in 2022 in Sugar Grove, IL
-
- 109Less than $10,000
- 38$125,000 to $149,999
- 125$150,000 to $174,999
- 73$175,000 to $199,999
- 286$200,000 to $249,999
- 361$250,000 to $299,999
- 1,275$300,000 to $399,999
- 602$400,000 to $499,999
- 276$500,000 to $749,999
- 62$750,000 to $999,999
- 7$1,000,000 to $1,499,999
- 30$2,000,000 or more
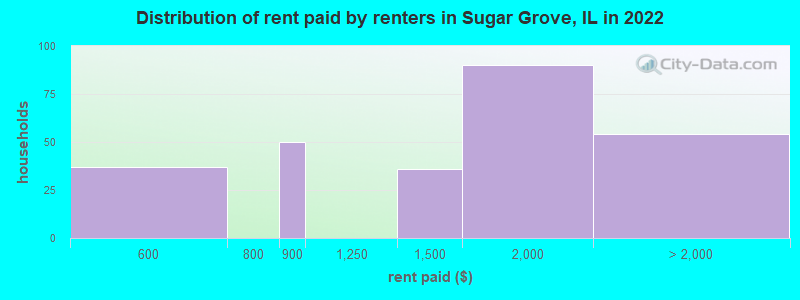
Rent paid by renters in 2022 in Sugar Grove, IL
-
- 28$500 to $549
- 8$550 to $599
- 49$800 to $899
- 36$1,250 to $1,499
- 90$1,500 to $1,999
- 54No cash rent
Percentage of workers working in this county: 58.5%
Number of people working at home: 952 (21.6% of all workers)
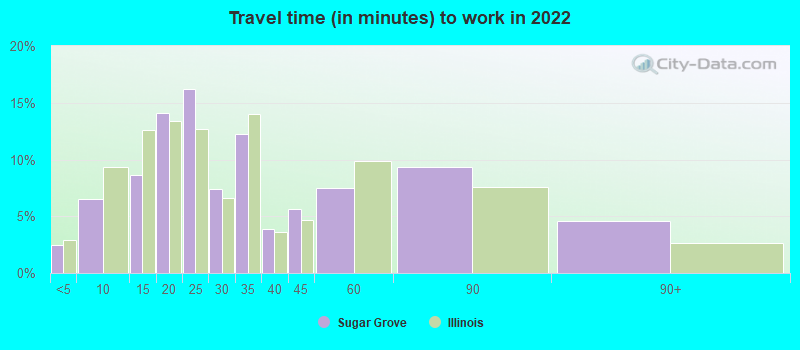
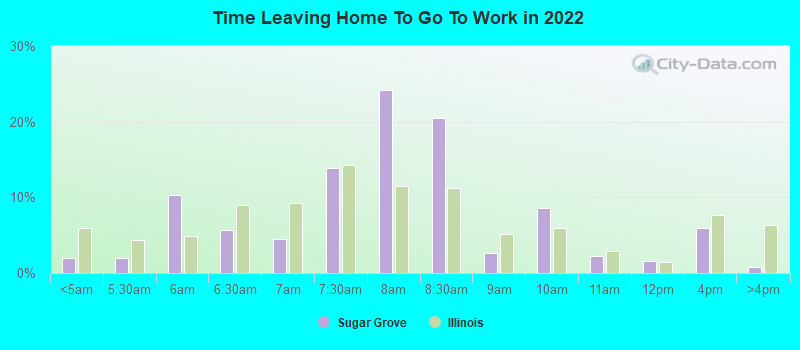
Travel time to work (commute)
- Less than 5 minutes: 27
- 5 to 9 minutes: 182
- 10 to 14 minutes: 347
- 15 to 19 minutes: 564
- 20 to 24 minutes: 262
- 25 to 29 minutes: 429
- 30 to 34 minutes: 640
- 35 to 39 minutes: 210
- 40 to 44 minutes: 296
- 45 to 59 minutes: 169
- 60 to 89 minutes: 280
- 90 or more minutes: 72
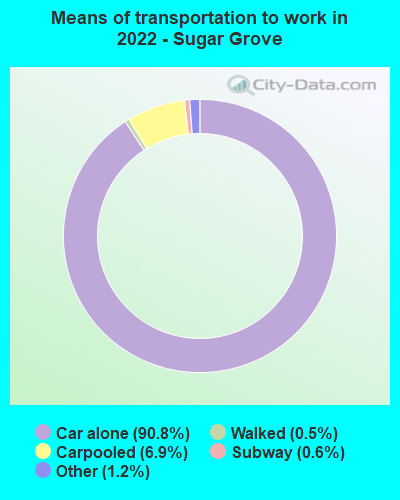
Means of transportation to work:
- Drove a car alone: 2,020 (63.6%)
- Carpooled: 163 (5.1%)
- Long-distance train or commuter rail: 12 (0.4%)
- Taxi: 36 (1.1%)
- Walked: 8 (0.3%)
- Worked at home: 952 (30.0%)
- Unemployment by race in 2022
- Unemployment rate for White non-Hispanic residents
- 2.8%Males
- 2.6%Females
- Unemployment rate for Asian residents
- 49.2%Males
- 21.6%Females
- Unemployment rate for two or more race residents
- 14.3%Females
- Unemployment rate for Hispanic or Latino residents
- 11.8%Females
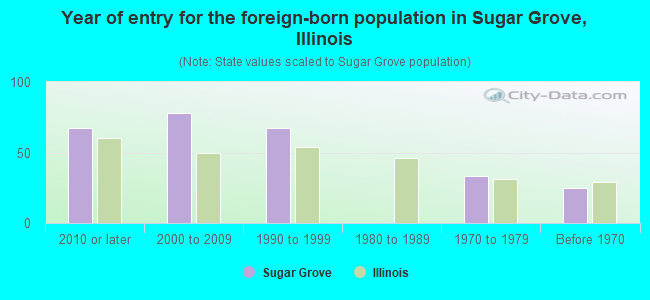
- Year of entry for the foreign-born population in Sugar Grove, Illinois
- 672010 or later
- 782000 to 2009
- 681990 to 1999
- 01980 to 1989
- 331970 to 1979
- 25Before 1970
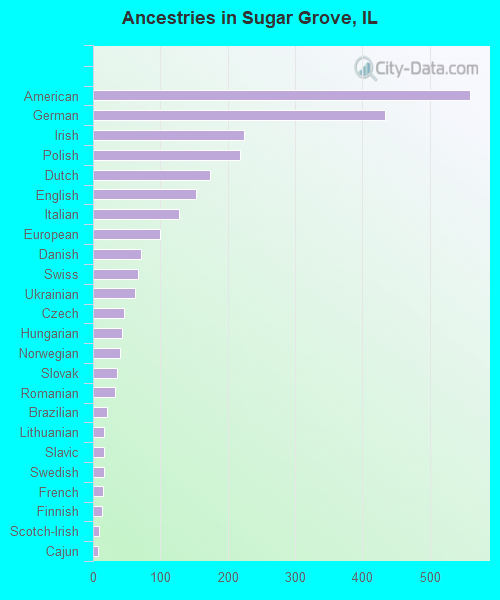
First ancestries reported:
- American: 560 (16.9%)
- German: 433 (13.0%)
- Irish: 224 (6.7%)
- Polish: 218 (6.6%)
- Dutch: 173 (5.2%)
- English: 153 (4.6%)
- Italian: 128 (3.9%)
- European: 99 (3.0%)
- Danish: 71 (2.1%)
- Swiss: 67 (2.0%)
- Ukrainian: 62 (1.9%)
- Czech: 46 (1.4%)
- Hungarian: 43 (1.3%)
- Norwegian: 40 (1.2%)
- Slovak: 36 (1.1%)
- Romanian: 32 (1.0%)
- Brazilian: 21 (0.6%)
- Lithuanian: 17 (0.5%)
- Slavic: 17 (0.5%)
- Swedish: 16 (0.5%)
- French: 15 (0.5%)
- Finnish: 13 (0.4%)
- Scotch-Irish: 9 (0.3%)
- Cajun: 7 (0.2%)
Most common places of birth for foreign-born residents (%):
| Sugar Grove: | 45.1% (164) |
| Illinois: | 34.7% (626,958) |
| Sugar Grove: | 17.6% (64) |
| Illinois: | 1.6% (29,316) |
| Sugar Grove: | 15.9% (58) |
| Illinois: | 9.2% (166,409) |
| Sugar Grove: | 8.0% (29) |
| Illinois: | 0.3% (4,741) |
| Sugar Grove: | 4.4% (16) |
| Illinois: | 1.0% (18,753) |
| Sugar Grove: | 3.6% (13) |
| Illinois: | 0.3% (5,895) |
| Sugar Grove: | 2.7% (10) |
| Illinois: | 0.1% (2,269) |
Place of birth for U.S.-born residents:
- This state: 6,790
- Other state: 1,819
- Northeast: 509
- Midwest: 710
- South: 525
- West: 73
96.1% of Sugar Grove residents lived in the same house 1 years ago.
Out of people who lived in different houses, 24.6% lived in this county.
Out of people who lived in different counties, 91.3% lived in Illinois.
| Sugar Grove: | 96.1% |
| State average: | 88.3% |
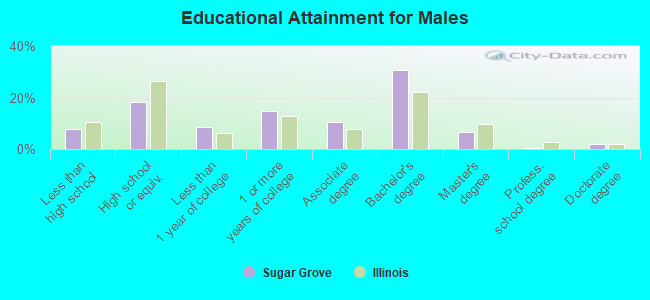
Education attainment for males 25 years and older:
- No schooling: 165
- Nursery to 4th grade: 0
- 5th and 6th grade: 0
- 7th and 8th grade: 0
- 9th grade: 0
- 10th grade: 0
- 11th grade: 0
- 12th grade, no diploma: 80
- High school graduate (or equivalency): 576
- Less than 1 year of college: 270
- Some college more than 1 year, no degree: 465
- Associate degree: 330
- Bachelor's degree: 958
- Master's degree: 210
- Professional school degree: 16
- Doctorate degree: 60
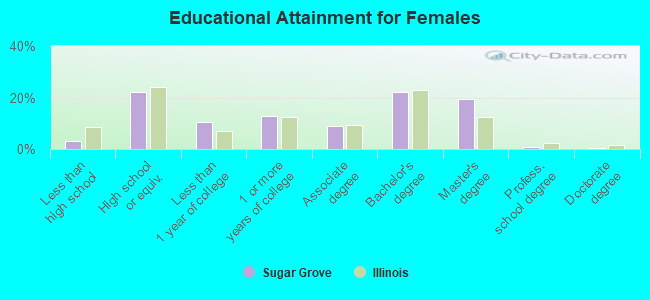
Education attainment for females 25 years and older:
- No schooling: 2
- Nursery to 4th grade: 0
- 5th and 6th grade: 0
- 7th and 8th grade: 0
- 9th grade: 44
- 10th grade: 14
- 11th grade: 34
- 12th grade, no diploma: 0
- High school graduate (or equivalency): 717
- Less than 1 year of college: 341
- Some college more than 1 year, no degree: 407
- Associate degree: 283
- Bachelor's degree: 717
- Master's degree: 625
- Professional school degree: 24
- Doctorate degree: 13
Housing units in structures:
- One, detached: 2,456
- One, attached: 796
- Two: 54
- 3 or 4: 41
- 5 to 9: 16
- 10 to 19: 60
- 20 to 49: 45
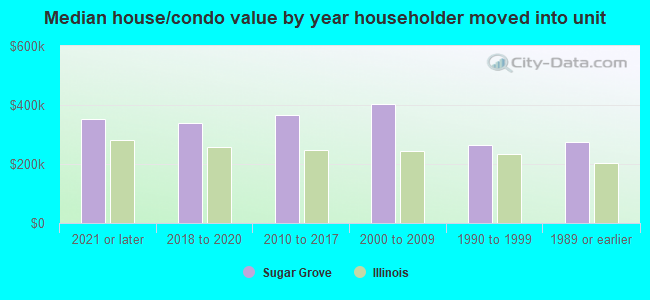
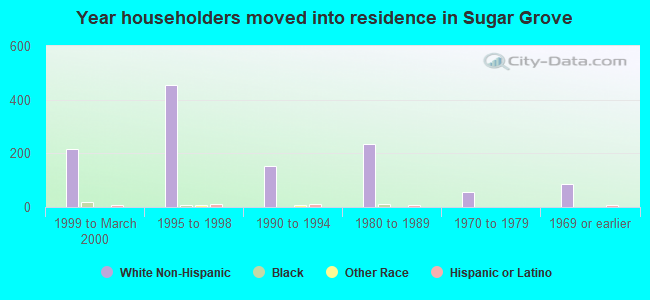
House/condo owner moved in on average 10 years ago
Renter moved in on average 3 years ago
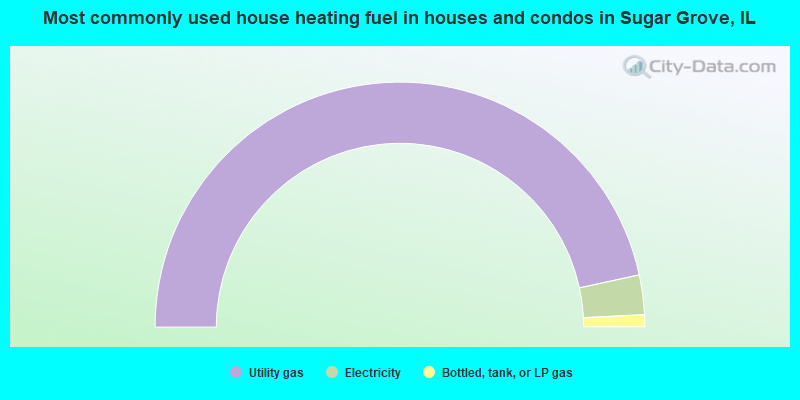
- 93.2%Utility gas
- 5.2%Electricity
- 1.6%Bottled, tank, or LP gas
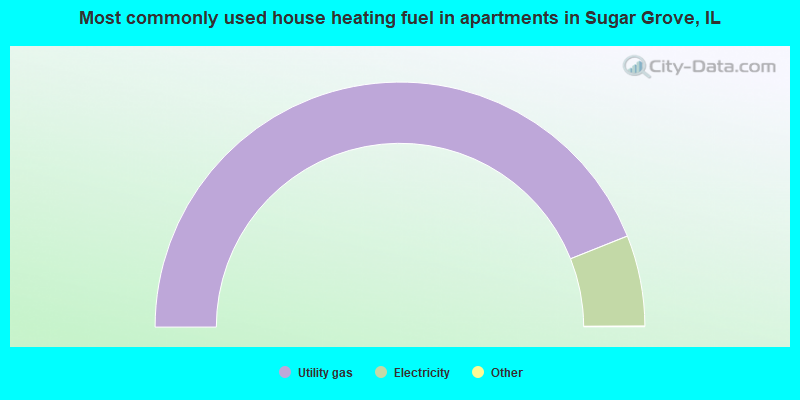
- 88.0%Utility gas
- 12.0%Electricity
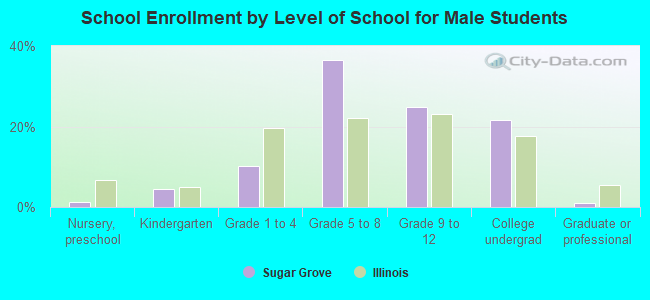
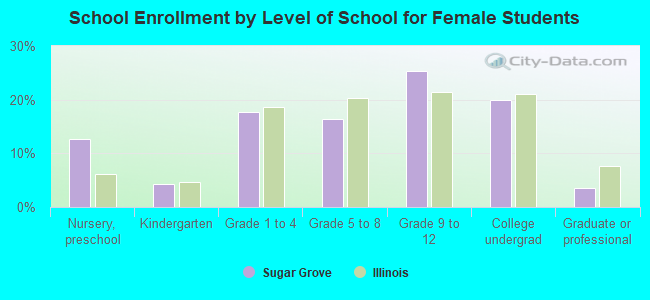
Private vs. public school enrollment:
| Here: | 21.4% |
| Illinois: | 13.3% |
| Here: | 20.9% |
| Illinois: | 9.9% |
| Here: | 3.4% |
| Illinois: | 27.4% |