Sugar Grove, VA (Virginia) Houses and Residents
| Sugar Grove: | $68,448 |
| Virginia: | $365,700 |
Mean price in 2022:
Detached houses: $206,540
Here: $206,540 State: $472,865 Mobile homes: $34,779
Here: $34,779 State: $100,736
Total population: 758 (Urban population: 0, Rural population: 682 (16 farm, 666 nonfarm))
Houses: 415 (324 occupied: 247 owner occupied, 80 renter occupied)
| % of renters here: | 24% |
| State: | 33% |
Housing density: 50 houses/condos per square mile
Median price asked for vacant for-sale houses and condos in 2022 in this county: $476,139.
Median contract rent in 2022: $337 (lower quartile is $240, upper quartile is $550)
Median gross rent in Sugar Grove, VA in 2022: $681
Housing units in Sugar Grove with a mortgage: 168 (5 second mortgage, 0 home equity loan, 4 both second mortgage and home equity loan)
Houses without a mortgage: 0
Median household income for apartments without a mortgage: $60,367
Median monthly housing costs: $485
Compare current foreclosures near Sugar Grove, VA:
| Photo | Address | Area | Beds / Baths | Price | Details |
|---|---|---|---|---|---|

|
#1
Teas Rd
Sugar Grove, VA 24375
|
1,616 sq. feet
|
2 baths 3 beds |
show details | |

|
#2
Teas Rd
Sugar Grove, VA 24375
|
1,189 sq. feet
|
1 baths 3 beds |
show details | |

|
#3
Maple Leaf Ln
Sugar Grove, VA 24375
|
- sq. feet
|
- baths - beds |
show details | |

|
#4
Cedar Springs Rd
Sugar Grove, VA 24375
|
- sq. feet
|
- baths - beds |
show details | |

|
#5
Grayson Tpke
Wytheville, VA 24382
|
1,760 sq. feet
|
1 baths 4 beds |
show details | |

|
#6
Henry St
Marion, VA 24354
|
1,306 sq. feet
|
1 baths 3 beds |
show details | |

|
#7
Seven Mile Ford Rd
Marion, VA 24354
|
846 sq. feet
|
1 baths 2 beds |
show details | |

|
#8
Harris Ln
Marion, VA 24354
|
2,464 sq. feet
|
1 baths 3 beds |
show details | |

|
#9
North Dr
Marion, VA 24354
|
1,160 sq. feet
|
2 baths 3 beds |
show details | |

|
#10
W Coyner Ave
Marion, VA 24354
|
1,405 sq. feet
|
1 baths 4 beds |
show details |
| Photo | Address | Area | Beds / Baths | Price | Details |
|---|---|---|---|---|---|

|
#11
Riverside Rd
Marion, VA 24354
|
1,589 sq. feet
|
1 baths 2 beds |
show details | |

|
#12
Haynes Ave
Chilhowie, VA 24319
|
2,078 sq. feet
|
2 baths 3 beds |
show details | |

|
#13
Overlook Dr
Chilhowie, VA 24319
|
720 sq. feet
|
1 baths 2 beds |
show details | |

|
#14
Windmere Ln
Marion, VA 24354
|
1,713 sq. feet
|
2 baths 3 beds |
show details | |

|
#15
Wassona Dr
Marion, VA 24354
|
1,410 sq. feet
|
1 baths 2 beds |
show details | |

|
#16
Austin Ln
Chilhowie, VA 24319
|
1,404 sq. feet
|
2 baths 3 beds |
show details | |

|
#17
Wet Springs Rd
Chilhowie, VA 24319
|
1,603 sq. feet
|
2 baths 4 beds |
show details | |

|
#18
Davis Valley Rd
Rural Retreat, VA 24368
|
2,356 sq. feet
|
3 baths 4 beds |
show details | |

|
#19
Four Seasons Rd
Rural Retreat, VA 24368
|
- sq. feet
|
- baths - beds |
show details | |

|
#20
Needmore Rd
Chilhowie, VA 24319
|
- sq. feet
|
- baths - beds |
show details |
| Photo | Address | Area | Beds / Baths | Price | Details |
|---|---|---|---|---|---|

|
#21
Saint Clairs Creek Rd
Chilhowie, VA 24319
|
- sq. feet
|
- baths - beds |
show details | |

|
#22
Chaparral Ln
Chilhowie, VA 24319
|
- sq. feet
|
- baths - beds |
show details | |

|
#23
Haven Ridge Rd
Ceres, VA 24318
|
- sq. feet
|
- baths - beds |
show details | |

|
#24
Bonham Ave
Chilhowie, VA 24319
|
- sq. feet
|
- baths - beds |
show details | |

|
#25
Hwy 16
Grassy Creek, NC 28631
|
- sq. feet
|
- baths - beds |
show details | |

|
#26
Circle
Piney Creek, NC 28663
|
- sq. feet
|
- baths - beds |
show details | |

|
#27
Copper Wood Ln
Independence, VA 24348
|
- sq. feet
|
- baths - beds |
show details | |

|
#28
Blake Rd
Marion, VA 24354
|
- sq. feet
|
- baths - beds |
show details | |

|
#29
Grayson Tpke
Wytheville, VA 24382
|
- sq. feet
|
- baths - beds |
show details | |

|
#30
Hilton Ln
Rural Retreat, VA 24368
|
- sq. feet
|
- baths - beds |
show details |
| Photo | Address | Area | Beds / Baths | Price | Details |
|---|---|---|---|---|---|

|
#31
Rocky Hollow Rd
Troutdale, VA 24378
|
- sq. feet
|
- baths - beds |
show details | |

|
#32
Kiawana Rd
Atkins, VA 24311
|
- sq. feet
|
- baths - beds |
show details | |

|
#33
Rocky Hollow Rd
Atkins, VA 24311
|
- sq. feet
|
- baths - beds |
show details | |

|
#34
Rocky Hollow Rd
Atkins, VA 24311
|
- sq. feet
|
- baths - beds |
show details | |

|
#35
E Buck Ave
Rural Retreat, VA 24368
|
- sq. feet
|
- baths - beds |
show details | |

|
#36
Holston Hills Ln
Marion, VA 24354
|
- sq. feet
|
- baths - beds |
show details | |

|
#37
Anderson Ave
Marion, VA 24354
|
- sq. feet
|
- baths - beds |
show details | |

|
#38
Stoney Battery Rd
Marion, VA 24354
|
- sq. feet
|
- baths - beds |
show details | |

|
#39
Citizens Rd
Rural Retreat, VA 24368
|
- sq. feet
|
- baths - beds |
show details | |

|
#40
Parsonage Ave
Rural Retreat, VA 24368
|
- sq. feet
|
- baths - beds |
show details |
| Photo | Address | Area | Beds / Baths | Price | Details |
|---|---|---|---|---|---|

|
#41
Varnelle Ave
Rural Retreat, VA 24368
|
- sq. feet
|
- baths - beds |
show details | |

|
#42
Lee Hwy
Marion, VA 24354
|
- sq. feet
|
- baths - beds |
show details | |

|
#43
Cedar Springs Rd
Rural Retreat, VA 24368
|
- sq. feet
|
- baths - beds |
show details | |

|
#44
Hidden Hollow Ln
Troutdale, VA 24378
|
- sq. feet
|
- baths - beds |
show details | |

|
#45
Big Horse Creek Rd
Lansing, NC 28643
|
- sq. feet
|
- baths - beds |
show details | |

|
#46
Rip Shin Rd
Lansing, NC 28643
|
- sq. feet
|
- baths - beds |
show details | |

|
#47
Allis Chalmer Rd
Rural Retreat, VA 24368
|
- sq. feet
|
- baths - beds |
show details | |

|
Check over 1 million property listings on Foreclosure.com!
|
browse all offers | |||


Median year apartment built: 1969
Household type by relationship:
Households: 727- Male householders: 159 (76 living alone), Female householders: 162 (23 living alone)
117 spouses (117 opposite-sex spouses), 0 unmarried partners, (0 opposite-sex unmarried partners), 253 children (205 natural, 8 adopted, 40 stepchildren), 8 grandchildren, 0 brothers or sisters, 0 parents, 0 foster children, 0 other relatives, 27 non-relatives
Size of family households: 118 2-persons, 62 3-persons, 18 4-persons, 27 6-persons.
Size of nonfamily households: 102 1-person.
79 married couples with children.
111 single-parent households (0 men, 111 women).
99.3% of residents of Sugar Grove speak English at home.
| Here: | 5.3 |
| State: | 7.0 |
| Here: | 4.2 |
| State: | 4.3 |

- Bedrooms in owner-occupied houses and condos in Sugar Grove, Virginia
- 0no bedroom
- 311 bedroom
- 352 bedrooms
- 1823 bedrooms
- 04 bedrooms
- 05+ bedrooms

- Bedrooms in renter-occupied apartments in Sugar Grove, Virginia
- 0no bedroom
- 131 bedroom
- 332 bedrooms
- 343 bedrooms
- 04 bedrooms
- 05+ bedrooms

- Cars and other vehicles available in Sugar Grove in owner-occupied houses/condos
- 31no vehicle
- 701 vehicle
- 612 vehicles
- 523 vehicles
- 04 vehicles
- 345+ vehicles

- Cars and other vehicles available in Sugar Grove in renter-occupied apartments
- 26no vehicle
- 131 vehicle
- 162 vehicles
- 03 vehicles
- 04 vehicles
- 255+ vehicles

- Rooms in owner-occupied houses in Sugar Grove, Virginia
- 01 room
- 312 rooms
- 03 rooms
- 474 rooms
- 585 rooms
- 416 rooms
- 407 rooms
- 168 rooms
- 149+ rooms

- Rooms in renter-occupied apartments in Sugar Grove, Virginia
- 01 room
- 02 rooms
- 73 rooms
- 394 rooms
- 05 rooms
- 96 rooms
- 07 rooms
- 258 rooms
- 09+ rooms


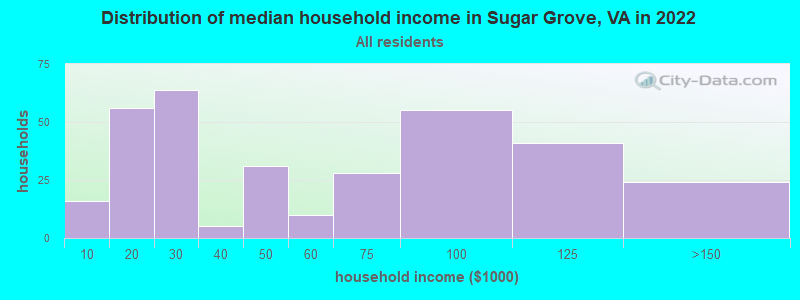
Sugar Grove, VA household income distribution

- 16Less than $10,000
- 56$10,000 to $19,999
- 64$20,000 to $29,999
- 5$30,000 to $39,999
- 31$40,000 to $49,999
- 10$50,000 to $59,999
- 28$60,000 to $74,999
- 55$75,000 to $99,999
- 41$100,000 to $124,999
- 24$125,000 to $149,999
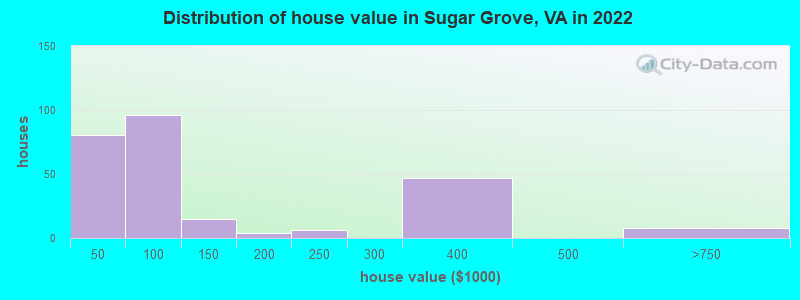
Home value of owner - occupied houses in 2022 in Sugar Grove, VA
-
- 36$10,000 to $14,999
- 22$15,000 to $19,999
- 21$35,000 to $39,999
- 22$50,000 to $59,999
- 64$60,000 to $69,999
- 9$70,000 to $79,999
- 7$100,000 to $124,999
- 6$125,000 to $149,999
- 4$175,000 to $199,999
- 6$200,000 to $249,999
- 47$300,000 to $399,999
- 8$500,000 to $749,999
Rent paid by renters in 2022 in Sugar Grove, VA
-
- 12$200 to $249
- 8$300 to $349
- 4$500 to $549
- 7$600 to $649
- 50No cash rent


Percentage of workers working in this county: 55.0%
Number of people working at home: 43 (14.4% of all workers)
Travel time to work (commute)
- Less than 5 minutes: 5
- 5 to 9 minutes: 32
- 10 to 14 minutes: 9
- 15 to 19 minutes: 7
- 20 to 24 minutes: 0
- 25 to 29 minutes: 40
- 30 to 34 minutes: 19
- 35 to 39 minutes: 0
- 40 to 44 minutes: 39
- 45 to 59 minutes: 38
- 60 to 89 minutes: 24
- 90 or more minutes: 24
Means of transportation to work:
- Drove a car alone: 216 (87.8%)
- Carpooled: 30 (12.2%)

- Unemployment by race in 2022
- Unemployment rate for White non-Hispanic residents
- 19.8%Females
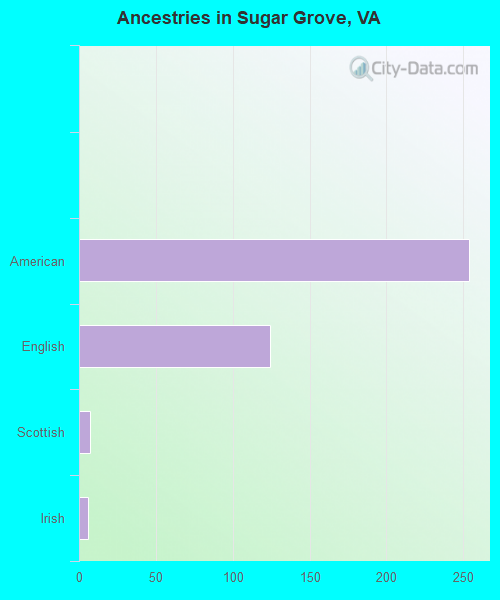
First ancestries reported:
- American: 254 (55.7%)
- English: 124 (27.2%)
- Scottish: 7 (1.5%)
- Irish: 6 (1.3%)
Place of birth for U.S.-born residents:
- This state: 538
- Other state: 185
- Northeast: 19
- Midwest: 0
- South: 165
- West: 0
84.3% of Sugar Grove residents lived in the same house 1 years ago.
Out of people who lived in different houses, 46.2% lived in this county.
Out of people who lived in different counties, 0.0% lived in Virginia.
| Sugar Grove: | 84.3% |
| State average: | 86.6% |
Education attainment for males 25 years and older:
- No schooling: 0
- Nursery to 4th grade: 0
- 5th and 6th grade: 0
- 7th and 8th grade: 23
- 9th grade: 20
- 10th grade: 18
- 11th grade: 17
- 12th grade, no diploma: 34
- High school graduate (or equivalency): 116
- Less than 1 year of college: 0
- Some college more than 1 year, no degree: 8
- Associate degree: 16
- Bachelor's degree: 0
- Master's degree: 0
- Professional school degree: 0
- Doctorate degree: 0

Education attainment for females 25 years and older:
- No schooling: 0
- Nursery to 4th grade: 0
- 5th and 6th grade: 0
- 7th and 8th grade: 0
- 9th grade: 15
- 10th grade: 0
- 11th grade: 5
- 12th grade, no diploma: 0
- High school graduate (or equivalency): 54
- Less than 1 year of college: 29
- Some college more than 1 year, no degree: 24
- Associate degree: 64
- Bachelor's degree: 0
- Master's degree: 25
- Professional school degree: 0
- Doctorate degree: 0


Housing units in structures:
- One, detached: 267
- Mobile homes: 148
Housing units lacking complete kitchen facilities in 2022: 8.6%
House/condo owner moved in on average 15 years ago
Renter moved in on average 6 years ago

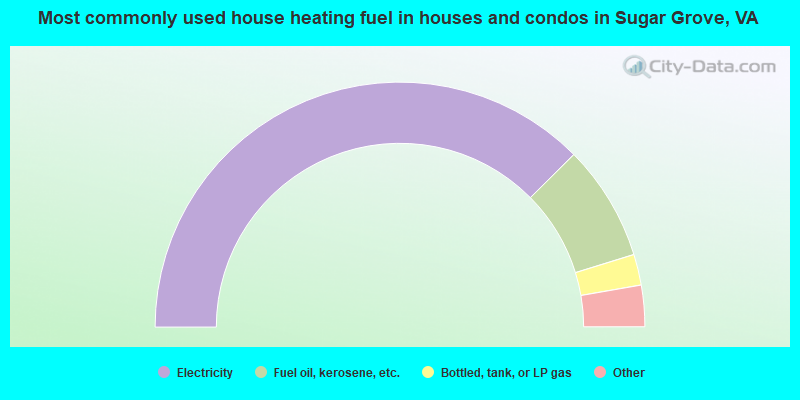
- 75.5%Electricity
- 15.4%Fuel oil, kerosene, etc.
- 4.1%Bottled, tank, or LP gas
- 2.9%Wood
- 2.1%Other fuel
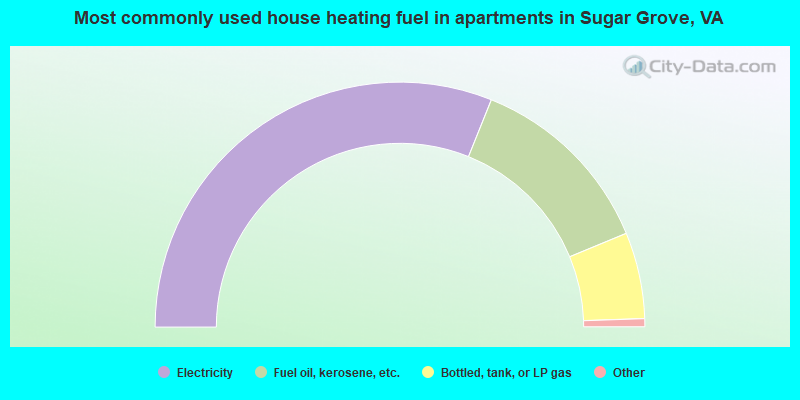
- 62.8%Electricity
- 25.6%Fuel oil, kerosene, etc.
- 11.5%Bottled, tank, or LP gas
Private vs. public school enrollment:
| Here: | 21.6% |
| Virginia: | 13.2% |
| Here: | 0.0% |
| Virginia: | 10.2% |
| Here: | 100.0% |
| Virginia: | 18.7% |


