Summersville, KY (Kentucky) Houses and Residents
| Summersville: | $88,696 |
| Kentucky: | $196,300 |
Total population: 3,080 (Urban population: 0, Rural population: 3,089 (648 farm, 2,441 nonfarm))
Houses: 1,394 (1,229 occupied: 1,033 owner occupied, 196 renter occupied)
| % of renters here: | 16% |
| State: | 31% |
Housing density: 14 houses/condos per square mile
Median price asked for vacant for-sale houses and condos in 2022 in this county: $104,809.
Median contract rent in 2022: $443 (lower quartile is $411, upper quartile is $547)
Median rent asked for vacant for-rent units in 2022: $505
Median gross rent in Summersville, KY in 2022: $706
Housing units in Summersville with a mortgage: 303 (5 second mortgage, 8 home equity loan, 7 both second mortgage and home equity loan)
Houses without a mortgage: 200
Compare current foreclosures near Summersville, KY:
| Photo | Address | Area | Beds / Baths | Price | Details |
|---|---|---|---|---|---|

|
#1
Roachville Ford Rd
Campbellsville, KY 42718
|
1,616 sq. feet
|
2 baths 3 beds |
show details | |

|
#2
Gleanings Rd
New Hope, KY 40052
|
1,632 sq. feet
|
1 baths 2 beds |
show details | |

|
#3
Glendale Rd
Hodgenville, KY 42748
|
1,324 sq. feet
|
1 baths 3 beds |
show details | |

|
#4
Earthborne Ln
Campbellsville, KY 42718
|
1,160 sq. feet
|
1 baths 3 beds |
show details | |

|
#5
Vaughn Ave
Hodgenville, KY 42748
|
1,092 sq. feet
|
1 baths 3 beds |
show details | |

|
#6
Saloma Rd
Campbellsville, KY 42718
|
1,012 sq. feet
|
1 baths 4 beds |
show details | |

|
#7
Leafdale Rd
Hodgenville, KY 42748
|
1,176 sq. feet
|
1 baths 3 beds |
show details | |

|
#8
Wildflower Ln
Campbellsville, KY 42718
|
3,600 sq. feet
|
2 baths 5 beds |
show details | |

|
#9
Hammonsville Rd
Bonnieville, KY 42713
|
1,512 sq. feet
|
2 baths 3 beds |
show details | |

|
#10
New Jackson Hwy
Hodgenville, KY 42748
|
1,815 sq. feet
|
2 baths 3 beds |
show details |
| Photo | Address | Area | Beds / Baths | Price | Details |
|---|---|---|---|---|---|

|
#11
Greensburg Rd
Campbellsville, KY 42718
|
768 sq. feet
|
1 baths 2 beds |
show details | |

|
#12
Carnation St
Campbellsville, KY 42718
|
800 sq. feet
|
1 baths 2 beds |
show details | |

|
#13
Clem Haskins Blvd
Campbellsville, KY 42718
|
1,042 sq. feet
|
1 baths 2 beds |
show details | |

|
#14
Lowell Ave
Campbellsville, KY 42718
|
1,800 sq. feet
|
2 baths 3 beds |
show details | |

|
#15
Greenhill Dr
Campbellsville, KY 42718
|
918 sq. feet
|
1 baths 2 beds |
show details | |

|
#16
Birdwood Dr
Campbellsville, KY 42718
|
1,064 sq. feet
|
1 baths 4 beds |
show details | |

|
#17
Kristi Ln
Campbellsville, KY 42718
|
1,898 sq. feet
|
1 baths 4 beds |
show details | |

|
#18
Pine St
Campbellsville, KY 42718
|
672 sq. feet
|
1 baths 2 beds |
show details | |

|
#19
N Hoskins Ave
Campbellsville, KY 42718
|
1,240 sq. feet
|
2 baths 3 beds |
show details | |

|
#20
N L And N Turnpike Rd
Buffalo, KY 42716
|
988 sq. feet
|
1 baths 2 beds |
show details |
| Photo | Address | Area | Beds / Baths | Price | Details |
|---|---|---|---|---|---|

|
#21
Edmonton Rd
Greensburg, KY 42743
|
1,560 sq. feet
|
1 baths 3 beds |
show details | |

|
#22
S Central Ave
Campbellsville, KY 42718
|
1,430 sq. feet
|
1 baths 3 beds |
show details | |

|
#23
N Jackson Hwy
Magnolia, KY 42757
|
1,334 sq. feet
|
1 baths 3 beds |
show details | |

|
#24
Crissy St
Upton, KY 42784
|
1,490 sq. feet
|
2 baths 3 beds |
show details | |

|
#25
Hardyville Rd
Munfordville, KY 42765
|
1,217 sq. feet
|
1 baths 2 beds |
show details | |

|
#26
Mount Tabor Rd
Buffalo, KY 42716
|
1,248 sq. feet
|
2 baths 3 beds |
show details | |

|
#27
Caple Ave
Hodgenville, KY 42748
|
1,232 sq. feet
|
1 baths 3 beds |
show details | |

|
#28
Mill Rd
Magnolia, KY 42757
|
1,324 sq. feet
|
1 baths 3 beds |
show details | |

|
#29
College St
Hodgenville, KY 42748
|
1,352 sq. feet
|
1 baths - beds |
show details | |

|
#30
Wells Ave
Campbellsville, KY 42718
|
- sq. feet
|
3 baths 5 beds |
show details |
| Photo | Address | Area | Beds / Baths | Price | Details |
|---|---|---|---|---|---|

|
#31
S Central Ave
Campbellsville, KY 42718
|
- sq. feet
|
- baths - beds |
show details | |

|
#32
Lamkin Ln
Raywick, KY 40060
|
- sq. feet
|
- baths - beds |
show details | |

|
#33
Highway 218
Greensburg, KY 42743
|
- sq. feet
|
- baths - beds |
show details | |

|
#34
Squires Ct Apt 5
Campbellsville, KY 42718
|
- sq. feet
|
- baths - beds |
show details | |

|
#35
Howell Cemetary Rd
Center, KY 42214
|
- sq. feet
|
- baths - beds |
show details | |

|
#36
Rose St
Campbellsville, KY 42718
|
- sq. feet
|
- baths - beds |
show details | |

|
#37
Morris Ln
Raywick, KY 40060
|
- sq. feet
|
- baths - beds |
show details | |

|
#38
Roberts Rd
Campbellsville, KY 42718
|
- sq. feet
|
- baths - beds |
show details | |

|
#39
Wexford Pl # 3
Campbellsville, KY 42718
|
- sq. feet
|
- baths - beds |
show details | |

|
#40
Wards Branch Rd
Lebanon, KY 40033
|
- sq. feet
|
- baths - beds |
show details |
| Photo | Address | Area | Beds / Baths | Price | Details |
|---|---|---|---|---|---|

|
#41
Snow Ln
Campbellsville, KY 42718
|
1,368 sq. feet
|
- baths - beds |
show details | |

|
#42
W Forest Ave
Hodgenville, KY 42748
|
- sq. feet
|
- baths - beds |
show details | |

|
#43
Phillips Ln
Hodgenville, KY 42748
|
- sq. feet
|
- baths - beds |
show details | |

|
#44
Reflection Way
Campbellsville, KY 42718
|
- sq. feet
|
- baths - beds |
show details | |

|
#45
Snow Ln
Campbellsville, KY 42718
|
936 sq. feet
|
- baths - beds |
show details | |

|
#46
Campbellsville Rd
Hodgenville, KY 42748
|
- sq. feet
|
- baths - beds |
show details | |

|
#47
Shawnee Dr
Campbellsville, KY 42718
|
1,400 sq. feet
|
- baths - beds |
show details | |

|
#48
Hill St
Hodgenville, KY 42748
|
- sq. feet
|
- baths - beds |
show details | |

|
#49
W Forest Ave
Hodgenville, KY 42748
|
- sq. feet
|
- baths - beds |
show details | |

|
Check over 1 million property listings on Foreclosure.com!
|
browse all offers | |||


Household type by relationship:
Households: 11,145- In family households: 9,547 (2,444 male householders, 780 female householders)
2,598 spouses, 3,035 children (2,765 natural, 57 adopted, 213 stepchildren), 264 grandchildren, 57 brothers or sisters, 58 parents, foster children, 68 other relatives, 199 non-relatives
- In nonfamily households: 1,598 (639 male householders (553 living alone)), 738 female householders (672 living alone)), 221 nonrelatives
- In group quarters: 113 (104 institutionalized population)
1,827 married couples with children.
545 single-parent households (145 men, 400 women).
97.1% of residents of Summersville speak English at home.
0.4% of residents speak Spanish at home (45% speak English very well, 55% speak English well).
2.0% of residents speak other Indo-European language at home (88% speak English very well, 12% speak English well).
0.4% of residents speak Asian or Pacific Island language at home (100% speak English very well).
Foreign born population: 35 (1.1%)
(100.0% of them are naturalized citizens)
| Here: | 6.4 |
| State: | 6.4 |
| Here: | 6.2 |
| State: | 4.4 |

- Bedrooms in owner-occupied houses and condos in Summersville, Kentucky
- 0no bedroom
- 321 bedroom
- 3472 bedrooms
- 5083 bedrooms
- 1334 bedrooms
- 135+ bedrooms

- Bedrooms in renter-occupied apartments in Summersville, Kentucky
- 0no bedroom
- 201 bedroom
- 652 bedrooms
- 813 bedrooms
- 234 bedrooms
- 75+ bedrooms

- Cars and other vehicles available in Summersville in owner-occupied houses/condos
- 54no vehicle
- 2891 vehicle
- 4512 vehicles
- 1653 vehicles
- 434 vehicles
- 315+ vehicles

- Cars and other vehicles available in Summersville in renter-occupied apartments
- 21no vehicle
- 671 vehicle
- 782 vehicles
- 233 vehicles
- 74 vehicles
- 05+ vehicles

- Rooms in owner-occupied houses in Summersville, Kentucky
- 01 room
- 72 rooms
- 93 rooms
- 2244 rooms
- 3235 rooms
- 2276 rooms
- 1807 rooms
- 178 rooms
- 469+ rooms

- Rooms in renter-occupied apartments in Summersville, Kentucky
- 01 room
- 72 rooms
- 153 rooms
- 434 rooms
- 425 rooms
- 576 rooms
- 257 rooms
- 78 rooms
- 09+ rooms


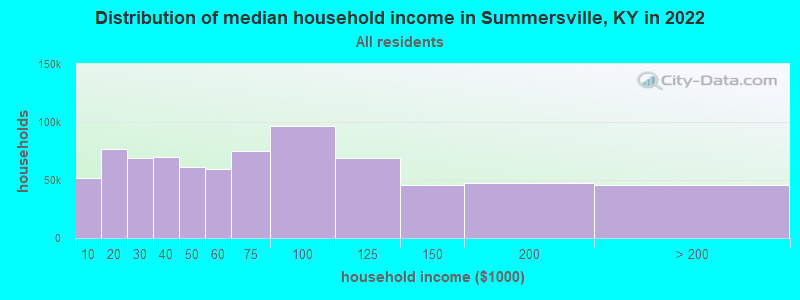
Summersville, KY household income distribution

- 45,055Less than $10,000
- 73,097$10,000 to $19,999
- 61,595$20,000 to $29,999
- 65,258$30,000 to $39,999
- 49,868$40,000 to $49,999
- 54,788$50,000 to $59,999
- 62,854$60,000 to $74,999
- 87,107$75,000 to $99,999
- 62,248$100,000 to $124,999
- 38,194$125,000 to $149,999
- 37,854$150,000 to $199,999
- 32,542$200,000 or more
Percentage of workers working in this county: 41.6%
Number of people working at home: 118 (8.5% of all workers)
Travel time to work (commute)
- Less than 5 minutes: 12
- 5 to 9 minutes: 58
- 10 to 14 minutes: 93
- 15 to 19 minutes: 232
- 20 to 24 minutes: 171
- 25 to 29 minutes: 55
- 30 to 34 minutes: 183
- 35 to 39 minutes: 27
- 40 to 44 minutes: 47
- 45 to 59 minutes: 206
- 60 to 89 minutes: 78
- 90 or more minutes: 73
Means of transportation to work:
- Drove a car alone: 1,043 (78.3%)
- Carpooled: 157 (11.8%)
- Bus or trolley bus: 6 (0.5%)
- Walked: 24 (1.8%)
- Other means: 5 (0.4%)
- Worked at home: 97 (7.3%)


- Year of entry for the foreign-born population in Summersville, Kentucky
- 01995 to March 2000
- 01990 to 1994
- 101985 to 1989
- 01980 to 1984
- 01975 to 1979
- 01970 to 1974
- 01965 to 1969
- 10Before 1965
Most common places of birth for foreign-born residents (%):
| Summersville: | 50.0% (10) |
| Kentucky: | 8.3% (6,658) |
| Summersville: | 50.0% (10) |
| Kentucky: | 0.3% (216) |
Place of birth for U.S.-born residents:
- This state: 2,699
- Other state: 348
- Northeast: 38
- Midwest: 149
- South: 141
- West: 20
68% of Summersville residents lived in the same house 5 years ago.
Out of people who lived in different houses, 47% lived in this county.
Out of people who lived in different counties, 60% lived in Kentucky.
Education attainment for males 25 years and older:
- No schooling: 15
- Nursery to 4th grade: 41
- 5th and 6th grade: 47
- 7th and 8th grade: 210
- 9th grade: 28
- 10th grade: 31
- 11th grade: 41
- 12th grade, no diploma: 51
- High school graduate (or equivalency): 434
- Less than 1 year of college: 26
- Some college more than 1 year, no degree: 64
- Associate degree: 18
- Bachelor's degree: 36
- Master's degree: 13
- Professional school degree: 7
- Doctorate degree: 0

Education attainment for females 25 years and older:
- No schooling: 20
- Nursery to 4th grade: 21
- 5th and 6th grade: 33
- 7th and 8th grade: 154
- 9th grade: 43
- 10th grade: 59
- 11th grade: 22
- 12th grade, no diploma: 26
- High school graduate (or equivalency): 434
- Less than 1 year of college: 60
- Some college more than 1 year, no degree: 87
- Associate degree: 28
- Bachelor's degree: 43
- Master's degree: 16
- Professional school degree: 0
- Doctorate degree: 0


Housing units in structures:
- One, detached: 1,036
- Two: 10
- 3 or 4: 5
- Mobile homes: 339
- Boats, RVs, vans, etc.: 4
Median worth of mobile homes: $54,241
Housing units lacking complete kitchen facilities: 5.7%

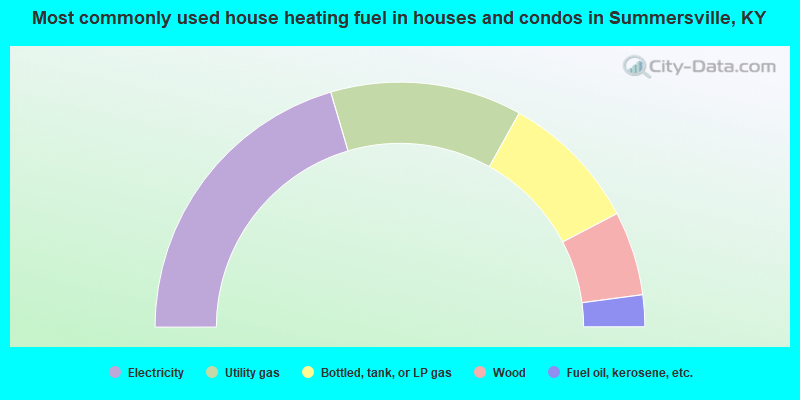
- 40.9%Electricity
- 25.3%Utility gas
- 18.5%Bottled, tank, or LP gas
- 11.1%Wood
- 4.2%Fuel oil, kerosene, etc.
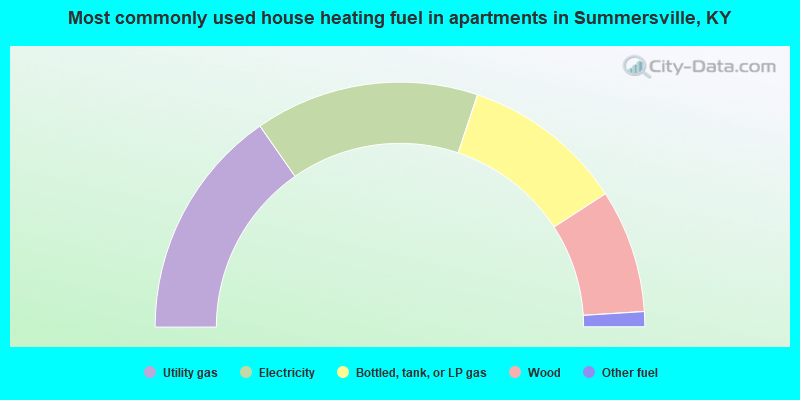
- 30.6%Utility gas
- 29.6%Electricity
- 21.4%Bottled, tank, or LP gas
- 16.3%Wood
- 2.0%Other fuel
Private vs. public school enrollment:
| Here: | 11.4% |
| Kentucky: | 11.9% |
| Here: | 2.3% |
| Kentucky: | 10.6% |
| Here: | 26.8% |
| Kentucky: | 18.1% |


