Sunnyvale, TX (Texas) Houses and Residents
| Sunnyvale: | $584,894 |
| Texas: | $275,400 |
Mean price in 2022:
Detached houses: $634,968
Here: $634,968 State: $369,058
Total population: 5,766 (Urban population: 1,107, Rural population: 1,575 (62 farm, 1,513 nonfarm))
Houses: 2,753 (2,682 occupied: 2,296 owner occupied, 420 renter occupied)
| % of renters here: | 15% |
| State: | 38% |
Housing density: 164 houses/condos per square mile
Median price asked for vacant for-sale houses and condos in 2022 in this county: $388,785.
Median contract rent in 2022: $923 (lower quartile is $833, upper quartile is $1,027)
Median gross rent in Sunnyvale, TX in 2022: $1,041
Housing units in Sunnyvale with a mortgage: 1,634 (33 second mortgage, 0 home equity loan, 36 both second mortgage and home equity loan)
Houses without a mortgage: 0
Median household income for houses/condos with a mortgage: $179,396
Median household income for apartments without a mortgage: $199,303
Median monthly housing costs: $2,664
Compare current foreclosures near Sunnyvale, TX:
| Photo | Address | Area | Beds / Baths | Price | Details |
|---|---|---|---|---|---|

|
#1
Benwick Dr
Sunnyvale, TX 75182
|
- sq. feet
|
- baths - beds |
show details | |

|
#2
Barnes Bridge Rd
Sunnyvale, TX 75182
|
- sq. feet
|
- baths - beds |
show details | |

|
#3
Benwick Dr
Sunnyvale, TX 75182
|
- sq. feet
|
- baths - beds |
show details | |

|
#4
Planters Rd Apt 24c
Sunnyvale, TX 75182
|
- sq. feet
|
- baths - beds |
show details | |

|
#5
Tavistock Road
Forney, TX 75126
|
2,857 sq. feet
|
2 baths 4 beds |
$354,900
|
show details |

|
#6
Straits Dr
Rowlett, TX 75088
|
1,690 sq. feet
|
2 baths 3 beds |
show details | |

|
#7
Audelia Rd Apt
Dallas, TX 75243
|
- sq. feet
|
1 baths 2 beds |
show details | |

|
#8
Lewiston Ave
Dallas, TX 75227
|
1,288 sq. feet
|
1 baths 3 beds |
show details | |

|
#9
Bonita Dr # 4
Garland, TX 75041
|
1,350 sq. feet
|
2 baths 2 beds |
show details | |

|
#10
Fairfield Dr
Rowlett, TX 75089
|
1,693 sq. feet
|
2 baths 4 beds |
show details |
| Photo | Address | Area | Beds / Baths | Price | Details |
|---|---|---|---|---|---|

|
#11
Main St
Dallas, TX 75202
|
- sq. feet
|
1 baths 1 beds |
show details | |

|
#12
Alaska Ave
Dallas, TX 75216
|
1,326 sq. feet
|
3 baths 3 beds |
show details | |

|
#13
Novel Dr
Garland, TX 75040
|
2,035 sq. feet
|
2 baths 3 beds |
show details | |

|
#14
Cardinal Dr
Forney, TX 75126
|
3,661 sq. feet
|
3 baths 5 beds |
show details | |

|
#15
Susan Dr
Mesquite, TX 75150
|
1,493 sq. feet
|
1 baths 3 beds |
show details | |

|
#16
Holland Ave Apt 11
Dallas, TX 75219
|
1,155 sq. feet
|
3 baths 2 beds |
show details | |

|
#17
Gayle Dr
Garland, TX 75044
|
1,877 sq. feet
|
3 baths 3 beds |
show details | |

|
#18
Hidden Creek Rd
Garland, TX 75043
|
- sq. feet
|
2 baths 4 beds |
show details | |

|
#19
Pleasant Vista Dr
Dallas, TX 75217
|
1,026 sq. feet
|
1 baths 2 beds |
show details | |

|
#20
Rocky Mountain Dr
Royse City, TX 75189
|
- sq. feet
|
2 baths 3 beds |
show details |
| Photo | Address | Area | Beds / Baths | Price | Details |
|---|---|---|---|---|---|

|
#21
Day St
Dallas, TX 75227
|
1,040 sq. feet
|
1 baths 2 beds |
show details | |

|
#22
Prairie Lakes Ln
Forney, TX 75126
|
2,854 sq. feet
|
3 baths 4 beds |
show details | |

|
#23
Skillman St Apt 1005
Dallas, TX 75231
|
569 sq. feet
|
1 baths 1 beds |
show details | |

|
#24
Desdemona Dr
Dallas, TX 75228
|
981 sq. feet
|
1 baths 3 beds |
show details | |

|
#25
Iowa Ave
Dallas, TX 75216
|
1,512 sq. feet
|
1 baths 3 beds |
show details | |

|
#26
Clear Springs Dr
Forney, TX 75126
|
- sq. feet
|
2 baths 3 beds |
show details | |

|
#27
Lily Lane
Forney, TX 75126
|
- sq. feet
|
3 baths 4 beds |
show details | |

|
#28
Clear Springs Dr
Forney, TX 75126
|
1,654 sq. feet
|
2 baths 3 beds |
show details | |

|
#29
W Celeste Dr
Garland, TX 75041
|
1,041 sq. feet
|
2 baths 3 beds |
show details | |

|
#30
Lauder Ln
Dallas, TX 75248
|
2,027 sq. feet
|
3 baths 3 beds |
show details |
| Photo | Address | Area | Beds / Baths | Price | Details |
|---|---|---|---|---|---|

|
#31
Devonshire Ln
Wylie, TX 75098
|
1,412 sq. feet
|
2 baths 3 beds |
show details | |

|
#32
Cumberland Trl
Mesquite, TX 75181
|
1,864 sq. feet
|
2 baths 3 beds |
show details | |

|
#33
Cedar Springs Rd Apt 105
Dallas, TX 75219
|
665 sq. feet
|
1 baths 1 beds |
show details | |

|
#34
Broken Bow Rd
Dallas, TX 75238
|
1,866 sq. feet
|
2 baths 3 beds |
show details | |

|
#35
Woodford Dr
Forney, TX 75126
|
- sq. feet
|
2 baths 4 beds |
show details | |

|
#36
Hustead St
Dallas, TX 75217
|
1,013 sq. feet
|
2 baths 3 beds |
show details | |

|
#37
Knoxbridge Rd
Forney, TX 75126
|
- sq. feet
|
3 baths 4 beds |
show details | |

|
#38
Rollingwood Dr
Richardson, TX 75081
|
1,905 sq. feet
|
2 baths 4 beds |
show details | |

|
#39
Bradford Dr Apt 4721b
Dallas, TX 75219
|
986 sq. feet
|
1 baths 2 beds |
show details | |

|
#40
Wolfwood Ln
Dallas, TX 75217
|
1,346 sq. feet
|
2 baths 3 beds |
show details |
| Photo | Address | Area | Beds / Baths | Price | Details |
|---|---|---|---|---|---|

|
#41
Kushla Ave
Dallas, TX 75216
|
1,149 sq. feet
|
1 baths 3 beds |
show details | |

|
#42
Brunswick Ln
Mesquite, TX 75149
|
1,290 sq. feet
|
1 baths 3 beds |
show details | |

|
#43
Elsie Faye Heggins Street
Dallas, TX 75210
|
1,945 sq. feet
|
3 baths 5 beds |
show details | |

|
#44
Rochdale St
Garland, TX 75040
|
2,238 sq. feet
|
3 baths 4 beds |
show details | |

|
#45
Cameron Way
Mesquite, TX 75181
|
2,131 sq. feet
|
2 baths 4 beds |
show details | |

|
#46
Wrangler Way
Dallas, TX 75253
|
- sq. feet
|
2 baths 3 beds |
show details | |

|
#47
Garden Ln
Dallas, TX 75210
|
- sq. feet
|
2 baths 2 beds |
show details | |

|
#48
Van Dyke Rd
Dallas, TX 75218
|
1,544 sq. feet
|
2 baths 2 beds |
show details | |

|
#49
Oak Dale Rd
Dallas, TX 75241
|
1,120 sq. feet
|
2 baths 3 beds |
show details | |

|
Check over 1 million property listings on Foreclosure.com!
|
browse all offers | |||

Latest news about housing in Sunnyvale, TX collected exclusively by city-data.com from local newspapers, TV, and radio stations

 | Affordable Housing : Winds of change in Plano (45 replies) |
| Standard Pacific Homes - Sunnyvale (3 replies) |
| Working at Big Baylor Dallas and Thinking of Sunnyvale... (21 replies) |
| Moving from Wisconsin/ Guatemala. Need advice on house rental and areas? (4 replies) |
| Historic homes, large lots: Can I find any in N. Dallas cities? (27 replies) |
| Apartments in Sunnyvale? (2 replies) |

Median year apartment built: 2013
Household type by relationship:
Households: 7,863- Male householders: 1,446 (56 living alone), Female householders: 1,174 (84 living alone)
1,987 spouses (1,971 opposite-sex spouses), 73 unmarried partners, (67 opposite-sex unmarried partners), 2,915 children (2,783 natural, 20 adopted, 110 stepchildren), 27 grandchildren, 9 brothers or sisters, 73 parents, 0 foster children, 96 other relatives, 56 non-relatives
Size of family households: 1,083 2-persons, 563 3-persons, 619 4-persons, 153 5-persons, 59 6-persons, 20 7-or-more-persons.
Size of nonfamily households: 151 1-person, 21 2-persons.
1,699 married couples with children.
357 single-parent households (41 men, 316 women).
78.3% of residents of Sunnyvale speak English at home.
3.5% of residents speak Spanish at home (83% speak English very well, 17% speak English not well).
3.9% of residents speak other Indo-European language at home (97% speak English very well, 3% speak English not well).
15.3% of residents speak Asian or Pacific Island language at home (87% speak English very well, 10% speak English well, 4% speak English not well).
Foreign born population: 1,349 (17.2%)
(85.8% of them are naturalized citizens)
| Here: | 10.0 |
| State: | 6.3 |
| Here: | 4.9 |
| State: | 4.0 |

- Bedrooms in owner-occupied houses and condos in Sunnyvale, Texas
- 12no bedroom
- 01 bedroom
- 92 bedrooms
- 4493 bedrooms
- 1,2494 bedrooms
- 5775+ bedrooms

- Bedrooms in renter-occupied apartments in Sunnyvale, Texas
- 0no bedroom
- 01 bedroom
- 3472 bedrooms
- 03 bedrooms
- 374 bedrooms
- 365+ bedrooms

- Cars and other vehicles available in Sunnyvale in owner-occupied houses/condos
- 28no vehicle
- 1751 vehicle
- 1,0702 vehicles
- 6193 vehicles
- 2924 vehicles
- 1125+ vehicles

- Cars and other vehicles available in Sunnyvale in renter-occupied apartments
- 120no vehicle
- 2271 vehicle
- 02 vehicles
- 373 vehicles
- 04 vehicles
- 365+ vehicles

- Rooms in owner-occupied houses in Sunnyvale, Texas
- 121 room
- 02 rooms
- 03 rooms
- 04 rooms
- 355 rooms
- 2286 rooms
- 3907 rooms
- 2748 rooms
- 1,3569+ rooms

- Rooms in renter-occupied apartments in Sunnyvale, Texas
- 01 room
- 02 rooms
- 03 rooms
- 1204 rooms
- 2405 rooms
- 246 rooms
- 07 rooms
- 08 rooms
- 369+ rooms


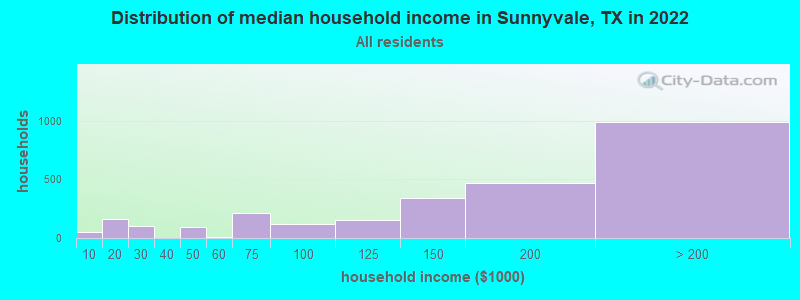
Sunnyvale, TX household income distribution

- 55Less than $10,000
- 159$10,000 to $19,999
- 106$20,000 to $29,999
- 98$40,000 to $49,999
- 11$50,000 to $59,999
- 217$60,000 to $74,999
- 123$75,000 to $99,999
- 158$100,000 to $124,999
- 344$125,000 to $149,999
- 473$150,000 to $199,999
- 991$200,000 or more
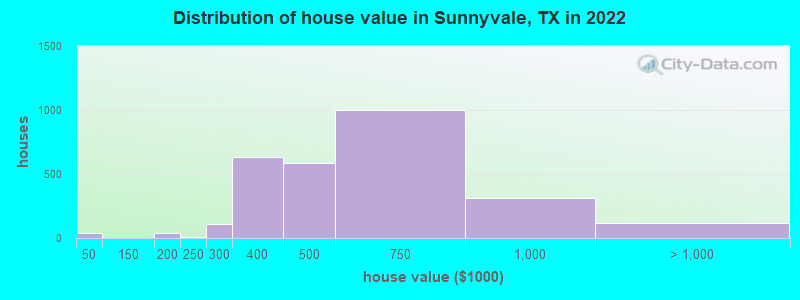
Home value of owner - occupied houses in 2022 in Sunnyvale, TX
-
- 36Less than $10,000
- 29$150,000 to $174,999
- 10$175,000 to $199,999
- 10$200,000 to $249,999
- 106$250,000 to $299,999
- 634$300,000 to $399,999
- 583$400,000 to $499,999
- 997$500,000 to $749,999
- 314$750,000 to $999,999
- 103$1,000,000 to $1,499,999
- 17$1,500,000 to $1,999,999
Rent paid by renters in 2022 in Sunnyvale, TX
-
- 66$400 to $449
- 120$800 to $899
- 101$900 to $999
- 13$1,250 to $1,499
- 27$2,000 to $2,499
- 37No cash rent


Percentage of workers working in this county: 86.3%
Number of people working at home: 628 (15.4% of all workers)
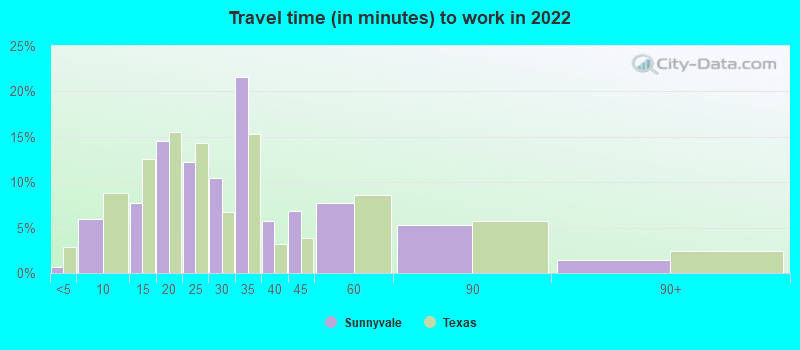
Travel time to work (commute)
- Less than 5 minutes: 0
- 5 to 9 minutes: 70
- 10 to 14 minutes: 177
- 15 to 19 minutes: 427
- 20 to 24 minutes: 496
- 25 to 29 minutes: 162
- 30 to 34 minutes: 683
- 35 to 39 minutes: 486
- 40 to 44 minutes: 196
- 45 to 59 minutes: 479
- 60 to 89 minutes: 236
- 90 or more minutes: 7
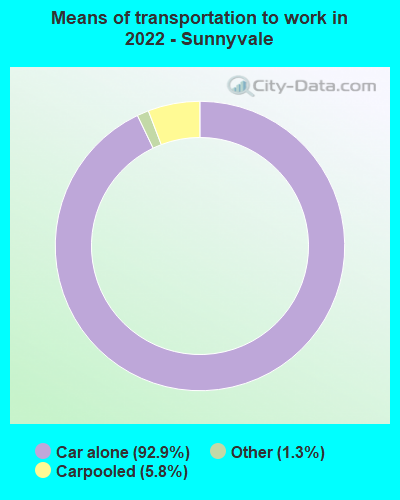
Means of transportation to work:
- Drove a car alone: 4,773 (82.3%)
- Carpooled: 304 (5.2%)
- Taxi: 85 (1.5%)
- Worked at home: 628 (10.8%)

- Unemployment by race in 2022
- Unemployment rate for White non-Hispanic residents
- 1.1%Males
- 0.9%Females
- Unemployment rate for Black residents
- 75.5%Males
- Unemployment rate for Asian residents
- 6.4%Males
- 3.8%Females

- Year of entry for the foreign-born population in Sunnyvale, Texas
- 2822010 or later
- 4522000 to 2009
- 2261990 to 1999
- 01980 to 1989
- 361970 to 1979
- 0Before 1970

First ancestries reported:
- American: 570 (13.9%)
- English: 411 (10.0%)
- Irish: 148 (3.6%)
- Northern European: 130 (3.2%)
- German: 102 (2.5%)
- Welsh: 71 (1.7%)
- Dutch: 62 (1.5%)
- Scottish: 57 (1.4%)
- Italian: 56 (1.4%)
- French: 38 (0.9%)
- British: 22 (0.5%)
- Cajun: 18 (0.4%)
- Iraqi: 8 (0.2%)
- European: 7 (0.2%)
- Scotch-Irish: 7 (0.2%)
Most common places of birth for foreign-born residents (%):
| Sunnyvale: | 78.2% (1,110) |
| Texas: | 6.1% (306,347) |
| Sunnyvale: | 4.9% (69) |
| Texas: | 3.7% (184,770) |
| Sunnyvale: | 4.7% (66) |
| Texas: | 0.5% (26,969) |
| Sunnyvale: | 4.0% (57) |
| Texas: | 4.5% (224,455) |
| Sunnyvale: | 2.9% (41) |
| Texas: | 0.1% (5,595) |
| Sunnyvale: | 2.5% (35) |
| Texas: | 0.2% (11,402) |
| Sunnyvale: | 2.0% (28) |
| Texas: | 2.3% (115,558) |
| Sunnyvale: | 1.7% (24) |
| Texas: | 0.1% (2,502) |
Place of birth for U.S.-born residents:
- This state: 4,893
- Other state: 1,591
- Northeast: 219
- Midwest: 309
- South: 549
- West: 519
91.5% of Sunnyvale residents lived in the same house 1 years ago.
Out of people who lived in different houses, 37.3% lived in this county.
Out of people who lived in different counties, 97.0% lived in Texas.
| Sunnyvale: | 91.5% |
| State average: | 85.7% |
Education attainment for males 25 years and older:
- No schooling: 37
- Nursery to 4th grade: 0
- 5th and 6th grade: 0
- 7th and 8th grade: 27
- 9th grade: 0
- 10th grade: 0
- 11th grade: 14
- 12th grade, no diploma: 9
- High school graduate (or equivalency): 236
- Less than 1 year of college: 85
- Some college more than 1 year, no degree: 193
- Associate degree: 198
- Bachelor's degree: 1,052
- Master's degree: 527
- Professional school degree: 130
- Doctorate degree: 100

Education attainment for females 25 years and older:
- No schooling: 10
- Nursery to 4th grade: 11
- 5th and 6th grade: 0
- 7th and 8th grade: 0
- 9th grade: 32
- 10th grade: 35
- 11th grade: 0
- 12th grade, no diploma: 8
- High school graduate (or equivalency): 487
- Less than 1 year of college: 238
- Some college more than 1 year, no degree: 238
- Associate degree: 178
- Bachelor's degree: 709
- Master's degree: 575
- Professional school degree: 139
- Doctorate degree: 19


Housing units in structures:
- One, detached: 2,443
- Two: 118
- 3 or 4: 86
- 20 to 49: 104
House/condo owner moved in on average 9 years ago
Renter moved in on average 7 years ago

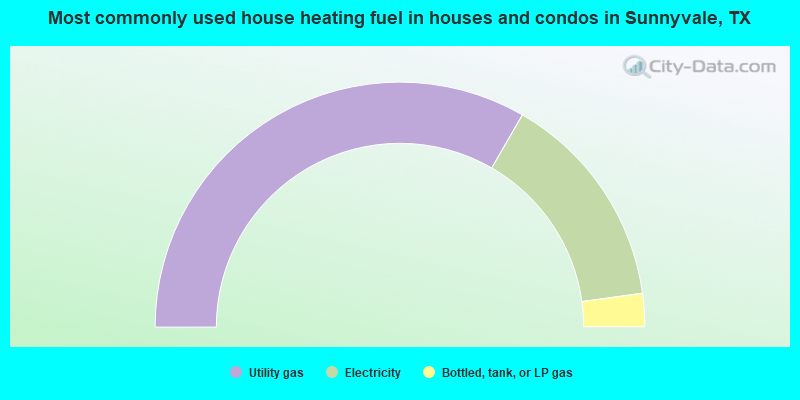
- 66.6%Utility gas
- 28.9%Electricity
- 4.4%Bottled, tank, or LP gas
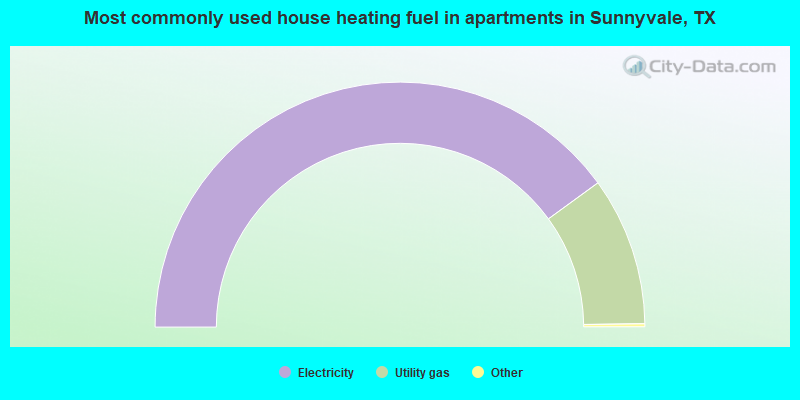
- 80.3%Electricity
- 19.7%Utility gas
Private vs. public school enrollment:
| Here: | 11.6% |
| Texas: | 8.8% |
| Here: | 5.5% |
| Texas: | 8.0% |
| Here: | 13.5% |
| Texas: | 16.2% |


