Sweeny, TX (Texas) Houses and Residents
| Sweeny: | $148,917 |
| Texas: | $275,400 |
Total population: 3,769 (Urban population: 3,511 (all inside urban clusters), Rural population: 60 (all nonfarm))
Houses: 1,821 (1,429 occupied: 988 owner occupied, 438 renter occupied)
| % of renters here: | 31% |
| State: | 38% |
Housing density: 978 houses/condos per square mile
Median price asked for vacant for-sale houses and condos in 2022 in this county: $390,007.
Median contract rent in 2022: $898 (lower quartile is $675, upper quartile is $995)
Median rent asked for vacant for-rent units in 2022: $1,341
Median gross rent in Sweeny, TX in 2022: $1,046
Housing units in Sweeny with a mortgage: 464 (0 second mortgage, 0 home equity loan, 0 both second mortgage and home equity loan)
Houses without a mortgage: 16
Median household income for houses/condos with a mortgage: $105,183
Median monthly housing costs: $913
Compare current foreclosures near Sweeny, TX:
| Photo | Address | Area | Beds / Baths | Price | Details |
|---|---|---|---|---|---|

|
#1
County Road 3
Sweeny, TX 77480
|
- sq. feet
|
3 baths - beds |
show details | |

|
#2
County Road 3
Sweeny, TX 77480
|
1,887 sq. feet
|
2 baths - beds |
show details | |

|
#3
County Road 332
Sweeny, TX 77480
|
3,586 sq. feet
|
3 baths - beds |
show details | |

|
#4
N Elm St
Sweeny, TX 77480
|
2,026 sq. feet
|
2 baths - beds |
show details | |

|
#5
Texas Ave
Sweeny, TX 77480
|
3,103 sq. feet
|
3 baths - beds |
show details | |

|
#6
Alice St
Sweeny, TX 77480
|
1,272 sq. feet
|
2 baths - beds |
show details | |

|
#7
County Road 683b
Sweeny, TX 77480
|
980 sq. feet
|
- baths - beds |
show details | |

|
#8
Private Road 525
Sweeny, TX 77480
|
1,014 sq. feet
|
- baths - beds |
show details | |

|
#9
Sycamore St
Sweeny, TX 77480
|
- sq. feet
|
- baths - beds |
show details | |

|
#10
Tx-35
Sweeny, TX 77480
|
- sq. feet
|
- baths - beds |
show details |
| Photo | Address | Area | Beds / Baths | Price | Details |
|---|---|---|---|---|---|

|
#11
Pecan St
Sweeny, TX 77480
|
- sq. feet
|
- baths - beds |
show details | |

|
#12
County Road 332
Sweeny, TX 77480
|
- sq. feet
|
- baths - beds |
show details | |

|
#13
Tx 35
Sweeny, TX 77480
|
- sq. feet
|
- baths - beds |
show details | |

|
#14
River Valley Dr
West Columbia, TX 77486
|
2,629 sq. feet
|
2 baths 4 beds |
show details | |

|
#15
Gardenia St
Lake Jackson, TX 77566
|
1,257 sq. feet
|
2 baths 4 beds |
show details | |

|
#16
Acacia St
Lake Jackson, TX 77566
|
1,256 sq. feet
|
1 baths 3 beds |
show details | |

|
#17
Southern Oaks Dr
Lake Jackson, TX 77566
|
- sq. feet
|
1 baths 2 beds |
show details | |

|
#18
Avenue G
Bay City, TX 77414
|
1,736 sq. feet
|
2 baths 4 beds |
show details | |

|
#19
Crocus St
Lake Jackson, TX 77566
|
2,102 sq. feet
|
2 baths 4 beds |
show details | |

|
#20
Tangerine Ct
Lake Jackson, TX 77566
|
1,722 sq. feet
|
1 baths 3 beds |
show details |
| Photo | Address | Area | Beds / Baths | Price | Details |
|---|---|---|---|---|---|

|
#21
Cypress St
Lake Jackson, TX 77566
|
- sq. feet
|
5 baths - beds |
show details | |

|
#22
Redwood St
Lake Jackson, TX 77566
|
1,284 sq. feet
|
1 baths - beds |
show details | |

|
#23
Mango St
Lake Jackson, TX 77566
|
1,427 sq. feet
|
2 baths - beds |
show details | |

|
#24
Walnut St
Lake Jackson, TX 77566
|
1,512 sq. feet
|
2 baths - beds |
show details | |

|
#25
Almond Dr
Lake Jackson, TX 77566
|
1,525 sq. feet
|
2 baths - beds |
show details | |

|
#26
Strawberry Dr
Lake Jackson, TX 77566
|
2,276 sq. feet
|
2 baths - beds |
show details | |

|
#27
Tulip Trl
Lake Jackson, TX 77566
|
1,717 sq. feet
|
2 baths - beds |
show details | |

|
#28
Huckleberry Dr
Lake Jackson, TX 77566
|
2,918 sq. feet
|
2 baths - beds |
show details | |

|
#29
Sexto St
Brazoria, TX 77422
|
1,580 sq. feet
|
2 baths - beds |
show details | |

|
#30
Caladium St
Lake Jackson, TX 77566
|
1,694 sq. feet
|
1 baths - beds |
show details |
| Photo | Address | Area | Beds / Baths | Price | Details |
|---|---|---|---|---|---|

|
#31
Beechwood St
Lake Jackson, TX 77566
|
1,489 sq. feet
|
2 baths - beds |
show details | |

|
#32
Freeman Blvd
West Columbia, TX 77486
|
2,136 sq. feet
|
2 baths - beds |
show details | |

|
#33
Gardenia St
Lake Jackson, TX 77566
|
833 sq. feet
|
1 baths - beds |
show details | |

|
#34
Elm Ct
Lake Jackson, TX 77566
|
1,283 sq. feet
|
1 baths - beds |
show details | |

|
#35
Masonic Oak Dr
Brazoria, TX 77422
|
2,036 sq. feet
|
2 baths - beds |
show details | |

|
#36
Red Oak Cir
Brazoria, TX 77422
|
1,392 sq. feet
|
2 baths - beds |
show details | |

|
#37
Spruce St
Lake Jackson, TX 77566
|
1,750 sq. feet
|
2 baths - beds |
show details | |

|
#38
Farm To Market 522 Rd
Brazoria, TX 77422
|
984 sq. feet
|
1 baths - beds |
show details | |

|
#39
Pan American Rd
Brazoria, TX 77422
|
1,768 sq. feet
|
3 baths - beds |
show details | |

|
#40
Avenue M
Bay City, TX 77414
|
- sq. feet
|
- baths - beds |
show details |
| Photo | Address | Area | Beds / Baths | Price | Details |
|---|---|---|---|---|---|

|
#41
Caladium St
Lake Jackson, TX 77566
|
- sq. feet
|
- baths - beds |
show details | |

|
#42
6th St
Bay City, TX 77414
|
1,245 sq. feet
|
- baths - beds |
show details | |

|
#43
Garland Dr Apt 139
Lake Jackson, TX 77566
|
- sq. feet
|
- baths - beds |
show details | |

|
#44
Manila Dr
Angleton, TX 77515
|
- sq. feet
|
- baths - beds |
show details | |

|
#45
Fm 1301 Rd
Pledger, TX 77468
|
- sq. feet
|
- baths - beds |
show details | |

|
#46
Brazos River Rd
Freeport, TX 77541
|
- sq. feet
|
- baths - beds |
show details | |

|
#47
Nichols Ave
Bay City, TX 77414
|
- sq. feet
|
- baths - beds |
show details | |

|
#48
Winchester Trl
Angleton, TX 77515
|
- sq. feet
|
- baths - beds |
show details | |

|
#49
County Road 158
Bay City, TX 77414
|
- sq. feet
|
- baths - beds |
show details | |

|
Check over 1 million property listings on Foreclosure.com!
|
browse all offers | |||

Latest news about housing in Sweeny, TX collected exclusively by city-data.com from local newspapers, TV, and radio stations

 | Can't decide between Sugar Land or Westbury (38 replies) |
| School Closings for the Houston area (5 replies) |
| FBISD to purchase land in TELFAIR for high school (47 replies) |
| Where inside the loop for young professional working far south of Houston taking 288 everyday? (13 replies) |
| Is Sweeny a good place to live? (3 replies) |
| Gone But Not Forgotten in San Antonio! - Part II (4905 replies) |

Median year apartment built: 1976
Household type by relationship:
Households: 3,732- Male householders: 522 (315 living alone), Female householders: 883 (204 living alone)
548 spouses (548 opposite-sex spouses), 55 unmarried partners, (55 opposite-sex unmarried partners), 1,275 children (1,275 natural, 0 adopted, 0 stepchildren), 128 grandchildren, 0 brothers or sisters, 195 parents, 0 foster children, 15 other relatives, 0 non-relatives
- In group quarters: 106
Size of family households: 297 2-persons, 307 3-persons, 99 4-persons, 87 5-persons, 115 7-or-more-persons.
Size of nonfamily households: 537 1-person.
499 married couples with children.
610 single-parent households (148 men, 462 women).
86.8% of residents of Sweeny speak English at home.
13.5% of residents speak Spanish at home (32% speak English very well, 46% speak English well, 22% speak English not well).
0.6% of residents speak other Indo-European language at home (100% speak English very well).
0.3% of residents speak Asian or Pacific Island language at home (100% speak English very well).
Foreign born population: 406 (10.9%)
(9.6% of them are naturalized citizens)
| Here: | 5.3 |
| State: | 6.3 |
| Here: | 4.5 |
| State: | 4.0 |

- Bedrooms in owner-occupied houses and condos in Sweeny, Texas
- 0no bedroom
- 01 bedroom
- 792 bedrooms
- 7763 bedrooms
- 404 bedrooms
- 945+ bedrooms

- Bedrooms in renter-occupied apartments in Sweeny, Texas
- 21no bedroom
- 641 bedroom
- 1532 bedrooms
- 1353 bedrooms
- 224 bedrooms
- 445+ bedrooms

- Cars and other vehicles available in Sweeny in owner-occupied houses/condos
- 54no vehicle
- 3321 vehicle
- 2692 vehicles
- 2083 vehicles
- 1254 vehicles
- 05+ vehicles

- Cars and other vehicles available in Sweeny in renter-occupied apartments
- 21no vehicle
- 1631 vehicle
- 2322 vehicles
- 223 vehicles
- 04 vehicles
- 05+ vehicles

- Rooms in owner-occupied houses in Sweeny, Texas
- 01 room
- 02 rooms
- 413 rooms
- 564 rooms
- 4505 rooms
- 1556 rooms
- 2257 rooms
- 628 rooms
- 09+ rooms

- Rooms in renter-occupied apartments in Sweeny, Texas
- 211 room
- 02 rooms
- 893 rooms
- 1134 rooms
- 555 rooms
- 956 rooms
- 07 rooms
- 08 rooms
- 669+ rooms


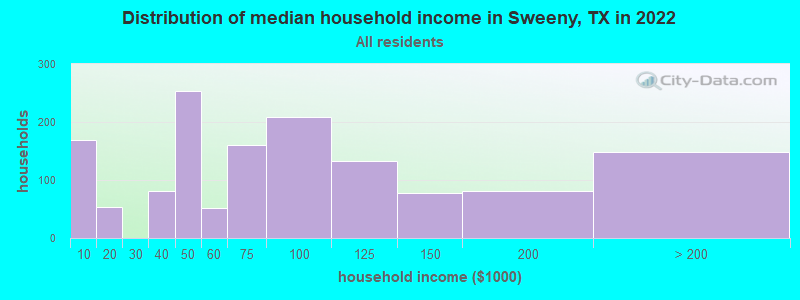
Sweeny, TX household income distribution

- 169Less than $10,000
- 53$10,000 to $19,999
- 81$30,000 to $39,999
- 254$40,000 to $49,999
- 51$50,000 to $59,999
- 161$60,000 to $74,999
- 209$75,000 to $99,999
- 133$100,000 to $124,999
- 77$125,000 to $149,999
- 81$150,000 to $199,999
- 148$200,000 or more
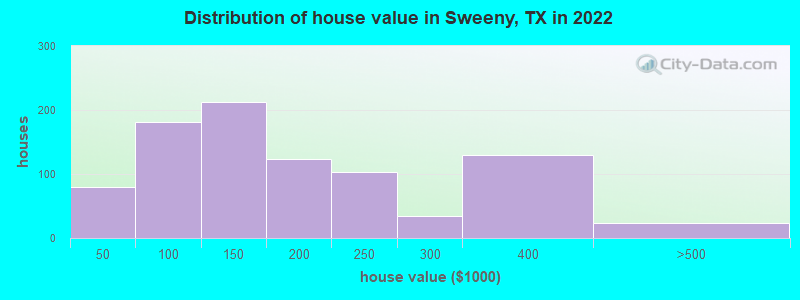
Home value of owner - occupied houses in 2022 in Sweeny, TX
-
- 7$10,000 to $14,999
- 38$30,000 to $34,999
- 33$40,000 to $49,999
- 13$50,000 to $59,999
- 97$70,000 to $79,999
- 36$90,000 to $99,999
- 135$100,000 to $124,999
- 77$125,000 to $149,999
- 81$150,000 to $174,999
- 40$175,000 to $199,999
- 103$200,000 to $249,999
- 34$250,000 to $299,999
- 128$300,000 to $399,999
- 23$400,000 to $499,999
Rent paid by renters in 2022 in Sweeny, TX
-
- 17$150 to $199
- 33$400 to $449
- 12$550 to $599
- 36$650 to $699
- 44$800 to $899
- 171$900 to $999
- 48$3,000 to $3,499
- 47No cash rent


Percentage of workers working in this county: 93.7%
Number of people working at home: 321 (21.6% of all workers)
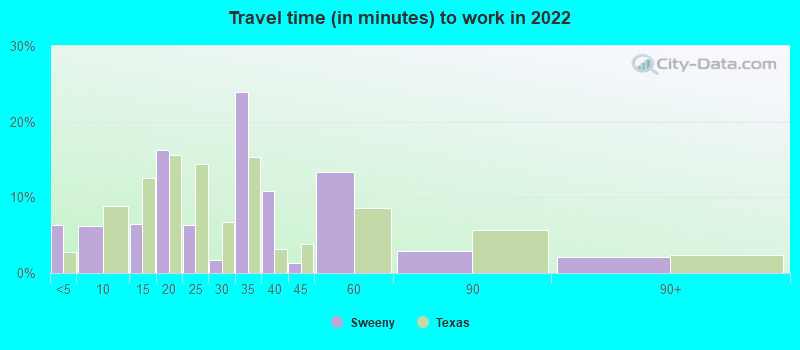
Travel time to work (commute)
- Less than 5 minutes: 118
- 5 to 9 minutes: 128
- 10 to 14 minutes: 191
- 15 to 19 minutes: 24
- 20 to 24 minutes: 184
- 25 to 29 minutes: 63
- 30 to 34 minutes: 310
- 35 to 39 minutes: 24
- 40 to 44 minutes: 171
- 45 to 59 minutes: 21
- 60 to 89 minutes: 0
- 90 or more minutes: 0
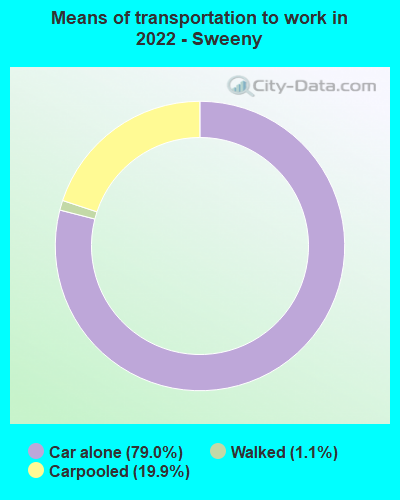
Means of transportation to work:
- Drove a car alone: 1,370 (66.4%)
- Carpooled: 412 (20.0%)
- Walked: 11 (0.5%)
- Worked at home: 291 (14.1%)

- Unemployment by race in 2022
- Unemployment rate for White non-Hispanic residents
- 7.8%Males
- 2.5%Females
- Unemployment rate for Black residents
- 100.0%Females

- Year of entry for the foreign-born population in Sweeny, Texas
- 82010 or later
- 02000 to 2009
- 01990 to 1999
- 441980 to 1989
- 221970 to 1979
- 23Before 1970

First ancestries reported:
- American: 213 (10.2%)
- European: 94 (4.5%)
- Irish: 94 (4.5%)
- English: 34 (1.6%)
- Dutch: 33 (1.6%)
- German: 23 (1.1%)
- French: 22 (1.1%)
- Czech: 17 (0.8%)
- Greek: 16 (0.8%)
- Czechoslovakian: 11 (0.5%)
- French Canadian: 5 (0.2%)
- African: 2 (0.10%)
Most common places of birth for foreign-born residents (%):
| Sweeny: | 88.8% (374) |
| Texas: | 48.4% (2,411,723) |
| Sweeny: | 4.0% (17) |
| Texas: | 0.3% (14,588) |
| Sweeny: | 1.9% (8) |
| Texas: | 6.1% (306,347) |
Place of birth for U.S.-born residents:
- This state: 2,680
- Other state: 637
- Northeast: 29
- Midwest: 101
- South: 314
- West: 193
86.6% of Sweeny residents lived in the same house 1 years ago.
Out of people who lived in different houses, 43.1% lived in this county.
Out of people who lived in different counties, 24.7% lived in Texas.
| Sweeny: | 86.6% |
| State average: | 85.7% |
Education attainment for males 25 years and older:
- No schooling: 164
- Nursery to 4th grade: 0
- 5th and 6th grade: 0
- 7th and 8th grade: 5
- 9th grade: 22
- 10th grade: 3
- 11th grade: 0
- 12th grade, no diploma: 0
- High school graduate (or equivalency): 415
- Less than 1 year of college: 138
- Some college more than 1 year, no degree: 181
- Associate degree: 79
- Bachelor's degree: 198
- Master's degree: 0
- Professional school degree: 66
- Doctorate degree: 0

Education attainment for females 25 years and older:
- No schooling: 161
- Nursery to 4th grade: 0
- 5th and 6th grade: 0
- 7th and 8th grade: 0
- 9th grade: 157
- 10th grade: 47
- 11th grade: 2
- 12th grade, no diploma: 29
- High school graduate (or equivalency): 346
- Less than 1 year of college: 36
- Some college more than 1 year, no degree: 146
- Associate degree: 62
- Bachelor's degree: 263
- Master's degree: 0
- Professional school degree: 0
- Doctorate degree: 0


Housing units in structures:
- One, detached: 1,252
- One, attached: 41
- Two: 73
- 3 or 4: 48
- 5 to 9: 29
- 10 to 19: 208
- 20 to 49: 111
- 50 or more: 14
- Mobile homes: 42
Housing units lacking complete kitchen facilities in 2022: 7.6%
House/condo owner moved in on average 12 years ago
Renter moved in on average 1 years ago

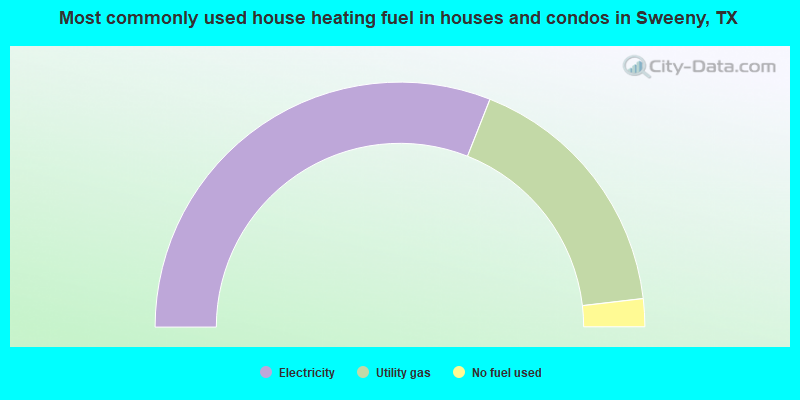
- 62.0%Electricity
- 34.3%Utility gas
- 3.7%No fuel used
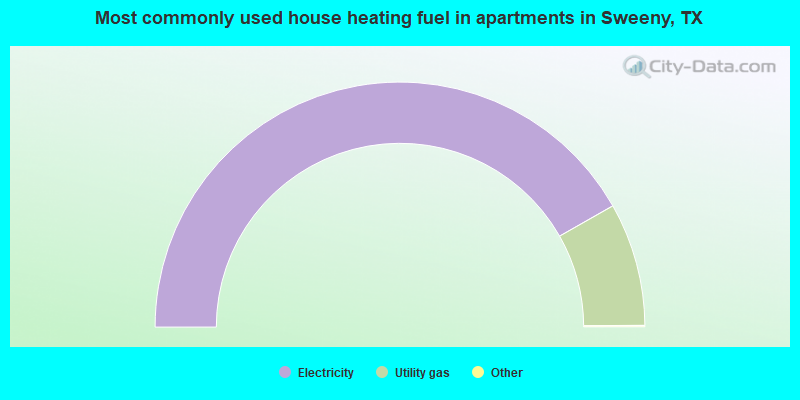
- 83.7%Electricity
- 16.3%Utility gas
Private vs. public school enrollment:
| Here: | 17.3% |
| Texas: | 8.8% |
| Here: | 0.0% |
| Texas: | 8.0% |
| Here: | 21.0% |
| Texas: | 16.2% |


